Simulating X-ray Supercavities and Their Impact on Galaxy Clusters
Abstract
Recent X-ray observations of hot gas in the galaxy cluster MS 0735.6+7421 reveal huge radio-bright, quasi-bipolar X-ray cavities having a total energy ergs, the most energetic AGN outburst currently known. We investigate the evolution of this outburst with two-dimensional axisymmetric gasdynamical calculations in which the cavities are inflated by relativistic cosmic rays. Many key observational features of the cavities and associated shocks are successfully reproduced. The radial elongation of the cavities indicates that cosmic rays were injected into the cluster gas by a (jet) source moving out from the central AGN. AGN jets of this magnitude must be almost perfectly identically bipolar. The relativistic momentum of a single jet would cause a central AGN black hole of mass to recoil at km s-1, exceeding kick velocities during black hole mergers, and be ejected from the cluster-center galaxy. Observed deviations from bipolar symmetry in the radio cavities can be caused by subsonic flows in the ambient cluster gas, but reflection shocks between symmetric cavities are likely to be visible in deep X-ray images. When the cavity inflation is complete, underestimates the total energy received by the cluster gas. Deviations of the cluster gas from hydrostatic equilibrium are most pronounced during the early cavity evolution when the integrated cluster mass found from the observed gas pressure gradient can have systematic errors near the cavities of 10-30%. The creation of the cavity with cosmic rays generates a long-lasting global cluster expansion that reduces the total gas thermal energy below that received from the cavity shock – even this most energetic AGN event has a net cooling effect on cluster gas. One Gyr after this single outburst, a gas mass of is transported out beyond a cluster radius of 500 kpc. Such post-cavity outflows can naturally produce the discrepancy observed between the cluster gas mass fraction and the universal baryon fraction inferred from WMAP observations.
Subject headings:
cosmic rays– cooling flows – galaxies: clusters: general – galaxies: active – X-rays: galaxies: clusters1. Introduction
The hot gas in galaxy clusters emits prolifically in X-rays, and has been extensively studied by X-ray telescopes Chandra and XMM-Newton, revealing complex structures such as X-ray cavities, thermal filaments, and weak shocks in the intracluster medium (ICM) as in the Perseus cluster (Fabian et al. 2006). These interesting structures are presumed to be related to the active galactic nuclei (AGNs) located at the cluster centers. Although the ICM in many clusters losses energy by radiation in a timescale much shorter than the cluster age, high-resolution X-ray spectroscopy indicates that the gas does not cool to low temperatures (e.g., Peterson et al. 2001, 2003; Tamura et al. 2001; for a review see Peterson & Fabian 2006). The deficit of cool-phase gas and young stars in cluster cores, often known as the ‘cooling flow’ problem, suggests that the ICM is prevented from the cooling catastrophe by one or more heating sources. Currently, heating of the ICM by central AGNs, as indicated by X-ray cavities and weak shocks, is regarded as the most successful energy source to balance radiative cooling (see McNamara & Nulsen 2007 for a recent review). Recent observations show that the AGN energies associated with X-ray cavities (, where is the average pressure of the gas surrounding the cavity, and is the cavity’s volume) are sufficient or nearly sufficient to stop the gas from cooling in most clusters containing detectable cavities (Rafferty et al., 2006). Furthermore, the mean power of these AGN outbursts increases in proportion to the cluster cooling luminosity (Bîrzan et al. 2004; Rafferty et al. 2006). This correlation suggests that AGN outbursts are triggered by the gas cooling and operates as a self-regulating feedback mechanism, which is shown to be essential in suppressing global thermal instability and thus in maintaining the ICM in the cool core state (Guo et al., 2008).
Despite these supportive clues, the detailed mechanisms that transfer the AGN jet energy to the thermal energy of the ICM are still far from clear. Numerical simulations have been extensively used to understand this process. X-ray cavities are usually thought to form at the tips of AGN-induced jets. During cavity formation, weak shock waves emerge as the gas is displaced, and heat the ICM (Brüggen et al., 2007). The buoyantly-rising cavities may induce sound waves, which may be viscously dissipated in the ICM and thus heat the gas (Ruszkowski et al. 2004; but see Mathews et al. 2006). Radio synchrotron emission has been observed from many X-ray cavities (Bîrzan et al., 2004), suggesting that the cavities are formed by AGN-induced cosmic rays (CRs), which may leak into the ICM and heat the gas (Guo & Oh, 2008).
In most previous simulations, for simplicity, it is assumed that X-ray cavities are filled with ultrahot thermal gas, but CR-filled cavities have received much less attention. The only explicit studies of the formation and evolution of X-ray cavities filled with CRs are Mathews & Brighenti (2008a), Mathews & Brighenti (2008b), and Mathews (2009), who show several interesting effects of CR-formed X-ray cavities: ICM heating due to weak shock generation, ICM cooling associated with cluster expansion and outward mass transfer, and the dynamical relationship between post-cavity X-ray filaments and extended radio lobes. However, these studies focus on low-energy cavities ( erg) in the Virgo cluster. In this paper, we apply the same model to study the remarkably large X-ray supercavities observed in the cluster MS 0735.67421 (hereafter MS0735), created by the most energetic AGN outburst known (McNamara et al., 2005; Gitti et al., 2007; McNamara et al., 2009). In this cluster, two approximately symmetric cavities are observed in X-ray images, each associated with relativistic gas emitting radio synchrotron emission. The energy released by this outburst is estimated to be erg, assuming an enthalpy of per cavity (Rafferty et al., 2006). Weak shocks have also been detected in MS0735; a simple spherically-symmetric shock model suggests that the age and driving energy of the shock are Myr and erg, respectively (McNamara et al., 2005). MS0735 has been studied numerically by Sternberg & Soker (2009), who assume that the cavities are formed by slow, massive, wide jets with a total injected energy of erg and a very large injected mass .
One of the main objectives of the current paper is to investigate if AGN bubbles created by cosmic rays can reproduce the observed morphology of giant X-ray supercavities in X-ray maps of MS0735. We show that the cavity morphology contains important information about the process of CR injection: CRs are likely to have been injected into the ICM at a series of locations (or continuously) along the direction of a jet as it moves outward, instead of at a fixed location (§ 3.1). We then follow the time evolution of the ICM energies during and after cavity creation and study the energetics of X-ray supercavities and their long-term influence on the cluster gas atmosphere. The investigation of this extremely powerful AGN outburst improves our understanding of how AGN outbursts affect the ICM, and their relevance in solving the cooling flow problem.
As the largest virialized structures in the universe, clusters of galaxies are useful cosmological probes, providing one of the current best constraints on the mean matter density , dark energy density , and the dark energy equation of state parameter (see Allen et al. 2008 and references therein). These constraints are usually based on accurate measurements of the X-ray gas mass fraction profile . In this paper, we study how the energetic AGN outburst in MS0735 affects the gas mass fraction by producing a buoyant outflow and global expansion of the cluster thermal gas. X-ray supercavities also have a significant effect on the assumptions of hydrostatic equilibrium and spherical symmetry, which are essential in measuring the cluster’s total mass profile from X-ray observations.
2. Equations and Numerical Setup
To study the dynamical effects of CRs on the hot cluster gas following this extremely powerful AGN outburst in MS0735, we assume that AGN outbursts inject cosmic rays into the ICM, producing the observed radio lobes, X-ray supercavities and weak shocks (McNamara et al., 2005; Gitti et al., 2007; McNamara et al., 2009). The combined evolution of the thermal ICM and cosmic rays may be described by the following four equations:
| (1) |
| (2) |
| (3) |
| (4) |
where is the Lagrangian time derivative, is the CR pressure, is the CR energy density, is the CR diffusion coefficient, is the CR source term due to the central AGN activity, and all other variables have their usual meanings. Pressures and energy densities are related via and , where we assume and . We do not include radiative cooling since our intention is to study the evolution of X-ray supercavities in the cluster MS0735 on timescales short compared to the multi-Gyr age of the cluster, i.e. we do not investigate the long-term balance between radiative cooling and intermittent heating by AGN outbursts. The same set of equations and underlying physical assumptions have been thoroughly described in Mathews & Brighenti (2008b) and Mathews (2009) where further details can be found. Here we simply summarize several modifications and reiterate some important points.
Equations (1) (4) are solved in cylindrical coordinates using a two-dimensional Eulerian code similar to ZEUS 2D (Stone & Norman, 1992); in particular, we have incorporated into the code a background gravitational potential, CR diffusion, and CR energy equation. The computational grid consists of equally spaced zones in both coordinates out to kpc plus an additional logarithmically-spaced zones out to Mpc. In view of this large computational domain, we adopt reflective boundary conditions for thermal gas and cosmic rays at the outer boundary as well as at the origin.
For initial conditions, we adopt analytic fits to the deprojected electron number density and temperature profiles observed by Gitti et al. (2007):
| (5) |
and
| (6) |
where
| (7) |
| (8) |
and is measured in kpc. The fits are shown as solid lines in Figure 4 (a) and (b). At the beginning of our simulation, the CR energy density is assumed to be zero throughout the cluster. The gravitational potential is set by assuming hydrostatic equilibrium at .
X-ray cavities are usually thought to be inflated by bipolar jets emanating from an AGN in the central galaxy. The approximately symmetric double-cavity morphology in MS0735 suggests that the outburst in this cluster was nearly bipolar-symmetric, as we assume here. The jets deposit relativistic cosmic rays into small regions at their terminal points, which expand and form underdense bubbles producing the observed X-ray cavities. The injection of cosmic rays into the ICM is described in equation (4) by the source term . Similar to Mathews & Brighenti (2008b) and Mathews (2009), we assume that the CRs are deposited into a Gaussian-shaped sphere of characteristic radius kpc located at :
| (9) |
where is the duration of the CR injection (AGN active phase), and is the total injected CR energy in one bubble ( for the whole cluster). The integral of over space gives the the CR injection luminosity associated with the creation of each bubble. To mimic the location and size of the observed X-ray cavity, we consider three cases for the location of the CR injection : (a) is fixed at kpc (adopted in run MS-1); (b) moves from to kpc at a constant speed during the CR injection phase (adopted in runs MS-2 and MS-2A); and (c) moves from to kpc with a constant deceleration during the CR injection phase (the speed drops to zero at kpc; adopted in run MS-3). See Table LABEL:table1 for specific model parameters in each run. The bulk kinetic energy of cosmic rays is negligible compared to the injected cosmic ray energy due to their negligible total rest mass. Here we assume that the energy that AGN jets deposit into the ICM is mainly in the form of cosmic rays, which are transported along the jets and created in strong shocks as the jets encounter the ICM. However, the energy content of real AGN jets is not clear and may also include magnetic energy, the internal and kinetic energies of thermal (and superthermal) gas. An MHD jet simulation including cosmic ray acceleration (and re-acceleration) mechanisms is required to fully understand this process.
In addition to their advection with the thermal gas, cosmic rays diffuse through the gas as described in equation (4). The CR diffusion coefficient is poorly known but may vary inversely with the gas density since the magnetic field is probably larger in denser gas (Dolag et al., 2001). As in Mathews & Brighenti (2008b) and Mathews (2009), we adopt the following functional dependence of the diffusion coefficient on the gas density:
| (10) |
where we take cm-3 in the rest of the paper. Models with different values of have been explored by Mathews & Brighenti (2008b) and the results are usually not very sensitive to it. During their diffusion, cosmic rays interact with magnetic irregularities and Alfvén waves, exerting CR pressure gradients on the thermal gas (equation 2). The shock generation and early evolution of cavities are mainly caused by the expansion of the surrounding gas driven by the CR pressure unless the coefficient of CR diffusion is so large (e.g., cm-3) that it significantly affects the morphology of cavities. We neglect other more complicated interactions of cosmic rays with thermal gas, e.g., Coulomb interactions, hadronic collisions, and hydromagnetic-wave-mediated CR heating, which depend on the cosmic ray energy spectrum and provide additional heating effects for the ICM (e.g., Guo & Oh 2008). We defer a thorough study of these effects to future work.
| 000The AGN energy released in the form of cosmic rays in one hemisphere during the outburst. | 000The duration of the active AGN phase. | 000) is the position where the cosmic rays are injected; see text in § 2 for three different ways of cosmic ray injection. | 000The time that the shock reaches kpc along the semi-minor axis (i.e., the age of the energetic outburst). | 000The Mach number of the shock along the semi-minor axis when it reaches kpc. | |
|---|---|---|---|---|---|
| Run | erg) | (Myr) | ( yr) | ||
| MS-1 | 4.5 | 10 | a | 1.10 | 1.41 |
| MS-2 | 3.8 | 10 | b | 1.16 | 1.41 |
| MS-3 | 3.5 | 10 | c | 1.23 | 1.41 |
| MS-2A | 3.8 | 50 | b | 1.38 | 1.34 |
3. Results
3.1. Morphology and Structure of X-ray Supercavities
Chandra observations show that the cluster MS0735 hosts two giant cavities. Each cavity is slightly elongated in the radial direction (‘prolate’) and is roughly kpc in (radial) diameter (McNamara et al., 2005, 2009). Weak shocks have also been detected; the shock front is roughly elliptical with a semimajor axis of kpc and a semiminor axis of kpc (Gitti et al., 2007). Along the semiminor axis (perpendicular to the cavity axis), the shock Mach number is estimated to be (McNamara et al., 2005).
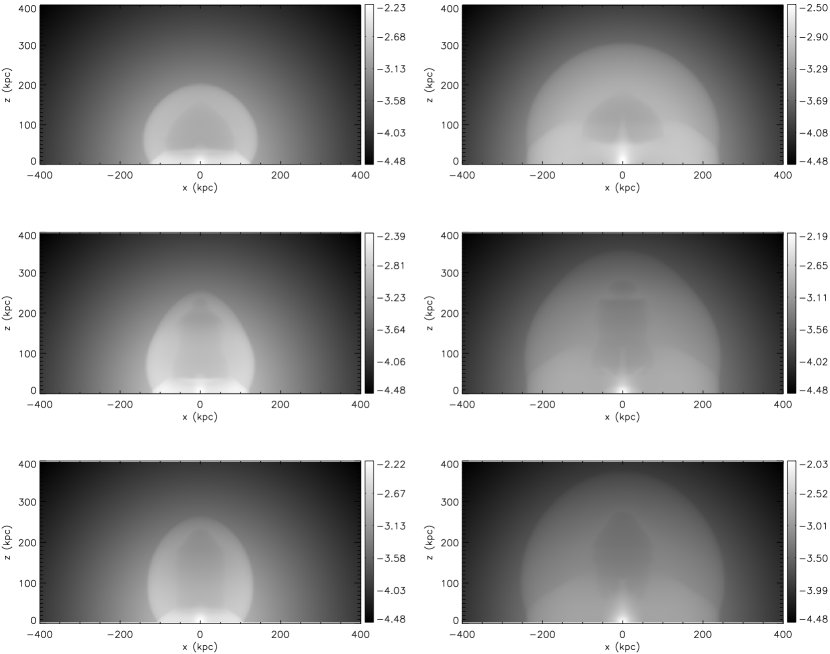
One of the primary goals of this study is to investigate whether AGN bubbles created by cosmic rays can reproduce these observational features. Adopting the radiative cooling function from Sutherland & Dopita (1993), we project the emissivity and produce synthetic X-ray maps of our runs at different times. Here is the total number density of ions and we take an average metallicity of (see Gitti et al. 2007). is related to the proton number density via , and thus the molecular weight is . Figure (1) shows synthetic X-ray surface brightness maps in logarithmic scale for our three typical models (MS-1, MS-2, MS-3) as listed in Table LABEL:table1 at two different times Myr (left panels) and (right panels), where is the time when the shock propagates to kpc along the semiminor axis, determining the age and energy of the outburst. X-ray deficient cavities and shock fronts are clearly seen in all these runs, which differ mainly in the location of cosmic ray injection. The CR injection time in all these runs is assumed to be Myr, and the injected CR energy is determined so that the shock along the semiminor axis has a Mach number of when propagating to kpc.
In run MS, cosmic rays are injected at a fixed position ( kpc in the axis). The top panels of Figure (1) show that the X-ray cavity has a roughly oblate shape. However, the observed cavity is elongated along the radial direction, which suggests that CRs may be injected into the ICM at a range of as the jet tip moves outward. Thus, in runs MS-2 and MS-3, we assume that moves from to kpc within (see § 2 for details). The middle and bottom panels clearly show radially prolate cavities, consistent with observations. Our methods of CR injection are probably idealized, but the resulting cavity shapes strongly suggest that CRs may indeed be injected into the ICM at a series of locations (or continuously) as AGN jets move outward, instead of at a fixed location as assumed by most authors (e.g., Ruszkowski et al. 2007; Brüggen et al. 2009).
Images of the cluster MS0735 combining both X-ray and radio wavelengths indicate that the X-ray cavities are filled with radio emission, as seen in Fig. 1 of McNamara et al. (2009). While the overall radio image in MS0735 has an approximate north-south bipolar symmetry relative to the cluster-centered galaxy, several deviations from perfect symmetry are apparent. Weak radio emission observed within about 50-70 kpc from the center has a noticeably different alignment. It is possible that the inner radio structure has been moved from an original north-south alignment by flows in the hot gas or that MS0735 has ejected radio plasma in several different directions. Most of the bright extended radio emission comes from radially elongated elliptical-shaped regions that are well separated from the cluster center. Considering a typical synchrotron-loss timescale of less than about Myr (depending on both the magnetic field strength and electron Lorentz factor) for relativistic electrons in clusters, the decline in radio flux close to the center of MS0735 could arise if the radio electrons deposited there have radiated most of their initial energy. This is consistent with our result that CRs are injected into the ICM at a series of locations (or continuously) as AGN jets move outward. Since electrons with lower energies have longer synchrotron-loss times and emit in longer wavelengths, future radio observations at different wavelengths could provide further insights regarding the formation and evolution of the MS0735 X-ray cavities.

Slices of logarithmic gas density through the cluster center are shown in Figure 2 for runs MS-1 (top panels) and MS-2 (bottom panels) at Myr (left) and (right). Contours show the logarithmic CR energy density. The bubbles are clearly seen as low-density regions along axis, where cosmic rays also concentrate. In run MS-2, where CRs are injected from to kpc along axis, the bubble structure at is much more complex than that in run MS-1, although the cavities in the projected X-ray surface brightness maps are simple and smooth in both cases. Since the prolate cavity in run MS-2 fits observation better, this raises the possibility that the cavities in X-ray maps may have a complex structure, with large variations of gas density and CR energy density at different locations inside cavities. Also of interest is the buoyant flow of the CR cavities. At the time of observation the dark cavities in Figure 2 have moved well away from the CR source regions, kpc for MS-1 and kpc for MS-2.
In addition to the shock confirmed by observation, another shock can be seen in each panel of Figure 1 and on closer inspection also in Figure 2. This second shock, obviously due to the reflection of the first shock at the symmetry boundary , represents the shock produced by the other identical cavity in the cluster at . It goes through the already shocked gas and has a much smaller Mach number (with a maximum value of far from the X-ray cavity). Observational efforts to detect this second shock (even non-detection) could provide interesting information on the geometry and simultaneity of bipolar jets and cavities in clusters.
3.2. Outburst Momentum and Black Hole Recoil
As the most powerful known AGN outburst, MS0735 highlights another fundamental concern regarding the joint evolution of massive elliptical galaxies and their central supermassive black holes – why the masses of the black holes stellar bulges are so strongly correlated (Ferrarese & Merritt 2000; Gebhardt et al. 2000). Since elliptical galaxies are commonly regarded as the end products of galaxy mergers, the black hole-stellar mass correlation suggests that the black holes merge in the same fashion as the surrounding stars. However, detailed studies show that asymmetric gravitational radiation emitted during the final stages of black hole mergers results in recoil black hole velocities km s-1 (Campanelli et al., 2007) sufficient to displace them far from the galactic cores (Madau & Quataert, 2004). Nevertheless, dedicated searches for peculiar AGN recoil velocities or binary AGNs have resulted in surprisingly few candidates.
However, active, jet-emitting black holes in powerful radio galaxies like MS0735 could also receive very large recoil kicks if the jets are not exactly balanced by an identical counterjet. Suppose for example that the total energy ergs contained in each large cavity of MS0735 is purely relativistic with a mass equivalent of . If this energy was supplied to the cavity by a relativistic jet as observations indicate, its momentum gm cm s-1 is sufficient to produce a recoil velocity of km s-1 for a black hole of mass . This velocity is large enough to completely eject the massive black hole from typical group and cluster-centered elliptical galaxies (Merritt et al., 2004). To avoid this undesired fate, it is necessary that the momentum of the MS0735 jets, and those of other powerful radio galaxies, are created in almost identical oppositely directed jet and counter-jet pairs during the entire period of intense jet activity which may last tens of million years.
While a pair of identical opposing jets may not always result in identical cavities, it is not unreasonable to expect such cavity pairs to be quite common, at least in their early development. If so, we would expect the shocks from each young cavity to collide at the symmetry plane perpendicular to the jet axis, reflecting as an additional outgoing shock similar to those shown in Figure (1) which should be visible in deep X-ray images. However, X-ray images of nearby clusters like Perseus and Virgo – as well as more distant clusters like MS0735 – often show cavities or cavity-related thermal features that appear to have no counterpart or misaligned counterparts in the opposite hemisphere.
In particular, the image of MS0735 in McNamara et al. (2009) shows that the two radio lobes and their associated X-ray cavities are not mirror images of each other. The most plausible explanation for this is that the cavities have been pushed aside and distorted by motions in the nearby hot cluster gas. We estimate from this figure that the cavities have been displaced transverse to their common jet axis by at least a distance of kpc. At the location of the radio cavities the sound speed in the hot gas is km s km s-1 (for ) and the hot gas density is gm cm-3. Can the non-axisymmetric radio emission dislocations seen in MS0735 be generated by subsonic flows in the ambient gas? To create the observed spatial perturbations in MS0735, consider a ram pressure acting on the radio lobe of area (where kpc and kpc for the northern lobe in MS0735) which accelerates the lobe by in time yrs. The required gas velocity, km s-1 is very much less than the sound speed, suggesting that purely relativistic radio lobes are extremely vulnerable to distortion by very modest flows in the ambient cluster gas.
However, it is likely that the jet that produced the radio emitting cavities in MS0735 acquired significant masses of very hot but non-relativistic gas during their passage to the cavity. Suppose for simplicity that the pressure of this non-relativstic gas dominates in the cavities and that the cavities are in pressure equilibrium with the local gas, . The ellipsoidal cavity mass is now and the ram velocity required to move the cavity a distance , , is 350 and 110 km s-1 for and 500 keV respectively. As before, it is plausible that the cluster gas in MS0735 has subsonic velocities of this magnitude, so the lack of mirror symmetry in the radio sources tells little about their mass content or the almost perfect cancellation of the jet momentum that created them. Nevertheless, a statistical study of the distortion and transverse displacement of radio lobes or X-ray cavities would contain information about cluster gas velocity fields and the baryonic component in the radio cavities.
3.3. Energetics and Heating Effects
Since the morphologies of the cavity and shock front in run MS-2 agree with observations very well, we take it as our fiducial model to study the effects of the energetic AGN outburst on the cluster MS0735 in the rest of the paper.
The top panel of Figure 3 shows time evolution of global energies integrated over the whole cluster in run MS-2. (solid lines) represents the total injected CR energy until time , which equals to the overall increase of cluster energies, including the gas kinetic energy (short dashed lines), the change in gas thermal energy (dotted lines), the change in gas potential energy (dot dashed), and the total CR energy (long dashed lines). Clearly, is much less than the total injected CR energy during the CR injection phase, indicating that CRs lose a significant fraction of their initial energy due to work and shock generation. At time (the left dotted vertical line), more than of the injected CR energy has been converted into thermal and kinetic energies as the thermal gas is shocked. The CR energy lost during the injection phase is expected to be less if the same amount of energy is injected over a longer timescale. To check this explicitly, we performed another run MS-2A for comparison, which is the same as run MS-2, except that the CR injection timescale is much longer ( Myr). The resulting energy evolution, plotted in the lower panel of Figure 3, confirms that less () of the injected CR energy has been converted into gas thermal and kinetic energies at the end of the injection phase. We therefore conclude that a large fraction () of the AGN energy is delivered to the ICM during the formation of X-ray cavities through shock generation driven by work. This fraction increases with the CR luminosity during the CR injection phase.
The evolution of the gas thermal and potential energies in Figure 3 suggests that the thermal energy of the ICM responds to cavities in two competing ways. On the one hand, cavities directly heat the ICM through weak shocks, as clearly shown by the increase of thermal energy with time during Myr in Figure 3. On the other hand, as cosmic rays displace cluster gas, the entire cluster expands (see Fig. 5 and § 3.4 for more details) and thus cools as the gravitational potential energy of the cluster increases. Local heating dominates during the early stage of cavity evolution, while expansion cooling dominates during the later stage when the shock becomes much weaker. This is indicated by the decline of and the accompanying increase of gravitational energy during Myr in Figure 3. This ‘global cooling’ effect has been explicitly discussed by Mathews & Brighenti (2008b) for a much less powerful AGN outburst in Virgo cluster ( erg); our new results for MS0735 suggest that it is likely to be a universal feature of AGN outbursts regardless of their energy.
Figure 4 shows radial profiles of emission-weighted spherically-averaged gas quantities, including (a) electron number density, (b) temperature, (c) pressure, and (d) gas entropy () in runs MS-2 and MS-2A. At , the gas density in inner regions, which are already affected by the AGN activity, drops in both models, confirming that the cluster is undergoing global expansion. Consequently, the expansion of these regions results in a drop in the gas temperature, as seen in the short dashed line in Figure 4b for run MS-2A. In run MS-2, the CRs are injected in a much shorter timescale, resulting in stronger shock heating, which surpasses the effect of global expansion at time . Thus the central cluster gas temperature and entropy both increase in run MS-2 (see Fig. 4d). At later times, , cooling by global expansion begins to dominate. As explained by Mathews & Brighenti (2008b), the expansion of cluster gas lasts much longer than the cavity since the volume of gas displaced by the initial cavity is approximately preserved after the CRs diffuse widely into the cluster gas.


3.4. Effects on the Gas Mass Fraction
By assuming that clusters contain a proportional share of all cosmic baryons, cluster gas mass fractions () have been used as a probe of the universal ratio of baryon to total matter densities, , providing one of the current best constraints of when combined with accurate determinations of from cosmic nucleosynthesis calculations or observations of cosmic microwave background (CMB) anisotropies. Furthermore, measurements of the apparent evolution of with redshift can be used to constrain the dark energy content of the universe (see Allen et al. 2008 and references therein). While cluster baryon mass fractions seem to provide convincing cosmological constraints, systematic uncertainties, especially the apparent effects of cooling and heating on the distribution of baryons within clusters, must be well understood and controlled (see relevant discussions in Borgani & Kravtsov 2009). It has been noticed that cluster baryon fractions estimated from X-ray observations are significantly lower than the universal baryon fraction inferred from WMAP data (Ettori, 2003; Vikhlinin et al., 2006; McCarthy et al., 2007); in particular, Vikhlinin et al. (2006) found that for a sample of Chandra clusters, gas mass fractions within are around -, a factor of - below the universal baryon fraction 0.167 (Komatsu et al., 2009). Such a discrepancy cannot be contained in the stellar/cool baryon contribution (e.g., McCarthy et al. 2007).
However, the baryon fraction profile can be created and shaped by AGN outbursts. Figure 5 shows the time evolution of the cumulative spherical gas mass (top panel) and of its fractional change (bottom panel) in run MS-2, where is defined as the total gas mass within a cluster-centric radius . Comparing gas mass profiles at different times, one can clearly see that, as a result of cavity formation, the cluster undergoes a global expansion and gas mass is gradually transported outward. After Myr, the radial profile of in the central regions (within kpc) becomes quite steady and within kpc about of the initial gas mass has been transported to outer cluster regions. At Gyr, around 4% of the gas mass originally within kpc, , has been transported outward. Note that, kpc for MS0735 (Gitti et al., 2007). During the lifetime of clusters, a series of intermittent AGN outbursts are expected to be triggered, preventing the formation of strong cooling flows and transporting a significant fraction of the cluster gas to large radii. This large post-cavity outflow can explain most of the discrepancy between the cluster baryon mass fraction and the universal baryon fraction inferred from WMAP data. Without correcting for this effect, systematic errors inevitably occur when using at ( is typically - kpc for galaxy clusters; see Vikhlinin et al. 2006 and Allen et al. 2008) to constrain cosmological parameters; for instance, will be systematically overestimated.
An interesting feature of Figure 5 is that the post-cavity fractional change of the gas mass decreases with radius, well beyond the kpc CR source region for run MS-2. This directly results in the trend that the gas mass fraction within a cluster-centric radius increases with , which is consistent with observations (e.g., Fig. 7 of Pratt et al. 2009). This may also naturally explain the observational fact that the cluster gas mass fraction within (or ) increases with cluster temperature (e.g., see Fig. 21 of Vikhlinin et al. 2006). For higher-temperature clusters, (or ) is usually larger, and thus a smaller fraction of the baryon gas is transported beyond this radius if the strength of AGN outbursts does not increase proportionally to overtake this effect. On the other hand, McCarthy et al. (2007) suggested that the discrepancy between the cluster baryon mass fraction and the universal baryon fraction inferred from WMAP data is mainly due to the fact that the actual value of is higher than the best-fitting WMAP value. We argue that this explanation would result in a constant gas mass fraction across all clusters, which is apparently inconsistent with observations. For galaxy groups, observations show that the gas mass fraction at is around , considerably smaller than the typical value of for clusters. The gas fraction also increases with the mean temperature in galaxy groups (Sun et al., 2009).
It was argued by McCarthy et al. (2007) that the total energy required to produce this discrepancy by transporting gas mass outward may be extremely large ( erg). However, their simple calculations assume arbitrary extrapolations of gas density profiles to cluster outer regions not yet observed, where the transported gas, which determines the required increase in the gas potential energy, is located. On the other hand, our simulations directly show that single strong AGN outbursts transport a significant amount of gas outward, and the increase of potential energy during the cluster expansion is accompanied by the decrease of thermal energy, as gas moves outward down the thermal pressure gradient (see the evolution of thermal and potential energies in Fig. 3). Consequently, the total AGN energy needed to explain the gas mass fraction discrepancy, i.e., the net increase of the total cluster energy, may not be energetically prohibitive. Further investigation of this is obviously beyond the scope of the current paper, and is thus left to future work.
The effect of AGN outbursts on the gas fraction has been studied with cosmological simulations of galaxy clusters by Puchwein et al. (2008). Using a simple model for AGN mechanical heating, they find that AGN heating significantly reduces gas fraction within in groups and poor clusters while having much lesser effects on massive clusters. The analytical study by Pope (2009) also suggests that AGN energy injection redistributes the ICM within the cluster central regions. These findings are consistent with our detailed simulations: the effect of AGN outbursts on gas fraction decreases with radius, and becomes quite small at for massive clusters ( kpc for MS0735; Gitti et al. 2007). However, observations indicate that increases with at least up to (Pratt et al., 2009), which is roughly the largest radius for which Chandra and XMM-Newton data require no model extrapolation. It may suggest that the central AGN produces some X-ray cavities at radii much larger than what we assume here, which transport a large amount of gas out of , and are difficult to detect due to low X-ray surface brightness in these outer regions. Alternatively, it is also possible that massive clusters are formed from mergers of less massive systems, which have already lost a significant amount of gas by AGN outbursts. Further studies are required to determine which scenario dominates.

3.5. Assumptions of Hydrostatic Equilibrium and Spherical Symmetry

By assuming hydrostatic equilibrium and spherical symmetry, radial profiles of cluster gas density and temperature have been widely used to measure the total gravitational mass within radius , (e.g., Gitti et al. 2007):
| (11) |
where is the gravitational constant, is the Boltzmann constant, is the proton mass, and is the molecular weight. Although this method provides one of the current best measurements of mass profiles for relaxed clusters, the underlying assumptions, i.e., spherical symmetry and hydrostatic equilibrium, must be carefully tested. Systematic errors, in particular the non-thermal pressure support from CRs or turbulent motions, have been extensively investigated by cosmological simulations (see Nagai et al. 2007 and references therein). Here we study how X-ray supercavities, which have yet to be included in cosmological simulations, affect the measurements of cluster mass profiles found using equation (11).
For simplicity, we ignore self-gravity of the thermal gas. Thus the total gravitational mass, which is dominated by dark matter, does not evolve with time in our simulations. Figure 6 shows radial profiles of the total gravitational mass in run MS-2 calculated at various times using equation (11) and the emission-weighted spherically-averaged gas density and temperature profiles (see Fig. 4). The solid line in Figure 6 represents the cluster mass profile before the AGN outburst, while the dotted line shows the mass profile at yrs when the shock propagates to kpc along the semiminor axis. By comparing these two lines, one can clearly see that the total cluster mass measured by equation (11) at is not very accurate for kpc, which is exactly the region most strongly affected by the X-ray supercavities (see the right-bottom panel of Fig. 2). As the cavity rises in the cluster atmosphere, the ICM near the cavity is significantly disturbed, which can be easily seen in the spherically-averaged radial temperature and density profiles (the top two panels of Figure 4). Thus, both the assumptions of hydrostatic equilibrium and spherical symmetry are violated, and equation (11) does not hold very well in the cavity region when . Since is also the time when the deprojected gas temperature and density profiles were observed by Gitti et al. (2007), the varying slope visible in our initial mass distribution (solid line in Figure 6) near the cavity region also deviates somewhat from the expected Navarro-Frenk-White (NFW) form (Navarro et al., 1997). This unavoidable deviation does not affect our conclusions which are all based on the differential changes in the cluster gas due to the cavities. The dashed line in Figure 6 represents the cluster mass measured by equation (11) at a much later time, Gyr, when the X-ray supercavity has already been destroyed. At this time, the dashed line agrees very well with the solid line in regions kpc, indicating that the cluster has returned to hydrostatic equilibrium and spherical symmetry and equation (11) provides a very accurate measure of the cluster mass. At kpc in Figure 6 the dashed line oscillates around the solid line due to outward-propagating weak shocks produced by the outburst. Evidently, more accurate total mass determinations for MS0735 using equation (11) could be found from observations of and in cluster quadrants that avoid the cavity region.
In summary, our simulations show that X-ray cavities produced by AGN outbursts may significantly disturb the cluster gas near the cavities and the assumptions of hydrostatic equilibrium and spherical symmetry may thus not hold very well in these regions. This results in systematic errors in measuring the cluster mass using spherically-averaged profiles of gas density and temperature. For the powerful outburst in the cluster MS0735, the typical error in at radii near the cavities is around , but may be much larger in some local regions. We have also done similar calculations with much less energetic AGN outbursts, and found that the cavities created are smaller and thus affect smaller cluster regions. X-ray cavities do not affect the measurements of cluster mass in the regions far away from them, in particular, in the cluster outer regions (e.g., ).
4. Summary and Discussion
By conducting a suite of two-dimensional axisymmetric hydrodynamical simulations, we investigated the formation and evolution of the X-ray supercavities recently observed in the cluster MS0735, which is the most energetic AGN outburst known. We assume that the X-ray supercavities are inflated by cosmic rays injected from AGN jets, and follow the co-evolution of the cluster gas and the CRs. We then study the thermal and hydrodynamic effects of this energetic AGN outburst on the cluster MS0735. Here we briefly summarize our main findings:
1. X-ray deficient cavities and weak shocks are successfully created by AGN-generated cosmic rays. In particular, run MS-2 reproduces very well many characteristic observational features of the cluster MS0735, such as the size and location of the cavities, the location and strength of the shock. In this run, the age and total energy of this AGN outburst are Myr and erg, consistent with previous estimates (McNamara et al., 2005, 2009).
2. Assuming that X-ray cavities are generated by relativistic AGN jets, the jet that produced the north cavity in run MS-2 had a momentum which must be balanced by an almost identical southerly jet ejection. Otherwise, a one-sided jet in MS0735 would cause its AGN black hole to attain a recoil velocity of km s-1, which is large enough to completely eject a massive black hole from the center of even the most massive elliptical galaxies and their surrounding group or cluster dark matter halos (Merritt et al., 2004). The radio emission from the cavities in MS0735, while clearly bipolar, is not perfectly symmetric. This could be due to the production of somewhat different cavities, perhaps at different cluster radii, by two jets that were identical when they left the AGN. In addition, we show that small subsonic motions in the hot gas of MS0735 are sufficient to explain the axisymmetric cavity radio and X-ray emission observed. However, if the cavities formed by the two opposing jets were initially approximately equal in power and formed at similar distances from the cluster center, the shocks expanding away from each cavity would collide at the symmetry plane, producing a second, somewhat weaker shock in each hemisphere as seen in our Figure 1. Efforts should be made to detect these symmetry shocks in deep X-ray images since they contain information about the identical nature of the two jets and their cavities.
3. Run MS-1, where CRs are injected at a fixed location, produces an oblate, radially-flattened X-ray cavity unlike the observed cavity which is radially elongated. In contrast, in run MS-2 which fits observations very well, the CRs are injected continuously along the jet direction as it moves away from the cluster center. The radial elongation of the cavity may also be produced if the CRs are injected at a series of locations along the jet direction.
4. During the CR injection phase, more than half of the injected CR energy is converted into thermal and kinetic energy of the ICM. The CRs lose energy thorough work and shock generation as they displace the cluster gas. For instance, of the injected CR energy has been lost at yrs in run MS-2. The fraction of initial CR energy lost at time increases with the CR luminosity during the injection phase.
5. The thermal energy of the ICM responds to CR-generated cavities in several complex ways. As the cavities are inflated in MS0735, shocks are driven into the surrounding gas, heating the local ICM. Mixing by CR buoyancy may also increase the gas entropy near the post-cavity site as relatively low entropy, CR-enriched gas near the cluster core flows outward with the CRs and is replaced by inflowing gas of higher-entropy. On the other hand, the production of new cavities causes the cluster gas to readjust outwards in the cluster, increasing its global potential energy and decreasing its thermal energy (cooling) as its density decreases. Local heating by cavity shocks dominates during the early stage of cavity evolution, whereas cooling by global expansion dominates at later times, when the total cluster thermal energy decreases below the original cluster thermal energy before the outburst. Thus, from a global perspective, the cluster gas is eventually cooled by the cavity, as previously shown by Mathews & Brighenti (2008b) for a low-energy outburst in the Virgo cluster. We have now confirmed this for the cluster MS0735 which is undergoing the most powerful AGN outburst known. This ultimate allocation of cavity energy is likely to be universal for all AGN outbursts.
6. The creation of X-ray supercavities in MS0735 with CRs produces a huge, long-lasting outward migration of cluster gas to large radii. This mass outflow arises because of the global cluster expansion due to the gas displaced as the cavity forms and heating by outward-propagating shock waves driven by the expanding cavity. The mass outflow following the single energetic outburst in MS073 is large. Repeated AGN outbursts may naturally explain why the cluster baryon mass fraction in MS0735 and other similar clusters is much less than the universal baryon fraction inferred from WMAP data, and why it increases with the cluster temperature.
7. X-ray supercavities significantly disturb the cluster gas near them, locally invalidating the assumptions of hydrostatic equilibrium and spherical symmetry. This results in systematic errors (typically around for MS0735) in measuring the cluster mass in these regions using spherically-averaged gas density and temperature profiles.
8. Assuming that X-ray cavities are filled with relativistic CRs, is often used to estimate the energy released by each AGN jet. When combined with a typical (buoyant) cavity lifetime , the jet power can be estimated and compared with the bolometric X-ray luminosity of the cluster gas (Bîrzan et al., 2004). Since the total CR energy contained inside the cavity is , where is the average CR energy density in the cavity, about of the jet energy () is delivered to the ICM during the cavity formation in these approximations. In our simulations, we directly studied the energetics of the cavity, and find that more than half of the injected CR energy goes into the ICM, i.e., the CR energy lost during the cavity formation is actually more than . This fraction increases with the CR luminosity. Although provides an approximate estimation for AGN jet energy, the actual AGN energy may be a few times larger (typically ). This is consistent with previous simulations of cavities produced by (non-relativistic) thermal jets (Binney et al., 2007), which, due to the additional inclusion of a large amount of kinetic energy in thermal jets, find that AGN energy is around , even larger than our estimation. Our calculations further show that begins to decrease after the cavity formation as CRs diffuse through the cavity walls (Mathews & Brighenti, 2008b). More generally, if underestimates the cluster jet power, it becomes easier to match this heating with the bolometric radiative losses as proposed by Bîrzan et al. (2004) and Rafferty et al. (2006).
We ignore direct interactions of CRs with the ambient cluster gas, e.g., Coulomb interactions, hadronic collisions and interactions through the generation of hydromagnetic waves, which may become important especially when the cavities are disrupted and when the CRs are mixed with the ICM (Guo & Oh, 2008). These interactions may provide significant heating effects for the thermal gas. One byproduct of these interactions is the generation of through the decay of neutral pions, which may be studied by the recently-launched Fermi telescope (Ando & Nagai, 2008; Mathews, 2009). Previous cluster observations with the High Energy Stereoscopic System (HESS) have not detected these signals in the VHE ( GeV) band, providing upper limits on fluxes and ratios of cosmic ray pressure to thermal pressure in galaxy clusters (e.g., Domainko et al. 2009).
The center of each cavity in the cluster MS0735 is located at a projected cluster-centric radius of around kpc, which is much larger than the average projected cluster radius of kpc for X-ray cavities typically observed in clusters (Bîrzan et al., 2004). If strong AGN outbursts having energies similar to that of MS0735 create X-ray cavities much closer to the cluster center than those observed in MS0735, they produce much stronger heating in the cluster cool core and may even fully destroy it, transforming a cool core cluster to a non-cool core cluster (Guo & Oh, 2009). It is of great interest to investigate if metallicity peaks at cluster centers are also destroyed in this process, producing much flatter metallicity profiles as observed in non-cool core systems (e.g., De Grandi & Molendi 2001; Baldi et al. 2007). We will thoroughly investigate these models in a follow-up paper.
References
- Allen et al. (2008) Allen, S. W., Rapetti, D. A., Schmidt, R. W., Ebeling, H., Morris, R. G., & Fabian, A. C. 2008, MNRAS, 383, 879
- Ando & Nagai (2008) Ando, S., & Nagai, D. 2008, MNRAS, 385, 2243
- Baldi et al. (2007) Baldi, A., Ettori, S., Mazzotta, P., Tozzi, P., & Borgani, S. 2007, ApJ, 666, 835
- Binney et al. (2007) Binney, J., Alouani Bibi, F., & Omma, H. 2007, MNRAS, 377, 142
- Bîrzan et al. (2004) Bîrzan, L., Rafferty, D. A., McNamara, B. R., Wise, M. W., & Nulsen, P. E. J. 2004, ApJ, 607, 800
- Borgani & Kravtsov (2009) Borgani, S., & Kravtsov, A. 2009, preprint (arXiv:0906.4370)
- Brüggen et al. (2007) Brüggen, M., Heinz, S., Roediger, E., Ruszkowski, M., & Simionescu, A. 2007, MNRAS, 380, L67
- Brüggen et al. (2009) Brüggen, M., Scannapieco, E., & Heinz, S. 2009, MNRAS, 395, 2210
- Campanelli et al. (2007) Campanelli, M., Lousto, C. O., Zlochower, Y., & Merritt, D. 2007, Physical Review Letters, 98, 231102
- De Grandi & Molendi (2001) De Grandi, S., & Molendi, S. 2001, ApJ, 551, 153
- Dolag et al. (2001) Dolag, K., Schindler, S., Govoni, F., & Feretti, L. 2001, A&A, 378, 777
- Domainko et al. (2009) Domainko, W., Nedbal, D., Hinton, J. A., & Martineau-Huynh, O. 2009, International Journal of Modern Physics D, 18, 1627
- Ettori (2003) Ettori, S. 2003, MNRAS, 344, L13
- Fabian et al. (2006) Fabian, A. C., Sanders, J. S., Taylor, G. B., Allen, S. W., Crawford, C. S., Johnstone, R. M., & Iwasawa, K. 2006, MNRAS, 366, 417
- Ferrarese & Merritt (2000) Ferrarese, L., & Merritt, D. 2000, ApJ, 539, L9
- Gebhardt et al. (2000) Gebhardt, K., et al. 2000, ApJ, 539, L13
- Gitti et al. (2007) Gitti, M., McNamara, B. R., Nulsen, P. E. J., & Wise, M. W. 2007, ApJ, 660, 1118
- Guo & Oh (2008) Guo, F., & Oh, S. P. 2008, MNRAS, 384, 251
- Guo & Oh (2009) —. 2009, MNRAS, 400, 1992
- Guo et al. (2008) Guo, F., Oh, S. P., & Ruszkowski, M. 2008, ApJ, 688, 859
- Komatsu et al. (2009) Komatsu, E., et al. 2009, ApJS, 180, 330
- Madau & Quataert (2004) Madau, P., & Quataert, E. 2004, ApJ, 606, L17
- Mathews (2009) Mathews, W. G. 2009, ApJ, 695, L49
- Mathews & Brighenti (2008a) Mathews, W. G., & Brighenti, F. 2008a, ApJ, 676, 880
- Mathews & Brighenti (2008b) —. 2008b, ApJ, 685, 128
- Mathews et al. (2006) Mathews, W. G., Faltenbacher, A., & Brighenti, F. 2006, ApJ, 638, 659
- McCarthy et al. (2007) McCarthy, I. G., Bower, R. G., & Balogh, M. L. 2007, MNRAS, 377, 1457
- McNamara et al. (2009) McNamara, B. R., Kazemzadeh, F., Rafferty, D. A., Bîrzan, L., Nulsen, P. E. J., Kirkpatrick, C. C., & Wise, M. W. 2009, ApJ, 698, 594
- McNamara & Nulsen (2007) McNamara, B. R., & Nulsen, P. E. J. 2007, ARA&A, 45, 117
- McNamara et al. (2005) McNamara, B. R., Nulsen, P. E. J., Wise, M. W., Rafferty, D. A., Carilli, C., Sarazin, C. L., & Blanton, E. L. 2005, Nature, 433, 45
- Merritt et al. (2004) Merritt, D., Milosavljević, M., Favata, M., Hughes, S. A., & Holz, D. E. 2004, ApJ, 607, L9
- Nagai et al. (2007) Nagai, D., Vikhlinin, A., & Kravtsov, A. V. 2007, ApJ, 655, 98
- Navarro et al. (1997) Navarro, J. F., Frenk, C. S., & White, S. D. M. 1997, ApJ, 490, 493
- Peterson & Fabian (2006) Peterson, J. R., & Fabian, A. C. 2006, Phys. Rep., 427, 1
- Peterson et al. (2003) Peterson, J. R., Kahn, S. M., Paerels, F. B. S., Kaastra, J. S., Tamura, T., Bleeker, J. A. M., Ferrigno, C., & Jernigan, J. G. 2003, ApJ, 590, 207
- Peterson et al. (2001) Peterson, J. R., et al. 2001, A&A, 365, L104
- Pope (2009) Pope, E. C. D. 2009, MNRAS, 395, 2317
- Pratt et al. (2009) Pratt, G. W., et al. 2009, preprint (arXiv:0909.3776)
- Puchwein et al. (2008) Puchwein, E., Sijacki, D., & Springel, V. 2008, ApJ, 687, L53
- Rafferty et al. (2006) Rafferty, D. A., McNamara, B. R., Nulsen, P. E. J., & Wise, M. W. 2006, ApJ, 652, 216
- Ruszkowski et al. (2004) Ruszkowski, M., Brüggen, M., & Begelman, M. C. 2004, ApJ, 611, 158
- Ruszkowski et al. (2007) Ruszkowski, M., Enßlin, T. A., Brüggen, M., Heinz, S., & Pfrommer, C. 2007, MNRAS, 378, 662
- Sternberg & Soker (2009) Sternberg, A., & Soker, N. 2009, MNRAS, 398, 422
- Stone & Norman (1992) Stone, J. M., & Norman, M. L. 1992, ApJS, 80, 753
- Sun et al. (2009) Sun, M., Voit, G. M., Donahue, M., Jones, C., Forman, W., & Vikhlinin, A. 2009, ApJ, 693, 1142
- Sutherland & Dopita (1993) Sutherland, R. S., & Dopita, M. A. 1993, ApJS, 88, 253
- Tamura et al. (2001) Tamura, T., et al. 2001, A&A, 365, L87
- Vikhlinin et al. (2006) Vikhlinin, A., Kravtsov, A., Forman, W., Jones, C., Markevitch, M., Murray, S. S., & Van Speybroeck, L. 2006, ApJ, 640, 691