An Intriguing Chromospheric Jet Observed by Hinode: I. Fine Structure Kinematics and Evidence of Unwinding Twists
Abstract
We report a chromospheric jet lasting for more than 1 hr observed by Hinode Solar Optical Telescope in unprecedented detail. The ejection occurred in three episodes separated by 12–14 min, with the amount and velocity of material decreasing with time. The upward velocities range from 438 to , while the downward velocities of the material falling back have smaller values (mean: ) and a narrower distribution (standard deviation: ). The average acceleration inferred from parabolic space-time tracks is , a fraction of the solar gravitational acceleration. The jet consists of fine threads (– wide), which exhibit coherent, oscillatory transverse motions perpendicular to the jet axis and about a common equilibrium position. These motions propagate upward along the jet, with the maximum phase speed of at the leading front of the jet. The transverse oscillation velocities range from to , amplitudes from to , and periods from to . The oscillations slow down with time and cease when the material starts to fall back. The falling material travels along almost straight lines in the original direction of ascent, showing no transverse motions. These observations are consistent with the scenario that the jet involves untwisting helical threads, which rotate about the axis of a single large cylinder and shed magnetic helicity into the upper atmosphere.
Subject headings:
Sun: atmospheric motions—Sun: flares—Sun: chromosphere—Sun: corona—Sun: transition region1. Introduction
Transient, small-scale ejections of plasma from the lower atmosphere are common manifestations of solar activity. Cool plasma ejections were observed as emission in H or absorption at other wavelengths and historically called surges (Newton, 1934). Hot ejections were usually called jets and observed as emission in ultraviolet (Brueckner & Bartoe, 1983), extreme ultraviolet (EUV; Alexander & Fletcher, 1999), and soft X-rays (Shibata et al., 1992; Strong et al., 1992). Some observations (Schmieder et al., 1988; Chae et al., 1999; Jiang et al., 2007) have indicated that cool surges and hot jets are closely related in space and time, but their physical relationship has not been established. Torsional motions or helical features have long been seen in surges or jets (e.g., Xu et al., 1984; Kurokawa et al., 1987; Shimojo et al., 1996; Patsourakos et al., 2008), while their exact causes remain unclear. From now on, we refer to both surges and jets with a general term jets, unless otherwise noted.
Solar jets are commonly associated with flux emergence (Roy, 1973b) or moving magnetic features (Gaizauskas, 1982; Brooks et al., 2007). Models involving magnetic reconnection have thus been proposed (e.g., Rust, 1968; Yokoyama & Shibata, 1995). Mechanisms (see review in Canfield et al., 1996) suggested for accelerating jet material to 10–1000 include reconnection outflows driven by the slingshot effect of magnetic tension (Yokoyama & Shibata, 1995), the pressure gradient behind the shock formed by reconnection outflows (Yokoyama & Shibata, 1996; Tarbell et al., 1999), chromospheric evaporation caused by heating from the associated flare (Shimojo & Shibata, 2000), and relaxation of magnetic twists (Shibata & Uchida, 1985).
Hinode (Kosugi et al., 2007), with its superior resolutions, has provided unprecedented details and spurred renewed interest in solar jets. They were found to be ubiquitous on various spatial and temporal scales in the Ca II H line (Shibata et al., 2007; Nishizuka et al., 2008), EUV (Culhane et al., 2007; Moreno-Insertis et al., 2008), and soft X-rays (Savcheva et al., 2007; Nitta et al., 2008). In this Letter, we report an intriguing jet observed by Hinode in great detail, and attempt to obtain new clues to some unanswered questions mentioned above.
2. Observations and Data Analysis
The chromospheric jet under study occurred from 02:40 to 04:20 UT on 2007 February 9 in AR 10940 on the west limb, accompanied by a GOES A4.9 flare. It was observed by the Solar Optical Telescope (SOT; Tsuneta et al., 2008) and X-Ray Telescope on board Hinode, and by TRACE, STEREO, RHESSI, and several ground-based observatories. The SOT observations were obtained in the Ca II H line passband, sensitive to chromospheric temperatures of 1–2. The high spatial resolution () and cadence (8 s) allowed us to investigate the fine structures and kinematics of the jet, which are the focus of this Letter. A comprehensive study of this event using multiwavelength data will be presented in the future.
We processed Ca images with the standard fg_prep routine, and cross-correlated neighboring images to correct for pointing drifts, with a sub-arcsecond accuracy over a 2 hr duration. The absolute solar coordinates were determined by fitting the limb and are thus approximate with uncertainties in the roll angle. We then applied a radial filter to reduce the contrast between the bright disk and faint emission above the limb, and finally deconvolved the images with the SOT point spread function determined using the lunar limb during eclipses (C. DeForest, 2009, private communication) to sharpen fine features.
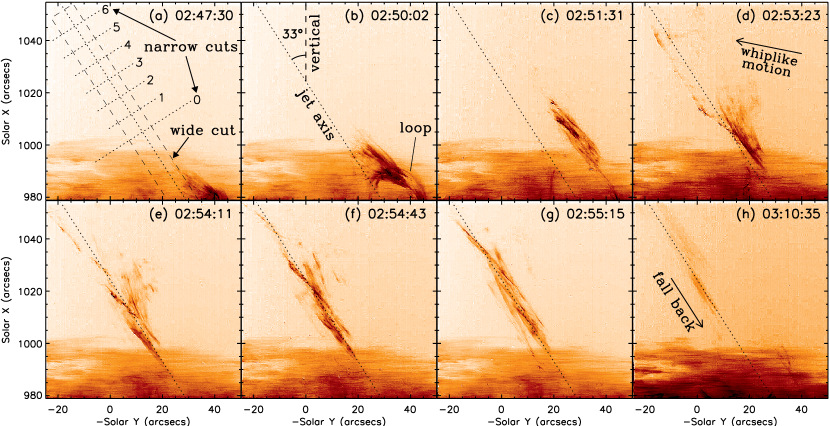
A sample of the resulting images are rotated clockwise by and plotted in Figure 1, showing the evolution of the jet. We find that the precursor of the jet appeared at 02:40 UT as a bundle of fine material threads (typical widths: –) at 40∘ from the photosphere extending to a height of 20. With these threads exhibiting oscillatory transverse motions across its axis, this bundle rose up, first gradually and then rapidly, and an overarching loop grew simultaneously (Figure 1(b)). At 02:51:31 UT, the bundle started to swing back to the left in a whiplike manner (Figure 1(d)), similar to that in simulated cool () jets (Yokoyama & Shibata, 1995). Meanwhile, with their transverse motions continuing, the threads were ejected upwards (Figures 1(d)–(g)). Later in the event up to 04:20 UT, material bound by gravity fell back to the chromosphere along the original paths of ascent. In contrast to those of the ascending material, the streamlines of the falling material were almost straight lines, with no detectable transverse motions (Figure 1(h)).
To quantify the kinematics of the jet, we constructed an orthogonal coordinate system based on the jet orientation. We first visually determined the axis passing through the center of the jet when it was fully developed and collimated (e.g., Figure 1(g)). This axis (dotted diagonal line in Figure 1) is located in the sky plane and at from the local vertical on the equator, and its intersection with the photosphere is defined as the origin for measuring the distance along the jet. We used a wide cut (dashed box in Figure 1(a)) along the axis, and averaged pixels across the width to obtain the time-distance diagram for the axial motions. Likewise, we selected 7 narrow cuts ( wide, numbered 0–6) perpendicular to and centered at the jet axis to study the transverse motions. These narrow cuts are uniformly spaced by and Cut 0 is positioned at from . The distance across the jet along the narrow cuts is measured from upper-right to lower-left in Figure 1(a) with located at the jet axis.
2.1. Axial Motions along Jet
The axial motions of material along the jet are represented by the time-distance diagram (Figure 2(a)) from the wide cut. The upward (downward) tracks correspond to ascending (falling) material. Some tracks show deceleration and change from upward to downward within the SOT field of view (FOV). We visually identified all unambiguous, straight-shaped portions of upward tracks just before deceleration and of downward tracks at the lowest altitudes where they are visible. We fitted these tracks linearly and show the fits and velocities in Figures 2(a) and (b).
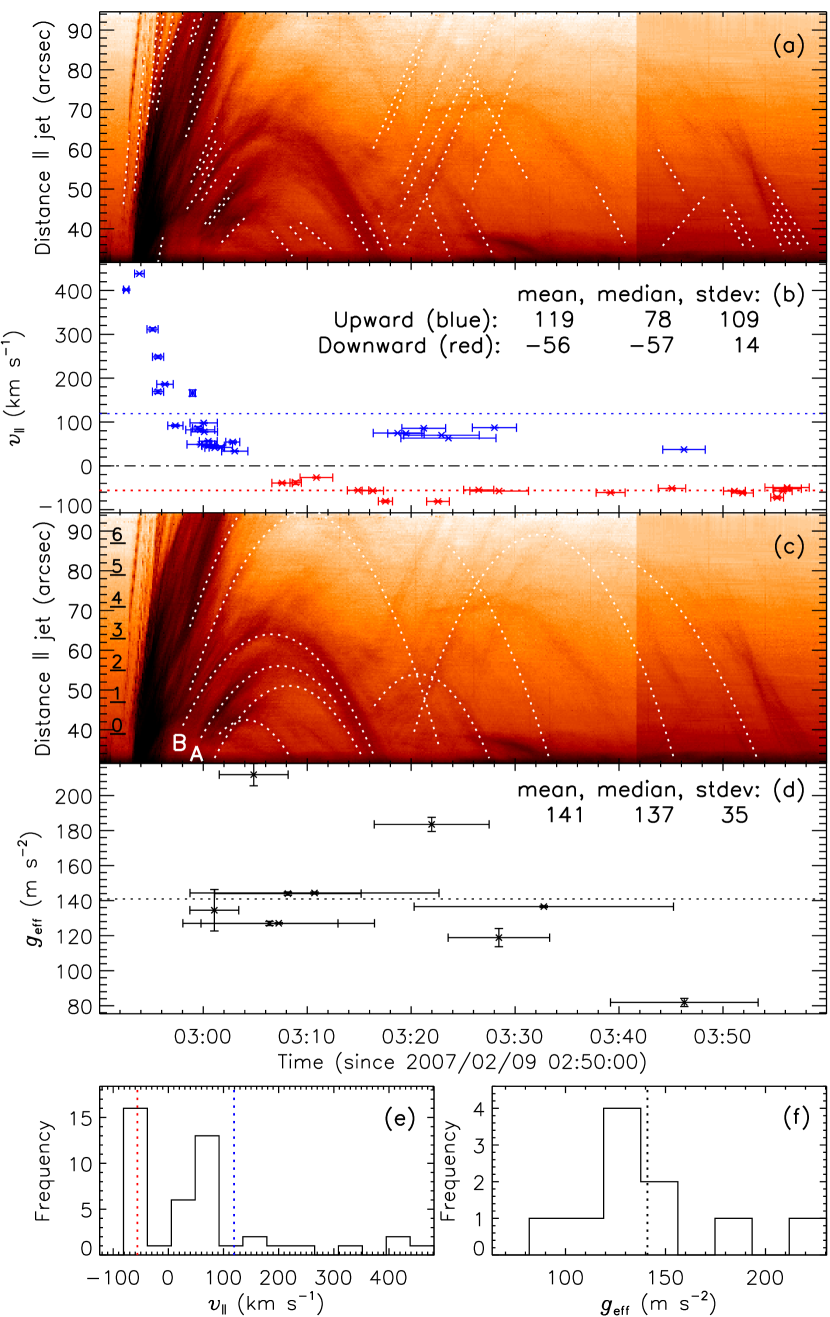
As is evident, there are three episodes of material ejections, separated by 12–14 min. The number of tracks and amount of material of these episodes decrease with time; so do the mean and scatter of the upward velocities. During the first episode alone, the velocity rapidly decreases from to within 9 min. The mean and standard deviation of all the upward velocities are and , respectively. In contrast, for the falling material, the downward velocities have less distinct episodes with a much smaller mean and scatter, and these values are and (Figures 2(b) and (e)).
For those tracks showing clear concave curvatures (see Figure 2(c)), we fitted their positions with a parabolic function of time ,
| (1) |
where is the effective gravitational acceleration, and and are the initial position and velocity at . The fitted values of (Figures 2(d) and (f)) have a mean and standard deviation of and , respectively. The component of the solar gravitational acceleration along the jet axis ranges from at the photosphere to at the top of the FOV (radial position ). Our fitted is only a fraction of these values. Possible explanations for this apparent discrepancy include that: (1) the jet is likely to be oriented out of the sky plane due to the line-of-sight effect, such that the discrepancy would be smaller, and (2) the force driving the mass ejection, possibly at lower levels late in the event, could still reduce the effect of gravity. Note that Roy (1973a) also found in H surges the acceleration of falling material being less than free-fall, but the deceleration of ascending material being greater than gravity alone.
2.2. Transverse Motions across Jet
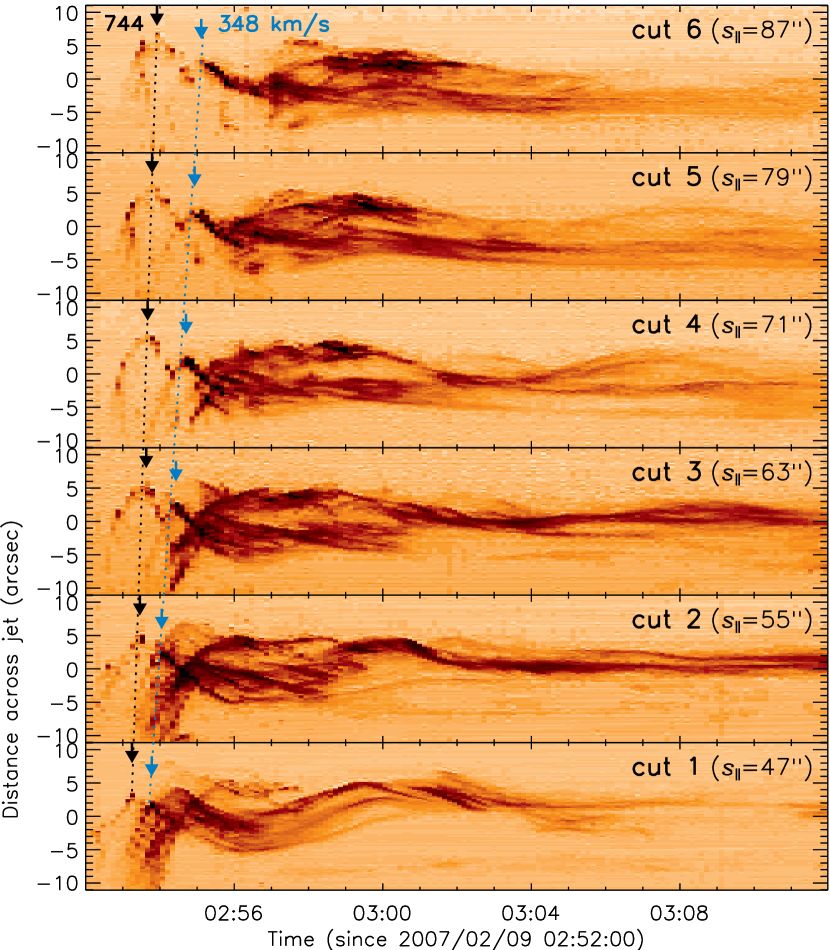
The time-distance plot (Figure 3) from the narrow cuts clearly shows oscillatory transverse motions perpendicular to the jet during the first episode of material ejection. These oscillations propagate along the jet to higher altitudes, as indicated by the time delays across different cuts. We identified the first inverted-V shaped track in each panel, and by linearly fitting the axial positions of the cuts vs. the occurrence times of the track crest (indicated by the dark arrows), we obtained a phase speed of . The propagation of the second such track (indicated by the blue arrows) is 50% slower at . We also note that the oscillation amplitude decreases with time in each cut. At a higher cut, the separations between the threads become larger and various phase delays appear in their oscillations.
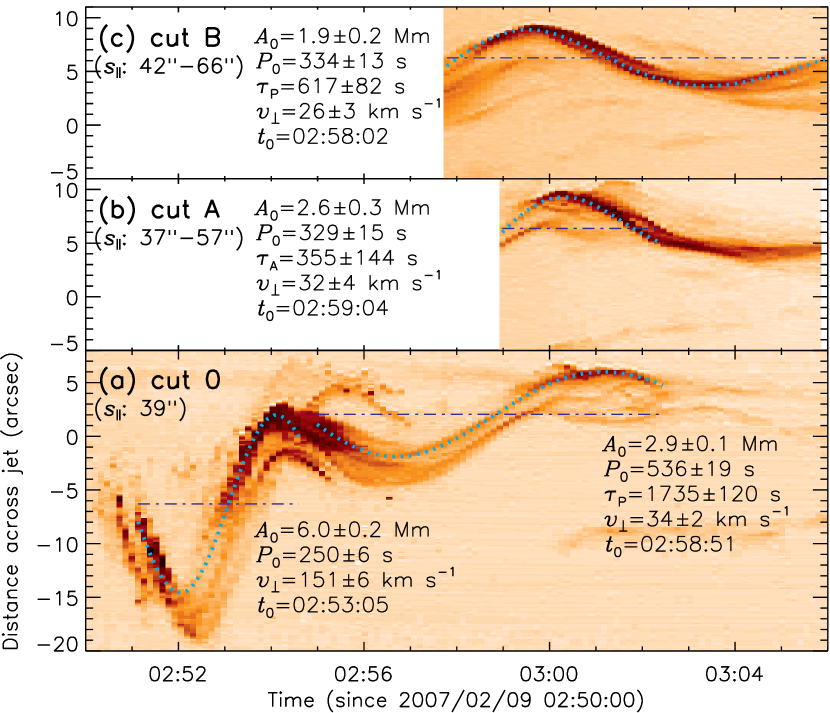
To quantify the transverse oscillations, we used the time-distance plot of Cut 0 as an example (Figure 4(a)), in which such motions are the most pronounced. We fitted the piecewise oscillatory tracks with a damped sine function:
| (2) | |||||
where is the amplitude, and is the period, with and being their damping time. We find a rapid oscillation at the beginning of the event, corresponding to the rise and whiplike swing of the entire bundle mentioned earlier. The fitted transverse velocity at the equilibrium position near the middle of this track duration is , and the amplitude and period at are and . This is followed by a slower oscillation with the amplitude halved and the period doubled, giving a velocity of .
We also moved the narrow cut with time along the jet axis to keep up with the upward moving material and to remove the effect of its axial motion. The time-distance diagrams of such co-moving Cuts A and B are shown in Figures 4(b) and (c) for the upward tracks A and B marked in Figure 2(c), respectively. Their damped sine fits yield transverse velocities similar to that of the second oscillation of the stationary Cut 0 noted above.
3. Discussions
The simplest and most intuitive scenario that can tie together the above observations is that the jet is composed of helical threads undergoing untwisting spins, as proposed by Shibata & Uchida (1985, 1986) and Canfield et al. (1996). In this scenario, a highly-twisted emerging flux rope or existing filament reconnects with less twisted “open” field lines, along which the stored twists and magnetic helicity are transported to the upper atmosphere. We interpret our observations in this framework as follows.
Chirality. The alternate and mutual shadowing of multiple threads consistently over time suggests that the threads oriented as crossing the jet axis from lower right to upper left are on the front side (closer to the observer), while those crossing from lower left to upper right are on the far side (Figures 1(d)–(g)). These threads, assumed to represent magnetic field lines, are thus left-handed screws. The former threads are seen to traverse the jet axis from left to right, while the latter from right to left. Their transverse motions (see online movie 1) are thus counter-clockwise rotations when looking from above along the jet axis. The trajectories of the material, considering its upward axial motion, are thus right-handed helices. This is consistent with the unwinding of twisted field lines of the opposite handedness inferred here, as indicated by surge observations (Canfield et al., 1996; Jibben & Canfield, 2004) and 3D MHD simulations (Pariat et al., 2009).
Oscillatory transverse motions111The apparent transverse motions at cuts 1–6 shown in Figure 3 result from the rotation about and the translation along the jet axis of individual unwinding helical threads. However, at the lowest narrow cut (Cut 0), since the bundle of threads is packed as a whole and extends almost parallel to the jet axis, Figure 4(a) represents mainly the true rotation of the entire bundle. So do Figures 4(b) and (c) for the co-moving cuts. across the jet, in general, can be understood as the projections of rotations about an axis in the sky plane. The initial rotation of the entire bundle, in particular, appears in a counter-clockwise coning manner, and its velocity is 5-fold greater than the other rotations during this event, but comparable to the velocity of whiplike or transverse motions reported for surges or jets (Canfield et al., 1996; Shimojo et al., 2007). The rest of the rotational velocities around and periods in the 330–540 s range are comparable to those of transverse oscillations found in X-ray jets (Cirtain et al., 2007), prominences (Okamoto et al., 2007), and coronal loops (Ofman & Wang, 2008), which were interpreted as signatures of transverse MHD or Alfvén waves. The angular velocities inferred from Doppler measurements in H surges are on the order of (Xu et al., 1984; Gu et al., 1994; Jibben & Canfield, 2004), which translates to a period of . These rotations are 10 times slower than reported here, although their axial velocities are only fractionally smaller.
Axial motions. Propagating torsional Alfvén waves associated with unwinding twists can explain the observed delays of the transverse motions with distance along the jet. The initial phase speed (Figure 3) would correspond to the untwisting front or progressing pinch front which, according to Shibata & Uchida (1985), propagates at the Alfvén speed. Proposed driving mechanisms of jet material also include torsional Alfvén waves (Pariat et al., 2009) and the force in the untwisting helices (Shibata & Uchida, 1985). The decrease with time of the upward velocities as shown in Figures 2(a)–(b) indicates that the pitch spacing between adjacent helical threads increases with height. This is consistent with the expected axial expansion of unwinding screws.
Temporal evolution. We find a slowdown of the transverse motions (see Figures 3 and 4), which accompanies the decrease of the axial velocity (Figure 2(b)). In particular, when the rotations of Cuts A and B stop (Figures 4(b) and (c)) near 03:06–03:08 UT, the corresponding ascending material reaches its maximum height and starts to fall back. On its return, the material follows paths that are almost straight lines (until above the photosphere) along the jet axis and shows no detectable transverse motions. Assuming the paths are along magnetic field lines, this means very little or no twist in the post-eruption field. This provides further evidence for the causal link between the jet and unwinding twists and for the role played by the jet in shedding away twists or magnetic helicity.
An alternative to our rotation interpretation is planar waves, which seem, however, difficult to explain some of the observations (see online movie 1): (1) Multiple threads are seen to undergo coherent, oscillatory transverse motions, one following another with consistent phase delays and reversing their direction of motion at roughly the same distance from the jet axis. This is consistent with surge observations (Canfield et al., 1996) and can be readily understood if these threads are distributed on a single rotating cylindrical surface. (2) Likewise, some sheet-shaped material volumes periodically change their appearances in a way as if they are on the surface of a rotating cylinder. To distinguish between these two interpretations with certainty, simultaneous high-resolution Ca images and H Doppler measurements are needed and can both be obtained with SOT (but unavailable for this event).
4. Conclusions
We have presented kinematic measurements of both axial and transverse motions of a chromospheric jet observed by Hinode SOT at high spatial and temporal resolutions. This study complements previous low resolution counterparts of H surges and EUV or X-ray jets, and offers new insights to this type of phenomena. Our major results and interpretations are as follows.
-
1.
The ejection occurs in three episodes separated by 12–14 min, rather than continuously. The amount and velocity of ejected material decrease with time. The ejecting velocities have a wide range from 438 to , while the velocities of material falling back have a narrow range (mean: and standard deviation: ). The acceleration inferred from parabolic tracks in the time-distance diagram has a mean of , a fraction of the solar gravitational acceleration.
-
2.
The jet consists of – thick fine threads, which exhibit oscillatory transverse motions across the jet about a common equilibrium position. These oscillations have velocities ranging from to , amplitudes from to , and periods from to . The upward propagation of the oscillations has a maximum phase speed of (comparable to the coronal Alfvén speed) associated with the leading front of the jet.
-
3.
The transverse motions slow down with time and cease near the time when the material reaches its maximum height and starts to fall back. The falling material travels along almost straight lines in the original direction of ascent, showing no more signatures of transverse motions.
-
4.
These observations are consistent with the scenario that the jet involves unwinding of left-handed helical threads that rotate counter-clockwise about a common axis. The untwisting wave front propagates upward at the Alfvén speed. The pitch spacing between adjacent helical threads increases with height, consistent with the expected axial expansion of unwinding screws. The jet results in magnetic helicity being shed into the upper atmosphere.
A more in-depth multiwavelength study of this event and comparison with theoretical models are underway and will be published in the future.
References
- Alexander & Fletcher (1999) Alexander, D. & Fletcher, L. 1999, Sol. Phys., 190, 167
- Brooks et al. (2007) Brooks, D. H., Kurokawa, H., & Berger, T. E. 2007, ApJ, 656, 1197
- Brueckner & Bartoe (1983) Brueckner, G. E. & Bartoe, J.-D. F. 1983, ApJ, 272, 329
- Canfield et al. (1996) Canfield, R. C., Reardon, K. P., Leka, K. D., Shibata, K., Yokoyama, T., & Shimojo, M. 1996, ApJ, 464, 1016
- Chae et al. (1999) Chae, J., Qiu, J., Wang, H., & Goode, P. R. 1999, ApJ, 513, L75
- Cirtain et al. (2007) Cirtain, J. W., et al. 2007, Science, 318, 1580
- Culhane et al. (2007) Culhane, L., et al. 2007, PASJ, 59, 751
- Gaizauskas (1982) Gaizauskas, V. 1982, Advances in Space Research, 2, 11
- Gu et al. (1994) Gu, X. M., Lin, J., Li, K. J., Xuan, J. Y., Luan, T., & Li, Z. K. 1994, A&A, 282, 240
- Jiang et al. (2007) Jiang, Y. C., Chen, H. D., Li, K. J., Shen, Y. D., & Yang, L. H. 2007, A&A, 469, 331
- Jibben & Canfield (2004) Jibben, P. & Canfield, R. C. 2004, ApJ, 610, 1129
- Kosugi et al. (2007) Kosugi, T., et al. 2007, Sol. Phys., 243, 3
- Kurokawa et al. (1987) Kurokawa, H., Hanaoka, Y., Shibata, K., & Uchida, Y. 1987, Sol. Phys., 108, 251
- Moreno-Insertis et al. (2008) Moreno-Insertis, F., Galsgaard, K., & Ugarte-Urra, I. 2008, ApJ, 673, L211
- Newton (1934) Newton, H. W. 1934, MNRAS, 94, 472
- Nishizuka et al. (2008) Nishizuka, N., Shimizu, M., Nakamura, T., Otsuji, K., Okamoto, T. J., Katsukawa, Y., & Shibata, K. 2008, ApJ, 683, L83
- Nitta et al. (2008) Nitta, N. V., Mason, G. M., Wiedenbeck, M. E., Cohen, C. M. S., Krucker, S., Hannah, I. G., Shimojo, M., & Shibata, K. 2008, ApJ, 675, L125
- Ofman & Wang (2008) Ofman, L. & Wang, T. J. 2008, A&A, 482, L9
- Okamoto et al. (2007) Okamoto, T. J., et al. 2007, Science, 318, 1577
- Pariat et al. (2009) Pariat, E., Antiochos, S. K., & DeVore, C. R. 2009, ApJ, 691, 61
- Patsourakos et al. (2008) Patsourakos, S., Pariat, E., Vourlidas, A., Antiochos, S. K., & Wuelser, J. P. 2008, ApJ, 680, L73
- Roy (1973a) Roy, J. R. 1973a, Sol. Phys., 32, 139
- Roy (1973b) Roy, J. R. 1973b, Sol. Phys., 28, 95
- Rust (1968) Rust, D. M. 1968, in IAU Symposium, Vol. 35, Structure and Development of Solar Active Regions, ed. K. O. Kiepenheuer, 77
- Savcheva et al. (2007) Savcheva, A., et al. 2007, PASJ, 59, 771
- Schmieder et al. (1988) Schmieder, B., Mein, P., Simnett, G. M., & Tandberg-Hanssen, E. 1988, A&A, 201, 327
- Shibata et al. (1992) Shibata, K., et al. 1992, PASJ, 44, L173
- Shibata et al. (2007) Shibata, K., et al. 2007, Science, 318, 1591
- Shibata & Uchida (1985) Shibata, K. & Uchida, Y. 1985, PASJ, 37, 31
- Shibata & Uchida (1986) —. 1986, Sol. Phys., 103, 299
- Shimojo et al. (1996) Shimojo, M., Hashimoto, S., Shibata, K., Hirayama, T., Hudson, H. S., & Acton, L. W. 1996, PASJ, 48, 123
- Shimojo et al. (2007) Shimojo, M., et al. 2007, PASJ, 59, 745
- Shimojo & Shibata (2000) Shimojo, M. & Shibata, K. 2000, ApJ, 542, 1100
- Strong et al. (1992) Strong, K. T., Harvey, K., Hirayama, T., Nitta, N., Shimizu, T., & Tsuneta, S. 1992, PASJ, 44, L161
- Tarbell et al. (1999) Tarbell, T., Ryutova, M., Covington, J., & Fludra, A. 1999, ApJ, 514, L47
- Tsuneta et al. (2008) Tsuneta, S., et al. 2008, Sol. Phys., 249, 167
- Xu et al. (1984) Xu, A.-A., Yin, S.-Y., & Ding, J.-P. 1984, Acta Astronomica Sinica, 25, 119
- Yokoyama & Shibata (1995) Yokoyama, T. & Shibata, K. 1995, Nature, 375, 42
- Yokoyama & Shibata (1996) —. 1996, PASJ, 48, 353