Probing Lyman-break Galaxies at in GOODS-South with WFC3 on HST
Abstract
We analyse recently acquired near-infrared Hubble Space Telescope imaging of the GOODS-South field to search for star forming galaxies at . By comparing WFC 3 m -band images with ACS -band (m) images, we identify objects with colours consistent with Lyman break galaxies at z6.4-7.4. This new data covers an area five times larger than that previously reported in the WFC3 imaging of the Hubble Ultra Deep Field, and affords a valuable constraint on the bright end of the luminosity function. Using additional imaging of the region in the ACS , and -bands from GOODS v2.0 and the WFC3 -band we attempt to remove any low-redshift interlopers. Our selection criteria yields 6 candidates brighter than , of which all except one are detected in the ACS -band imaging and are thus unlikely to be transients. Assuming all 6 candidates are at this implies a surface density of objects brighter than of 0.300.12 arcmin-2, a value significantly smaller than the prediction from luminosity function. This suggests continued evolution of the bright end of the luminosity function between , with number densities lower at higher redshift.
keywords:
galaxies: evolution –- galaxies: formation –- galaxies: starburst –- galaxies: high-redshift –- ultraviolet: galaxies1 Introduction
In recent years our understanding of the high-redshift galaxy population has rapidly expanded with the discovery of star-forming galaxies within the first billion years (), through the Lyman break technique using broad-band imaging (e.g. Stanway, Bunker & McMahon 2003; Dickinson et al. 2004) and searches for Lyman- emission with narrow-band filters (e.g., Ouchi et al. 2008, Ota et al. 2008), and most recently gamma-ray bursts (e.g. Tanvir et al. 2009, Salvaterra et al. 2009). At , the brightest () Lyman-break “-band drop-out” galaxies have been confirmed spectroscopically (e.g. Bunker et al. 2003; Stanway et al. 2004ab; Dow-Hygelund et al. 2007; Vanzella et al. 2009) through their Lyman- emission, confirming the validity of this photometric redshift selection.
In recent weeks, the installation of the new WFC3 camera on the Hubble Space Telescope (HST), which has an infrared channel with a large field of view, has enabled the Lyman break technique to be pushed to , revealing for the first time significant numbers of galaxy candidates close to the reionization epoch (Bunker et al. 2009; Bouwens et al. 2009; Oesch et al. 2009; McLure et al. 2009; Yan et al. 2009). However, the first data to be released was the extremely deep single pointing on the Hubble Ultra Deep Field (), reaching objects as faint at mag () in -, - and -bands. To probe the rare galaxies at the bright end of the luminosity function at requires a larger field of view. There have been some shallower wider area searches using ground based observations (e.g. Hickey et al. 2009, Ouchi et al. 2009, Castellano et al. 2009), but the depths probed are typically (equivalent to ) and the numbers of robust candidates are small. Increasing the number of candidates over a wide range of magnitudes is critical to exploring the shape of the luminosity function. This is particularly important as there is strong evidence for evolution of luminosity function, with suggestions that at high redshift there is a larger relative contribution to the stellar mass and UV luminosity density from sub- systems. At we are close to the epoch of reionization, and an open question is the mechanism by which reionization is achieved; if we are to address the contribution of the UV from star-forming galaxies, then quantifying the luminosity function is vital (along with the escape fraction of ionizing photons from galaxies, and the hardness of the UV spectral slope).
In this paper we present first results from HST/WFC3 imaging of some of the GOODS-South field, covering an area 5 times that of the WFC3 images of the Hubble Ultra Deep Field, and reaching (), probing luminosities around . In conjunction with the GOODS v2.0 Advanced Camera for Surveys (ACS) images with bands (Giavalisco et al. 2004) we search for objects which are much brighter in the -band WFC3 filter at m than the -band m, and are undetected at shorter wavelength. These “-drops” are candidate Lyman break galaxies, and the greater area of this new dataset (compared with the Hubble Ultra Deep Field WFC3 images) means that we are likely to find brighter objects more amenable to future spectroscopic confirmation.
The structure of this paper is as follows. In Section 2 the imaging data and the construction of catalogues is described. In Section 3 we describe our candidate selection and discuss the observed surface density of galaxies, comparing with the expected number from a range of luminosity functions. Our conclusions are presented in Section 4. Throughout we adopt the standard “concordance” cosmology of , , and use . All magnitudes are on the AB system (Oke & Gunn 1983).
2 HST Observations and Data Reduction
We use the Hubble Space Telescope images of GOODS-South obtained with WFC 3 under the Early Release Science program GO/DD#11359 (P.I. R. O’Connell). This will ultimately cover 10 pointings with the infrared channel within the GOODS-South field, along with UV images of the same area. We focus here on the first 6 WFC 3 pointings to be released (data taken over the period 17-27 September 2009 UT). The observations were split into visits, and each pointing was imaged for 2 orbits in each filter during a single visit.
Each pointing was imaged in 3 filters (F098M “-band”, F125W “-band” and F160W “-band”), and each filter observation comprised two orbits (taken within the same HST visit) which were split into three exposures. The near-IR channel of WFC 3 has a Teledyne HgCdTe detector which can be read non-destructively. Each exposure involved a “MULTIACCUM” sequence of non-destructive reads (the SPARS100 pattern was used, spacing reads by s), enabling cosmic ray rejection through “sampling up the ramp”. The exposures comprised 9 or 10 non-destructive read-outs, totalling 803–903 s. The IRAF.STSDAS pipeline calwfc3 was used to calculate the count rate and reject cosmic rays through gradient fitting, as well as subtracting the zeroth read and flat-fielding. From each individual exposure in each filter, we subtracted the median stack of the 36 exposures in the same filter (6 per pointing and 6 pointings), with bright objects excluded from the median using object masks created by the xdimsum package. This subtracted out hot pixels and eliminated quadrant pedestal offset effects, as well as correcting for scattered light. We used MULTIDRIZZLE (Koekemoer et al. 2002) to combine the 6 exposures per filter in each pointing, taking account of the geometric distortions and mapping on to an output pixel size of from an original . This was the same scale as we used in our analysis of the Hubble Ultra Deep Field WFC 3 images (Bunker et al. 2009) and corresponds to a block-averaging of the GOODSv2.0 ACS drizzled images. The 6 exposures per pointing were dithered by 10 arcsec, so that bad pixels did not overlap and to facilitate subtraction of any residual background (see above). We found that it was necessary to introduce small corrections to the pointing information in the header to accurately align the exposures in MULTIDRIZZLE (and prevent real objects being rejected by the algorithm). There was a slight discrepancy between the position angle information in the headers and the GOODS v2.0 mosaic, which we corrected for by introducing a relative rotation. The total exposure time in each filter per pointing was 5218 s, and the 6 pointings were reduced separately and all registered to the GOODS v2.0 ACS mosaics rebinned by pixels. Each pointing surveyed a region of to maximum depth (i.e., where all 6 exposures overlapped), with the edge regions covered by fewer exposures. In this analysis we only consider the deepest region of uniform depth, covering a total of over the 6 pointings.
The final frames had units of electrons/sec, and we take the standard ACS zeropoints for the UDF images. For WFC3, we use the recent zeropoints reported on http://www.stsci.edu/hst/wfc3/phot_zp_lbn, where the F098M -band has an AB magnitude zeropoint of 25.68 (such that a source of this brightness would have a count rate of 1 electron per second), and the F125W -band zeropoint is 26.25. We note that the information in the image headers is slightly different by 0.1-0.15 mag, with zeropoints of and .
2.1 Construction of Catalogues
Candidate selection for all objects in the field was performed using version 2.5.0 of the SExtractor photometry package (Bertin & Arnouts 1996). For the -drops, as we are searching specifically for objects which are only securely detected in the WFC 3 -band, with minimal flux in the ACS images, fixed circular apertures in diameter were ‘trained’ in the -image and the identified apertures used to measure the flux at the same spatial location in the -band image by running SExtractor in dual-image mode. This was repeated for all other ACS and WFC 3 filters. For object identification, we adopted a limit of at least 5 contiguous pixels above a threshold of per pixel (on the data drizzled to a scale of 006 pixel-1). This cut enabled us to detect all significant sources and a number of spurious detections close to the noise limit, or due to diffraction spikes of stars. As high redshift galaxies in the rest-UV are known to be compact (e.g., Ferguson et al. 2004, Bremer et al. 2004, Bunker et al. 2004), we corrected the aperture magnitudes to approximate total magnitudes with the aperture correction appropriate for that filter; the aperture corrections were 0.23 mag in -band and 0.25 mag in -band, with the ACS bands having aperture corrections of 0.1 mag.
The “multidrizzle” procedure resamples and interpolates pixels, resulting in noise which is highly correlated. Rather than using the standard deviation of counts in the drizzled images to determine the noise level, we instead look at the individual reduced exposures (after flatfielding and background subtraction), and a combination using integer-pixel shifts which preserves the noise characteristics. The noise in an individual -band exposure is , and in a combined pointing it is . We impose a brightness cut of (after applying the aperture correction) corresponding to a detection. Working at this secure signal-to-noise ensures purity of the sample and robustness of the broad-band colours. Our limiting magnitude of is equivalent to a star formation rate of at , using the conversion from UV continuum luminosity of Madau, Pozzetti & Dickinson (1998) and assuming a Salpeter (1955) initial mass function and no correction for dust attenuation.
| ID | RA Declination J2000 | SFRz=7 () | |||||
|---|---|---|---|---|---|---|---|
| 1 | 03:32:15.997 -27:43:01.44 | 27.95 0.44 | 26.32 0.07 | 26.48 0.05 | 1.620.44 | -0.160.09 | 8.6 |
| 2 | 03:32:25.285 -27:43:24.25 | 28.31 0.56 | 26.64 0.09 | 26.53 0.06 | 1.660.57 | 0.110.11 | 6.3 |
| 3 | 03:32:29.693 -27:40:49.88 | 28.09 0.47 | 26.82 0.11 | 27.30 0.12 | 1.260.48 | -0.480.17 | 5.3 |
| 4 | 03:32:29.541 -27:42:04.49 | 28.4 (2) | 26.89 0.12 | 26.82 0.08 | 1.51 (2) | 0.070.14 | 5.0 |
| 5 | 03:32:37.833 -27:43:36.55 | 27.96 0.41 | 26.92 0.12 | 27.22 0.11 | 1.040.43 | -0.300.17 | 4.8 |
| 6 | 03:32:24.094 -27:42:13.85 | 28.10 0.47 | 26.93 0.12 | 26.49 0.05 | 1.170.49 | 0.440.13 | 4.8 |
3 Analysis
3.1 Candidate Selection
Identification of candidates is achieved using the Lyman break technique (e.g. Steidel et al. 1996), where a large colour decrement is observed between filters either side of Lyman- in the rest-frame of the galaxy. The flux decrement comes principally from the large integrated optical depth of the intervening absorbers (the Lyman- forest) .
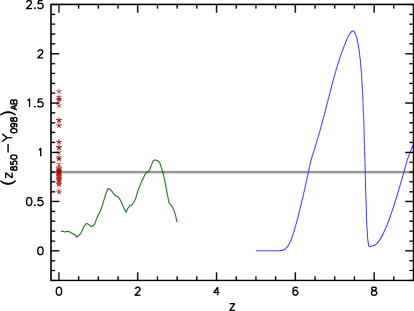
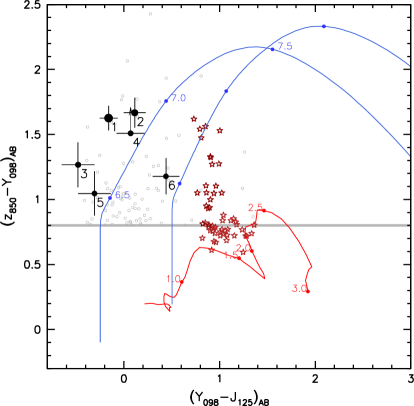
In Figure 2 we illustrate how a colour cut of is effective at selecting sources at . The principal caveat is that for we may include contamination from low-mass galactic T and L dwarf stars and for from evolved systems at where we pick up the Balmer/ break.
These interlopers can be discriminated against using additional colour information, and we use the -band (F125W) images from this HST/WFC 3 program together with existing ACS -band imaging to achieve this.
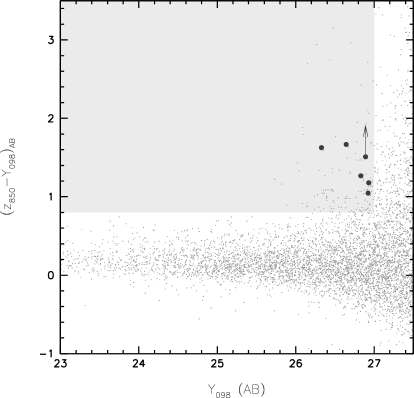
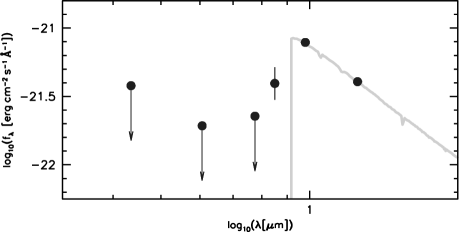
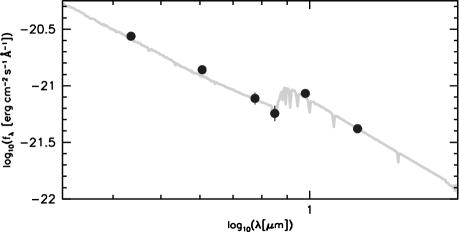
Galactic L and T dwarf stars can be distinguished from high- sources by their position in - colour plane (see Figure 5), as the low-mass stars typically possess redder colours than the high- Lyman break galaxies. Lower redshift objects with strong Balmer breaks can however be more difficult to distinguish. Galaxies with strong Balmer breaks at can mimic the colours of -drop galaxies. These Balmer break galaxies have dominant post-starburst populations, of age Myr. They will potentially be undetected at shorter wavelengths (the ACS filters) if they do not have significant ongoing star formation (i.e. the rest-UV is faint). Such objects will, however, have quite red colours (above the Balmer break), and hence will lie in a different position in - colour space than the Lyman break galaxies at (see Figure 5). Figure 6b shows the photometry of an object in our sample which is well fit by a Balmer break spectrum at produced by an instantanous burst of age 3000 Myr.
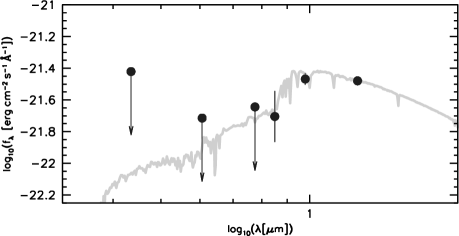
However, Balmer break galaxies can have bluer colours if they have a more complicated star formation history, with a more recent or ongoing episode of star formation involving a small fraction of the stellar mass. At , these galaxies can lie in approximately the same position as galaxies in the - colour plane. Such objects will, however, also have a steep blue spectral slope shortward of break, and will protentially be detectable at shorter wavelengths (with a colour of at ). At our catalogue limit of , these “blue Balmer break” galaxies will have -band detections in the ACS images of GOODS-South. Both a synthetic and observed example of such an object is shown in Figure 6c.
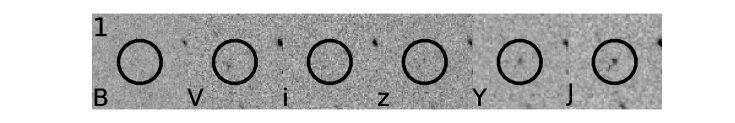
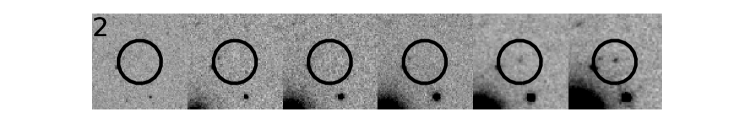
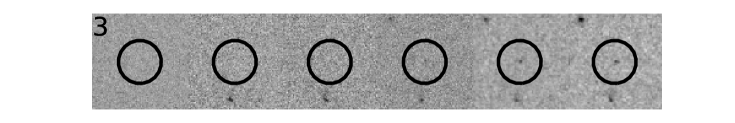
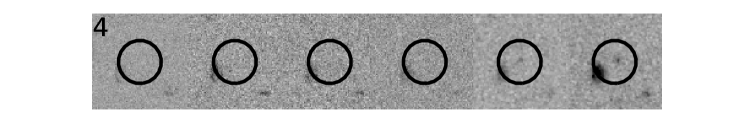
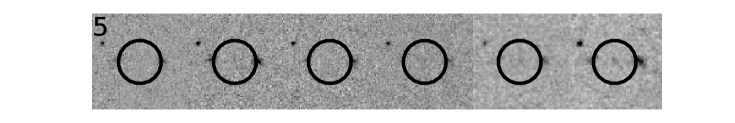
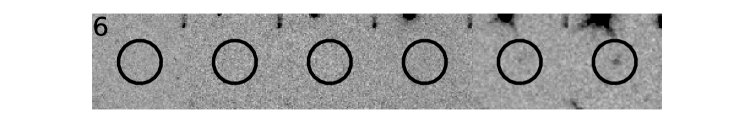
Our initial selection of objects brighter than and redder than yielded 148 objects. Of these 37% (55) are clearly spurious (e.g. diffraction spikes). Of the remaining 93 candidates all but 6 (6.5%) have detections in the bluer , or ACS bands at (i.e. , , ). Of the 93 non-spurious objects, a further 8 (9%) are detected in the ACS -band but are undected at in the & -bands. These objects are possibly -drop galaxies rather than (indeed we recover galaxies CDFS-2290242079 and CDFS-2226643007 from the ACS GOODS -drop catalog of Bouwens et al. 2006). Adopting a conservative approach, we do not include these -band-detected sources in our final sample. Photometry of our 6 remaining -drop candidates are presented in Table 1, and the ACS and WFC 3 images are shown in Figure 4.
We also consider the available deep MIPS imaging of the field which covers all of our survey area. This MIPS band is sensitive to thermal re-emission from dust in moderate redshift sources (powered either by highly-obscured star formation or AGN activity), but we would not expect strong emission from sources (rest-frame m). None of our 6 candidates are clearly detected (with Jy at ), however objects 2,3, and 6 are confused by nearby sources. These objects nevertheless appear undetected, further supporting the assertion that our candidates are of high redshift origin.
There is a 5-year interval between the ACS images and the WFC3 observations, which means that another possible source of contamination are transient objects (e.g. supernovæ), which might have brightened since the ACS data were taken. Indeed, the recent WFC 3 images of the Hubble Ultra Deep Field reveal a probable supernova when compared with the deep ACS imaging in 2004 (Bunker et al. 2009; Oesch et al. 2009; Yan et al. 2009). The WFC 3 -band filter (F098M) used in the wide-field GOODS-South imaging presented here has greater overlap in wavelength with the -band compared to the WFC 3 F105W filter used for the Hubble Ultra Deep Field, which means that there is likely to be flux in the -band for most candidates. Indeed, in all but one case however each of the candidates are also detected (faintly) in the ACS band images, implying they are not extreme transient objects such as supernovæ. The one object (candidate 4) which is undetected in the band images has a 2 lower-limit of . This, combined with its colour, suggests that it is still consistent with being a high- star forming galaxy (Figure 5). Thus, we include this object in our final candidate list.
3.2 Number Density of Galaxies
Observations of Lyman-break galaxies at have indicated significant evolution of the luminosity function over cosmic time, in particular the discovery that the number density of luminous star forming systems at (the -drops) is much less than in the well-studied -drop and -drop population at (e.g., Lehnert & Bremer 2003; Stanway, Bunker & McMahon 2003; Bunker et al. 2004; Bouwens et al. 2004; Bouwens et al. 2006).
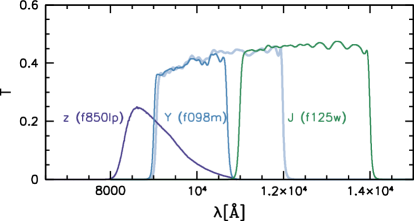
Recent results from the -drops indicate that this trend continues to (Bunker et al. 2009; Bouwens et al. 2009; Oesch et al. 2009; McLure et al. 2009; Hickey et al. 2009; Ouchi et al. 2009). The new WFC3 data over several pointings allows us to constrain the luminosity function around , a key region around with too small numbers in the single Hubble Ultra Deep Field pointing (only one object along with a probable supernova contaminant) but too faint to be explored in the ground-based -band surveys. We also note that the F098M filter used in the data presented here does not go as red as the F105W WFC 3 filter used to survey the Hubble Ultra Deep Field (see Figure 1), so we are biased towards slightly lower redshifts than .
We have 6 candidates brighter than which are undetected in the ACS bands and with . We survey 20 arcmin2 over the 6 pointings (where we consider only the deepest region where all 6 individual exposures per pointing overlap). Our surface densities are presented in Table 2 and Figure 7, where the error comes from the Poisson statistics.
We now compare our observed surface density of -drop candidates with that expected from a range of luminosity functions derived for Lyman break galaxies at lower redshifts. We use the filter response curves to assess which redshifts will satisfy our colour cut, assuming a simple model spectrum for these high-redshift star-forming galaxy obeying a power law above Lyman- with a 99 flux decrement below due to the Lyman- forest during the Gunn-Peterson era (and no flux below the 912 Å Lyman limit). For the UV spectral slope we adopt a value of consistent with the values reported for high-redshift galaxies (Stanway, McMahon & Bunker 2005), although we stress the number of objects is not particularly sensitive to small variations in .
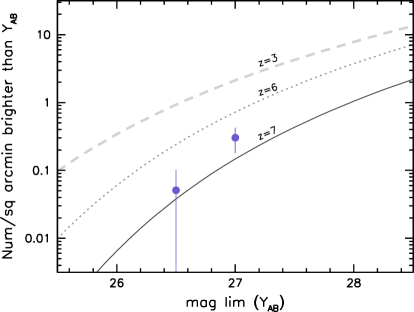
To compare our observations with predictions we consider three UV luminosity functions, and note that for our assumed (flat in ) there is no -correction necessary to the AB magnitudes between the various determinations of the UV continuum at 1300–1700 Å. To assess evolution to we use the recent Reddy et al. (2009) determination of the Schechter luminosity function, which has a steep faint end slope of , and characteristic luminosity of and number density of . For our comparison to galaxies at , we adopt the Bouwens et al. (2006) determination which has a similar faint end slope and . Finally, we consider the proposed luminosity function of Bouwens et al. (2008) with , and a similar . Our observations and predictions of the number densities of galaxies are summarised in table 2 for a range of colour cuts . Our observations suggest dramatic evolution between and , with the observed number of -drops 4 below the no-evolution prediction. Our number density at is consistent with that obtained from our recent analysis (Bunker et al. 2009) of the UDF (). However it is roughly twice that suggested by the luminosity function of Bouwens et al. (2008), although we emphasize that our statistical error is per cent and we estimate that the cosmic variance over our new data set will contribute a uncertainty (Trenti & Stiavelli 2008). This is a significant improvement upon the arcmin2 HUDF which contained only a single galaxy brighter than (e.g. Bunker et al. 2009), precluding a reliable measure of the normalisation of the luminosity function owing to the large Poisson error () and cosmic variance () for sources in this magnitude range.
The numbers of -drops discovered in this paper in the GOODS-South ERS-WFC3 observations are consistent with the deeper but smaller area HUDF (Bunker et al. 2009 and Figure 7), accounting for differences in the shape of the -band filter bandpass. We consider the implications for reionization in Bunker et al. (2009): for our observed surface densities of -drops, the integrated star formation rate density (integrated down to , equivalent to at ) is insufficient to achieve reionization unless the faint end slope is very steep () and the escape fraction implausibly high ). However, the number of ionizing photons is determined by the UV spectral slope (which is sensitive to the initial mass function, dust extinction, metallicity and star formation history). There are strong indications that the spectral slopes of our Lyman-break galaxies are bluer than at lower redshift, and this evolution might make up the short-fall in ionizing photons.
The 6 -drop galaxies presented here have star formation rates of , assuming they are are at . For a rest-frame equivalent width of 10 Å for Lyman- (typical of Lyman break galaxies at modest redshift, , Steidel et al. 1999) this would correspond to a line flux of , and for larger equivalent widths of 30 Å, which may be more typical of the population (Stanway et al. 2004; Vanzella et al. 2009) these galaxies may exhibit Lyman- line emission fluxes . These fluxes are within the capability of red-sensitive optical spectrographs on 8–10 m telescopes with long integrations. Given the large fraction of dropouts in the same luminosity range that show such strong Ly- emission (Stark et al. 2010), this sample should enable us to test whether the prevalence of Ly- emitters declines over , as expected given observations of narrowband selected Ly- emitters (e.g. Ota et al. 2008).
| Colour cut | Limiting magnitude | Observed | pred.a | pred.b | pred.c |
|---|---|---|---|---|---|
| 0.8 | 26.5 | 0.0510.051 | 0.926 | 0.241 | 0.038 |
| 0.8 | 27.0 | 0.3030.123 | 2.114 | 0.722 | 0.147 |
| 1.0 | 26.5 | 0.0510.051 | 0.712 | 0.173 | 0.026 |
| 1.0 | 27.0 | 0.3030.123 | 1.678 | 0.546 | 0.106 |
| 1.3 | 26.5 | 0.0510.051 | 0.388 | 0.079 | 0.010 |
| 1.3 | 27.0 | 0.1520.087 | 0.987 | 0.284 | 0.049 |
4 Conclusions
In this work we have searched for star-forming galaxies at utilising the Lyman-break technique on newly acquired F098M -band images from WFC3 on the Hubble Space Telescope. Through the comparison of these images to existing Hubble ACS F850LP -band images we identified objects with red colours, , indicative of a break in the spectrum. We explore an area five times larger than the recent WFC 3 imaging of the Hubble Ultra Deep Field. The new wider-field data in GOODS-South probes down to , equivalent to at .
Using additional imaging (ACS , , -bands from GOODS v2.0, and WFC3 F125W -band) we removed contaminating objects which were either detected in the bluer ACS bands or with observed near-infrared colours inconsistent with high-redshift star forming galaxies.
This selection criteria left 6 candidates down to a limiting magnitude (equivalent to a star formation rate of at ) of which all but one were detected in the -band (and are thus likely not to be transients). This implies a surface density of objects brighter than of 0.300.12; a value smaller than both the prediction based on the observed and luminosity functions, suggesting continued evolution of the LF beyond .
Knowledge of the surface density of dropouts in this magnitude range is crucial in constraining the luminosity function, as current estimates of the luminosity function indicate that an galaxy has a magnitude of (e.g. Bouwens et al. 2008). Determining the UV luminosity function is crucial in order to address whether star-forming galaxies could plausibly have provided the Lyman continuum photons necessary to reionize the Universe.
Given the difficulty that ground-based surveys face in probing faintward of , larger-area surveys with HST/WFC3 ( arcmin2) probing to similar depths () as the dataset presented in this paper will deliver a factor of 2 improvement in the poisson uncertainty and a significant decrease in the uncertainty due to cosmic variance.
Acknowledgements
We would like to thank the annoyamous referee for their timely response and useful suggestions. Additionally we thank Mark Lacy for comments given during the construction of the manuscript, and Richard McMahon, Jim Dunlop, Ross McLure, Masami Ouchi, Bahram Mobasher and Michele Cirasuolo for many useful discussions about Lyman break galaxies at high redshift. Based on observations made with the NASA/ESA Hubble Space Telescope, obtained from the Data Archive at the Space Telescope Science Institute, which is operated by the Association of Universities for Research in Astronomy, Inc., under NASA contract NAS 5-26555. These observations are associated with programme #GO/DD-11359. We are grateful to the WFC 3 Science Oversight Committee for making their Early Release Science observations public. SW, DS & ES acknowledges funding from the U.K. Science and Technology Facilities Council. MJJ acknowledges the support of a RCUK fellowship. SL is supported by the Marie Curie Initial Training Network ELIXIR of the European Commission under contract PITN-GA-2008-214227.
References
- [Bertin & Arnouts 1996] Bertin E., Arnouts S., 1996, A& AS, 117, 393
- [Bouwens et al.(2004)] Bouwens, R. J., et al. 2004, ApJ, 616, L79
- [Bouwens et al. 2006] Bouwens R. J. Illingworth G. D. Blakeslee J. P.; Franx M., 2006, ApJ, 653, 53
- [Bouwens et al. 2008] Bouwens R. J., Illingworth G. D., Franx M., Ford H., 2008, ApJ, 686, 230
- [Bouwens et al. 2009] Bouwens R. J. et al., 2009, submitted to ApJ letters, arXiv:0909.1803
- [Bremer et al. 2004] Bremer M. N., Lehnert M. D., Waddington I., Hardcastle M. J., Boyce P. J., Phillipps S., 2004, MNRAS, 347, L7
- [Bunker et al.(2003)] Bunker, A. J., Stanway, E. R., Ellis, R. S., McMahon, R. G., & McCarthy, P. J. 2003, MNRAS, 342, L47
- [Bunker et al. 2004] Bunker A. J., Stanway E. R., Ellis R. S., McMahon R. G., 2004, MNRAS, 355, 374
- [Bunker et al.(2009)] Bunker, A., et al. 2009, arXiv:0909.2255
- [Castellano et al.(2009)] Castellano, M., et al. 2009, arXiv:0909.2853
- [Chiu et al. 2006] Chiu K., Fan X., Leggett S. K., Golimowski D. A., Zheng W., Geballe T. R., Schneider D. P., Brinkmann J., 2006, AJ, 131, 2722
- [Dickinson et al.(2004)] Dickinson, M., et al. 2004, ApJ, 600, L99
- [Dow-Hygelund et al.(2007)] Dow-Hygelund, C. C., et al. 2007, ApJ, 660, 47
- [Ferguson et al. 2004] Ferguson H, C. et al., 2004, ApJ, 600, 107
- [Giavalisco et al.(2004)] Giavalisco, M., et al. 2004, ApJ, 600, L103
- [Golimowski et al. 2004] Golimowski D. A. et al., 2004, AJ, 128, 1733
- [Hickey et al. 2009] Hickey, S., Bunker, A. J., Jarvis, M., Chiu, K., Bonfield, D., 2009, MNRAS, in press, arXiv:0909.4205
- [Koekemoer et al. 2002] Koekemoer A. M., Fruchter A. S.; Hook R. N., Hack W., 2002, hstc.conf, 337
- [Knapp et al. 2004] Knapp G. R. et al., 2004, AJ, 127, 3553
- [Lehnert & Bremer(2003)] Lehnert, M. D., & Bremer, M. 2003, ApJ, 593, 630
- [Madau, Pozzetti & Dickinson 1998] Madau P., Pozzetti L., Dickinson M., 1998, ApJ, 498, 106
- [McLure et al.(2009)] McLure, R. J., Dunlop, J. S., Cirasuolo, M., Koekemoer, A. M., Sabbi, E., Stark, D. P., Targett, T. A., & Ellis, R. S. 2009, arXiv:0909.2437
- [Oke & Gunn 1983] Oke J. B., Gunn J. E., 1983, ApJ, 266, 713
- [Oesch et al.(2009)] Oesch, P. A., et al. 2009, arXiv:0909.1806
- [Ouchi et al.(2008)] Ouchi, M., et al. 2008, ApJS, 176, 301
- [Ouchi et al. 2009] Ouchi M. et al., 2009, arXiv, 0908, 3191
- [Ota et al.(2008)] Ota, K., et al. 2008, ApJ, 677, 12
- [Reddy & Steidel(2009)] Reddy, N. A., & Steidel, C. C. 2009, ApJ, 692, 778
- [Salpeter 1955] Salpeter E. E., 1955, ApJ, 121, 161
- [Salvaterra et al.(2009)] Salvaterra, R., et al. 2009, arXiv:0906.1578
- [Stanway, Bunker & McMahon 2003] Stanway E. R., Bunker A. J., McMahon R. G., 2003, MNRAS, 342, 439
- [Stanway et al.(2004)] Stanway, E. R., et al. 2004, ApJ, 604, L13
- [Stanway et al.(2004)] Stanway, E. R., Bunker, A. J., McMahon, R. G., Ellis, R. S., Treu, T., & McCarthy, P. J. 2004, ApJ, 607, 704
- [Stanway, McMahon & Bunker 2005] Stanway E. R., McMahon R. G., Bunker A. J., 2005, MNRAS, 359, 1184
- [Stark et al. (2010)] Stark, D. P., et al., in prep
- [Steidel et al. 1996] Steidel C. C., Giavalisco M., Pettini M., Dickinson M., Adelberger K. L., 1996, ApJ, 462, 17
- [Tanvir et al.(2009)] Tanvir, N. R., et al. 2009, arXiv:0906.1577
- [Trenti & Stiavelli(2008)] Trenti, M., & Stiavelli, M. 2008, ApJ, 676, 767
- [Vanzella et al.(2009)] Vanzella, E., et al. 2009, ApJ, 695, 1163
- [Yan et al.(2009)] Yan, H., Windhorst, R., Hathi, N., Cohen, S., Ryan, R., O’Connell, R., & McCarthy, P. 2009, arXiv:0910.0077