The BLAST Survey of the Vela Molecular Cloud:
Physical Properties of the Dense Cores in Vela-D
Abstract
The Balloon-borne Large-Aperture Submillimeter Telescope (BLAST) carried out a 250, 350 and 500 µm survey of the galactic plane encompassing the Vela Molecular Ridge, with the primary goal of identifying the coldest dense cores possibly associated with the earliest stages of star formation. Here we present the results from observations of the Vela-D region, covering about , in which we find 141 BLAST cores. We exploit existing data taken with the Spitzer MIPS, IRAC and SEST-SIMBA instruments to constrain their (single-temperature) spectral energy distributions, assuming a dust emissivity index . This combination of data allows us to determine the temperature, luminosity and mass of each BLAST core, and also enables us to separate starless from proto-stellar sources. We also analyze the effects that the uncertainties on the derived physical parameters of the individual sources have on the overall physical properties of starless and proto-stellar cores, and we find that there appear to be a smooth transition from the pre- to the proto-stellar phase. In particular, for proto-stellar cores we find a correlation between the MIPS24 flux, associated with the central protostar, and the temperature of the dust envelope. We also find that the core mass function of the Vela-D cores has a slope consistent with other similar (sub)millimeter surveys.
Subject headings:
submillimeter — stars: formation — ISM: clouds — balloons1. INTRODUCTION
Stars form in dense, dusty cores of molecular clouds, but little is known about their origin, their evolution, and their detailed physical properties. In particular, the relationship between the core mass function (CMF) and the stellar initial mass function (IMF) is poorly understood (McKee & Ostriker, 2007). One of the reasons for this lack of understanding, from the observational point of view, is the difficulty in selecting a statistically significant sample of truly pre-stellar cores from an otherwise unremarkable collection of high column density features.
Pre-stellar cores represent a very early stage of the star formation (SF) process, before collapse results in the formation of a central protostar. The physical properties of these cores can reveal important clues about their nature; mass, spatial distributions, and lifetime are important diagnostics of the main physical processes leading to the formation of the cores from the parent molecular cloud. In addition, a comparison of the CMF to the IMF may help to understand what processes are responsible for further fragmentation of the cores, and thus the determination of stellar masses. Therefore, large samples of bona-fide pre-stellar cores are important for comparison of observations with various SF models and scenarios.
Two major technological advances have revolutionized the study of the mass distribution in molecular clouds and the characterization of the earliest phases of SF: the Infrared Astronomical Satellite (IRAS ) satellite, and the advent of submillimeter bolometer arrays such as MAMBO, SIMBA, and SCUBA. (Sub)millimeter surveys have been vitally important for probing the nature of SF, and in particular have represented the only way of deriving statistically-significant samples of pre- and proto-stellar objects. However, these instruments have probed the Rayleigh-Jeans tail of the spectral energy distribution (SED) of these cold objects, far from its peak. Therefore, these surveys have been limited by their relative inability to measure the temperature (e.g., Motte et al., 1998), producing large uncertainties in the derived luminosities and masses. Recent surveys with the MIPS instrument of the Spitzer Space Telescope are able to constrain the temperatures of warmer objects (Carey et al., 2005), but the youngest and coldest objects are potentially not detected, even in the long-wavelength Spitzer bands. Other ground-based surveys conducted at wavelengths µm have been affected by low sensitivity due to atmospheric conditions at short submillimeter wavelengths (e.g., Kirk et al., 2005; Wu et al., 2007).
The Balloon-borne Large-Aperture Submillimeter Telescope, BLAST (Pascale et al., 2008), carried out two long duration balloon science flights. During the first (BLAST05), BLAST mapped several galactic star forming regions (Chapin et al., 2008; Truch et al., 2008). During the second science flight in 2006, BLAST06 mapped about 50 deg2 in the Vela Molecular Ridge (VMR) (Netterfield et al., 2009). Until the more extensive results from Herschel become available, BLAST is unique in its ability to detect and characterize cold dust emission from both starless and proto-stellar sources, constraining the temperatures of objects with K using its three-band photometry (250, 350, and 500 µm) near the peak of the cold core SED.
The VMR is a giant molecular cloud complex within the galactic plane, in the area and , hence located outside the solar circle. It was first studied in detail by Murphy & May (1991), using millimeter low-resolution observations in the CO(1–0) transition. They subdivided the VMR into four main regions, named A, B, C, and D. Liseau et al. (1992) further discussed the issue of distance, finding that clouds A, C, and D are at pc, whereas B seems to be at pc. In this work we have selected the Vela-D region because of the large amount of ancillary data available, both in the continuum, particularly in the mid- (MIR) and far-infrared (FIR), and also in terms of spectral line observations.
Liseau et al. (1992) and Lorenzetti et al. (1993) identified a number of VMR sites that host low- and intermediate-mass (proto)stars whose infrared SEDs are consistent with those of Class I sources. Later, Massi et al. (1999, 2000, 2003) analyzed NIR images of a sample of those sites, finding that the IRAS sources with L☉ are associated with small embedded young stellar clusters. Their IMF appears consistent with that of field stars and their age is of the order of yrs (Massi et al., 2006). Remarkably, cloud D exhibits a lack of massive (O-type) stars with respect to what is expected from a standard IMF (Massi et al., 2006).
New millimeter observations, both spectral line (Elia et al., 2007) and continuum (Massi et al., 2007), have shown that all the IRAS sources associated with embedded young clusters are also associated with one or more dense molecular cores, confirming the inferred young age of the clusters. On-going SF activity in Vela-D is also confirmed by the presence of collimated jets originating from objects embedded in some of the clusters (Lorenzetti et al., 2002; De Luca et al., 2007). A first census of young stellar objects (YSOs) throughout the area of cloud D mapped by Massi et al. (2007) and Elia et al. (2007), was carried out by Giannini et al. (2007) using Spitzer MIPS observations at 24 and µm (hereafter indicated as MIPS24 and MIPS70, respectively). Most of the millimeter cores identified by Massi et al. (2007) were found to be associated with red, cold objects. Cloud D appears therefore as an active star-forming region with both distributed and clustered SF in progress, hosting a large sample of young objects in different evolutionary stages.
In this paper we use both BLAST and archival data to determine the SEDs, and thus physical parameters, of each source detected by BLAST. In §2 we describe the BLAST observations and also the archival data that have been used in this work. In §3 we describe the identification of millimeter, MIR and FIR counterparts of the BLAST cores, and also describe the multi-band photometry. This photometry is then used to construct the SED of each source in §4, which allow us to derive the physical parameters for starless and proto-stellar cores, discussed in §5. We finally draw our conclusions in §6.
2. OBSERVATIONS
2.1. BLAST observations
BLAST06 is a 1.8 m Cassegrain telescope, whose under-illuminated primary mirror has produced in-flight beams with FWHM of 36 ″, 42 ″, and 60 ″ at 250, 350, and 500 µm, respectively. The camera consists of three silicon-nitride “spider web” bolometer arrays (Turner et al., 2001) almost identical to those for SPIRE on Herschel (Griffin et al., 2008), with 149, 88, and 43 detectors at 250, 350, and 500 µm, respectively, organized in a hexagonal close-packed pattern. The raw BLAST data are reduced using a common pipeline. More details can be found in the BLAST05 papers Pascale et al. (2008), Patanchon et al. (2008), and Truch et al. (2008). The absolute gain of the instrument (including antenna efficiency), determined from regular observations of the evolved star VY CMa, is measured with highly correlated absolute uncertainties of 10%, 12%, and 13% at 250, 350, and 500 µm, respectively (Truch et al., 2009). Finally, maximum likelihood maps and noise estimates are made (Patanchon et al., 2008, Wiebe, 2008).
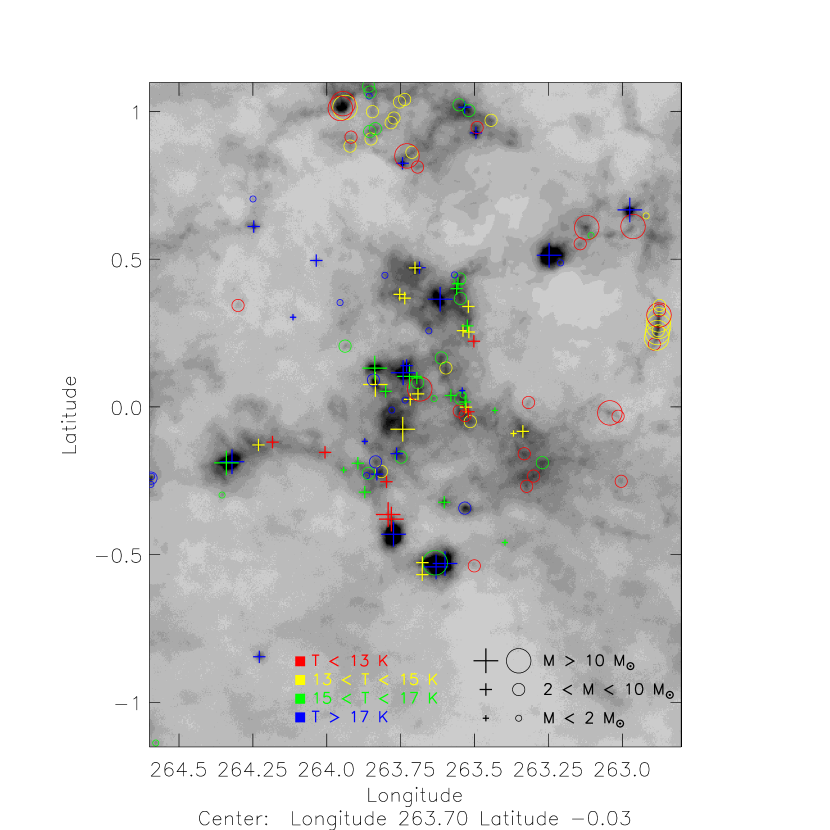
The deepest map of the Galactic Plane obtained by BLAST06 spans deg in Galactic longitude and deg in Galactic latitude in the constellation Vela (including the VMR) which we will call the “Vela deep” map hereafter. The Vela deep map is part of a much larger ( deg2) but shallower map, called the “Vela wide” map111http://www.blastexperiment.info/, which is still unpublished. As noted in the introduction, we will concentrate here on the Vela-D region, which for practical reasons we define as the area of the Vela deep map contained within and . In this area we find a total of 141 sources from the BLAST catalog of Vela deep, shown in Figure 1 and described later in §3 and §5. The high signal-to-noise ratio of the BLAST maps allows us to infer intrinsic source sizes even below the beam FWHM scale by deconvolving the BLAST beam from the measured source FWHM (using a Gaussian source surface brightness profile: see §3.1 and Netterfield et al., 2009). We find that the sizes from the fit are broader than the intrinsic beam size, with a typical diameter of 62 ″ (measured at 250 µm), which corresponds to an intrinsic deconvolved source size of pc at the distance of the VMR.
2.2. Archival data
2.2.1 SEST data
Figure 2 shows the deg2 area of Cloud D mapped with SIMBA at the SEST (ESO, La Silla, Chile) in the 1.2-mm continuum (Massi et al., 2007). At this wavelength, the SIMBA beam is , i.e. pc at 700 pc. The r.m.s. in the map is in the range mJy beam-1, but it is mJy beam-1 over most of the map (Massi et al., 2007). By using the algorithm CLUMPFIND (Williams et al., 1994), the emission was subdivided by Massi et al. (2007) into 29 dense molecular cores, with deconvolved sizes in the range – pc and masses in the range –88 . Massi et al. (2007) discarded a total of 26 additional cores because they were smaller than the SEST beam. However, De Luca et al. (2007) showed that most of these objects are probably real millimeter sources associated with SF and not just instrumental artifacts. The two sets of objects and the assumptions made to derive their physical properties are discussed in Massi et al. (2007). Their Table 1 lists the robust sample of 29 sources (named “MMS” by the authors), while their Table 2 lists the sample of possible cores (named “umms”). Our own analysis of the SIMBA data and association with BLAST sources are discussed in §3.2.
2.2.2 IRAC, MIPS and Akari
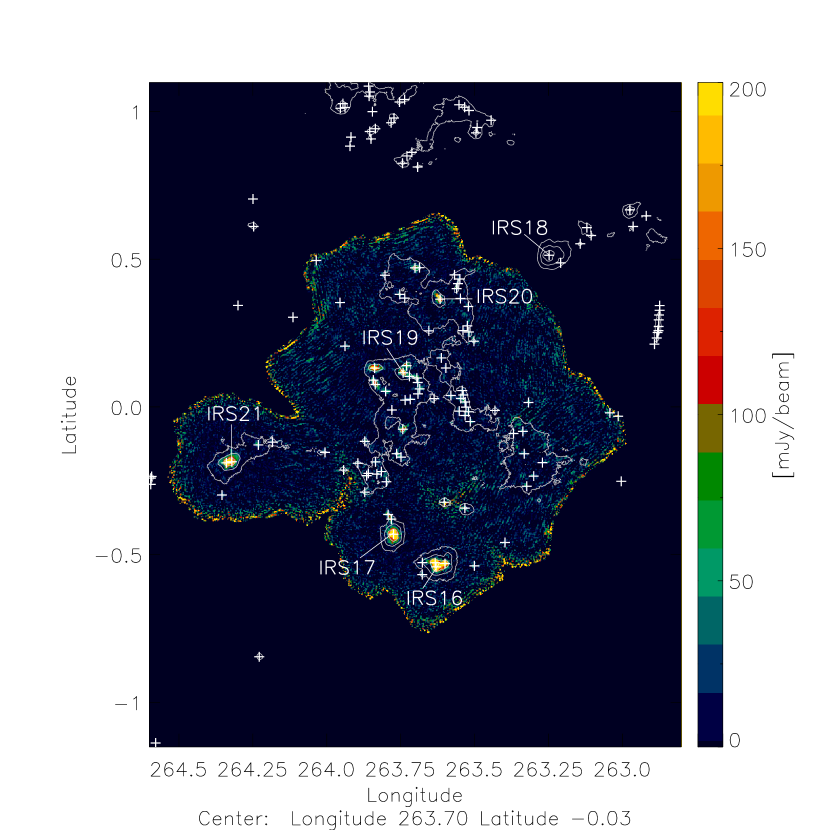
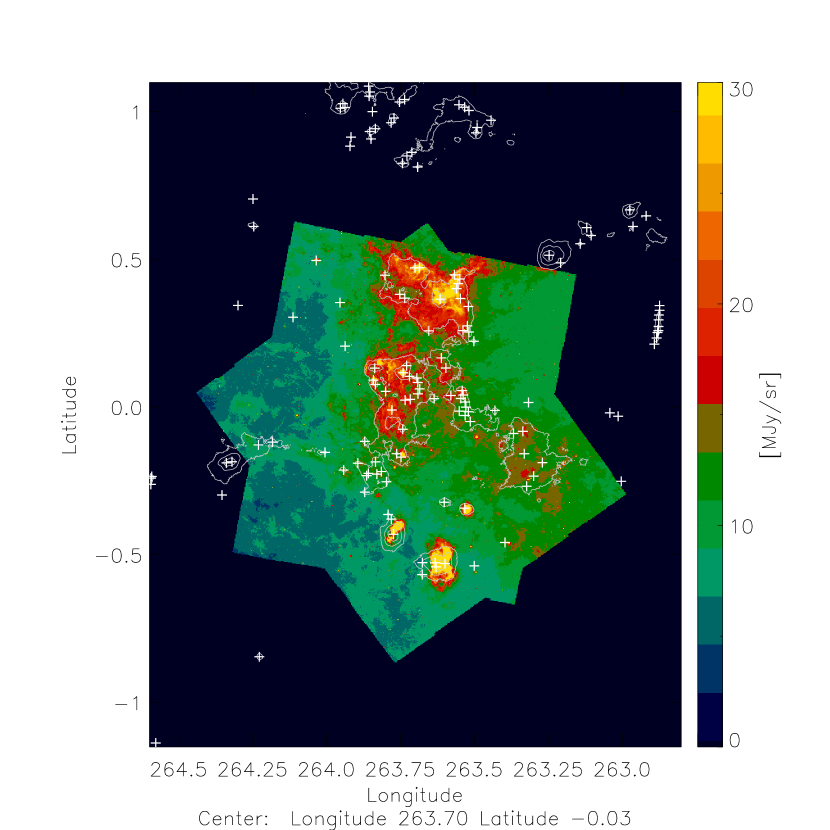
Concerning the Spitzer MIPS data (Rieke et al., 2004), in this paper we make use of maps (covering deg2, see Figure 3) at 24 and 70 µm of Vela-D which have already been published (Giannini et al., 2007), and the reader is referred to that paper where the image mosaicking, artifact removal and details relative to source finding and flux extraction (see also §3.3.2) are discussed.
To characterize the BLAST sources at the shortest possible wavelengths we also use Spitzer IRAC (Fazio et al., 2004) observations, in particular those in the 8 µm band, covering part of Vela-D (see Figures 3 and 4). The sensitivity achieved at 8 µm was about 50Jy. Moreover, because Spitzer is diffraction limited longward of 10 µm, the spatial resolution in the MIPS bands is at 24 µm, and at 70 µm. We note that the present paper is based on a sub-sample of a much larger catalog incorporating both IRAC and MIPS data (Strafella et al., 2009).
The Akari/FIS survey at 60, 90, 140 and 160 µm (Yamamura et al., 2008) is useful because of its much higher sensitivity compared to IRAS, and also because of the two longer wavelength bands, making it more sensitive to cold dust emission. An early Akari catalog has been used to find FIR counterparts to the BLAST sources, but without the actual maps we have not been able to directly compare the brightness distribution with that observed at both longer and shorter wavelengths.
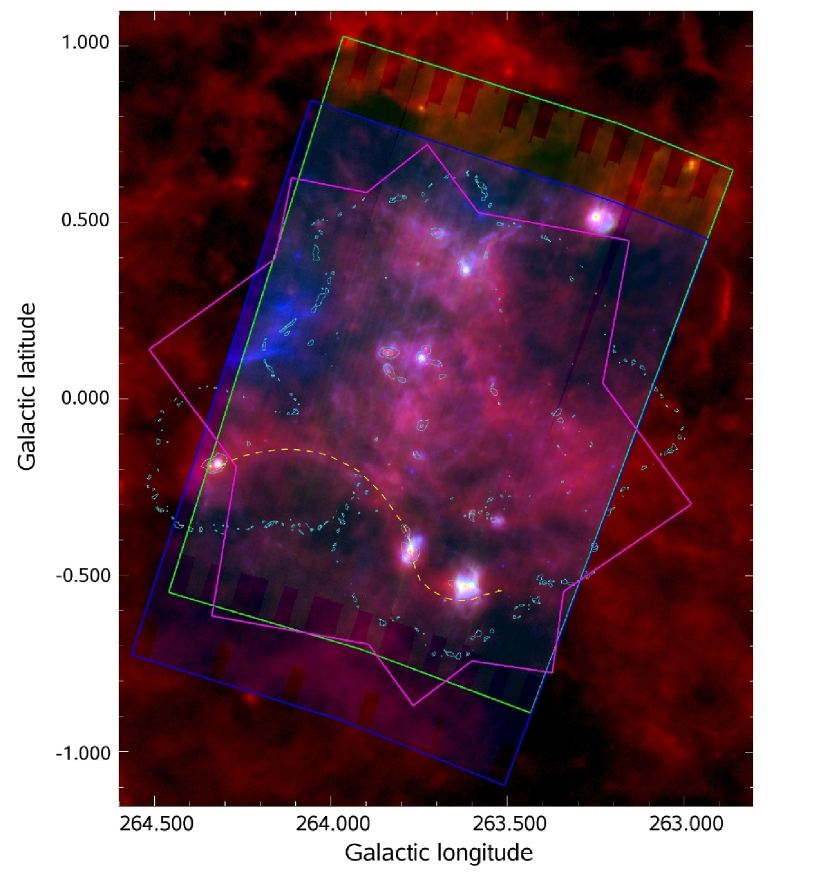
2.3. Morphology
Figure 3 shows a false color image of the Vela-D map, and the 1.2-mm SIMBA map of the Vela-D region (Massi et al., 2007) is shown in Figure 2. The brightest regions in Figure 2 are clearly associated with known SF regions, including IRS16, IRS17, IRS18, IRS19, IRS20 and IRS21 (following the designation adopted by Liseau et al., 1992). IRS16 is located at the center of the H II region 263.619-0.533 (Caswell & Haynes, 1987), and the most populated areas of the map with BLAST cores are clearly the regions around sources IRS19 and IRS20, which show a complex structure composed of filaments, diffuse emission and clusters of dense cores.
The nature of the IRS sources has been analyzed in detail by Massi et al. (2003), who concluded that most of these objects are probably precursors of intermediate mass stars () which may still be in an accretion stage (i.e., Class I sources), thus explaining their red colors. By comparing Figures 1 to 3 one can also see that IRS16, IRS17 and IRS21 are all part of a long, “S”-shaped filament containing several BLAST and SIMBA cores, including the most massive SIMBA core, MMS4. The presence and nature of this, as well as other arc-like features in the Vela-D region, has been analyzed by Elia et al. (2007).
Figure 4 shows an overlay of the IRAC 8 µm (hereafter IRAC8) image with the BLAST 250 µm contours. Although both trace neutral material, the 8 µm emission is known to be heavily influenced by PAH emission, and requires UV illumination, instead of being a simple tracer of column density. The IRAC8 map can also be used to check for extinction effects. In Figure 4 the BLAST contours follow the general distribution of the 8 µm emission. However, there are a number of BLAST compact sources, along with the neutral material associated with them, that correspond in position with local minima or darker regions in the diffuse 8 µm emission. This effect has also been observed in Vulpecula by Chapin et al. (2008). However, analysing whether this is the result of chance coincidence or rather it is indeed the BLAST cores that are producing the so-called infrared dark clouds (IRDCs; e.g., Egan et al., 1998; Simon et al., 2006) was beyond the scope of this work.
Finally, we note that the BLAST cores are unlikely to be extragalactic bright sources. Using the number counts in Patanchon et al. (2009) the expected number of extragalactic sources at 250 µm with flux density greater than 0.3 Jy is deg-2, while at the level of a few Jy (the observed minimum source flux density at 250 µm), this number is deg-2.
3. SOURCE PHOTOMETRY AND ASSOCIATIONS WITH COMPACT SOURCES
3.1. Source and Flux extraction in the BLAST maps
The source extraction and brightness estimation techniques applied to the BLAST maps here are similar to the method used during analysis of the BLAST05 data (Chapin et al., 2008). Candidate sources are identified by finding peaks after a Mexican Hat Wavelet type convolution (see, e.g., Barnard et al., 2004). The candidate lists from 250 and 350 µm are then merged and fluxes at all three bands extracted by fitting a compact Gaussian profile to the source. Sources are not identified at 500 µm due to the greater source-source and source-background confusion resulting from the lower resolution. However, a Gaussian is refitted also in the 500 µm map using the size and location parameters determined at the shorter wavelengths (the size of the Gaussian is convolved to account for the differing beam sizes). Using this technique, more than one thousand compact cores were identified in the Vela deep map (Netterfield et al., 2009).
The catalog of BLAST source positions in Vela-D, including flux densities, is given in Table The BLAST Survey of the Vela Molecular Cloud: Physical Properties of the Dense Cores in Vela-D. This list is taken as the reference catalog for all subsequent associations with compact sources detected at all other wavebands described below. The cross-correlation between BLAST sources and objects listed in other catalogs is performed using positional criteria. An archive object is considered to be associated with a BLAST source when their separation is less than the following search radius:
| (1) |
where is the pointing error associated with the position of the archive source, and we have defined
| (2) |
where is the deconvolved FWHM of the BLAST source. Both , the BLAST pointing error, and , the uncertainty in the source position due to the source finding technique, have been estimated to be ″.
3.2. The millimeter continuum: SIMBA data
Due to the smaller area and lower signal-to-noise ratio of the SIMBA map (§2.2.1), when performing a cross-correlation between the BLAST and SIMBA sources we find a SIMBA counterpart to only 31 BLAST sources, out of 141 in our selected area of Vela-D. We determine the positional offset from each candidate SIMBA counterpart to the nearest BLAST source position and find that the average positional offsets between the BLAST and SIMBA positions are ″ and ″ in galactic longitude and latitude, respectively, whereas the standard deviations in these two axes are 7.2 ″ and 6.0 ″. The offsets are also randomly distributed, with no particular recognizable pattern, and we attribute them to instrumental pointing and to the different algorithm used for source finding in the BLAST and SIMBA maps.
The cross-correlation between the BLAST and SIMBA catalogs follows the procedure outlined in §3.1, assuming ″ (Massi et al., 2007). We have used the flux densities listed by Massi et al. (2007) for the MMS sources, whereas for the less robust catalog of umms sources (§2.2.1) we have performed direct aperture photometry in the SIMBA map. However, if the umms source was found near to another SIMBA source, we retained the original catalog flux density value. In the case that more than one SIMBA source is positionally associated with a single BLAST object, or it is sufficiently close to the BLAST source to affect the photometry, the flux densities of all associated sources are added and used as an upper limit in the BLAST source SED. For those BLAST sources without a SIMBA counterpart (MMS or umms), we estimate an upper limit to the flux density by performing aperture photometry centered over the BLAST coordinates.
3.3. The MIR and FIR
3.3.1 IRAS and Akari
In Vela-D we find that several BLAST sources have counterparts in the IRAS Point Source Catalogue version 2.0 (PSC, Helou & Walker, 1988). For the cross-correlation between the IRAS-PSC and the BLAST catalogs we set the positional error equal to the semi-major axis of the IRAS error ellipse. Identifications from the IRAS-PSC were found for 26 of the 141 BLAST sources. For sources that lack PSC counterparts or measurements in any of the IRAS bands we produce measurements or upper limits directly from the IRAS Galaxy Atlas maps (IGA, Cao et al., 1997, at 60 and 100 µm, hereafter IRAS60 and IRAS100). The point spread functions (PSFs) vary across these maps, showing strong elongation along the scan direction. We have used aperture photometry to measure flux densities in the IGA maps. However, the relatively poor angular resolution of IRAS prevents unambiguous determination of the flux in the same volume as was probed by the BLAST sources, due to both extended halo emission and source crowding. Consequently, the IRAS-PSC fluxes are used as upper limits only.
We have found the Akari counterparts associated with all BLAST sources in Vela-D. However, the Akari fluxes have not been used in estimating the best-fit SED (§4), although they are actually shown on the source SED in the two examples presented in Figures 5 and 6. In fact, we have noted that the Akari fluxes from the catalog available to us (which does not include the latest calibration) very often do not quite fall on the best-fit SED determined using all other wavebands. For this reason we have conservatively determined the SED and the physical parameters of the BLAST sources from the SIMBA, BLAST and MIPS70 fluxes only.
3.3.2 IRAC and MIPS photometry
The IRAC maps were analyzed by means of the DAOPHOT photometric package (see Strafella et al., 2009). Despite the marginal sampling of the PSF by the IRAC cameras, particularly in the 3.5 µm and 4.6 µm bands, the PSF photometry was preferred because of its better accuracy, with respect to aperture photometry, in dealing with both crowded regions and variable backgrounds. After selection of a sample of bright and unsaturated sources, a point response function222For a comparison between the PRF and PSF see for example http://ssc.spitzer.caltech.edu/irac/psf.html. (PRF) was derived in each band and used to fit the sources detected at S/N 5 to obtain the corresponding photometry (Strafella et al., 2009). For the purpose of cross-correlation between the BLAST and IRAC catalogs, we assumed ″.
As for IRAC, the Spitzer MIPS observations were exploited to search for possible counterparts to the BLAST sources, also assuming ″. Because the MIPS mosaics of the Vela-D cloud are characterized by a particularly strong background level and gradient, we adopted an appropriate spatial filter to smooth all the spatial scales with sizes larger than 20 pixel (corresponding to 50 ″ and 80 ″ at 24 and 70 µm, respectively), preserving the small scale fluctuations. Then, as for IRAC, we performed PSF photometry. This approach allowed us to enlarge the original sample discussed in Giannini et al. (2007).
Because the MIPS70 data lie on the Wien side of the SED, they can strongly constrain the SED (§4), and it is thus important to determine whether the integrated emission in each waveband comes from the same volume of material. Submillimeter dust cores, particularly proto-stellar cores, are likely to have density as well as temperature gradients, implying that the bulk of the emission at different wavelengths may come from substantially different volumes of gas and dust, becoming progressively more optically thick at shorter wavelengths. The power-law density (and, possibly, temperature) profiles of the cores is then coupled with the instrumental response at each waveband, making the exact definition of the “same” core at different wavelengths an imprecise concept at best. However, we note that in a typical proto-stellar core the wavelength of a photon carrying the mean energy of the SED is µm and the radius where this photon escapes the cloud is estimated to be AU (e.g., Stahler & Palla, 2004). Thus, we think that the MIPS70 emission can still be mostly associated with the envelope of the proto-stellar core.
We investigated alternative photometric techniques and, in particular, we compared aperture photometry and a method similar to that used in the BLAST maps (§3.1), which may be of relevance to candidate flux-extraction techniques to be used in the forthcoming Herschel multi-wavelength maps. We first convolve the MIPS70 map to the BLAST250 resolution, and then we fit each compact source in the resulting map with the same Gaussian profile previously extracted from the BLAST maps. However, source crowding may seriously affect the accuracy of aperture photometry, while intrinsically different brightness distributions in the BLAST and MIPS70 wavebands make the extracted flux from fixed-position Gaussians quite unreliable. We thus decided to use catalog values, as determined from PSF photometry, except in three (isolated) sources where the catalog values were clearly incosistent with the SED constrained by SIMBA and BLAST data points. In these few cases aperture photometry was used333Following the MIPS manual at http://ssc.spitzer.caltech.edu/mips/apercorr/ we used an aperture radius pixel (with 1 pixel=4 ″ in the MIPS70 image) and an annulus region delimited by two circles of radii pixel and pixel, and an additional correction factor .. For those BLAST sources without a MIPS70 counterpart, an upper limit to the emission was determined also using aperture photometry.
We also checked the MIPS maps for the possible occurrence of detector saturation. In accordance with the MIPS manual444http://ssc.spitzer.caltech.edu/documents/SOM/ we verified that the elemental integration time, which represents the ultimate threshold to estimate a possible saturation, was short enough that none of the detected sources are saturated at 70 µm.
4. MILLIMETER-MIR SEDs
4.1. The Approach
In this section we describe how, using the SIMBA, BLAST and MIPS70 photometry (i.e., excluding Akari data points, see §3.3.1) discussed in the previous sections, we fit a SED for each BLAST core. However, this is complicated by the possibility that some BLAST cores may be composed by multiple sources. In fact, although BLAST achieved an unprecedented angular resolution at 250 µm, this is partially compensated by the relatively large distance of Vela-D, thus resulting in a spatial resolution of about 0.1 pc. This scale is comparable to the average dense core diameters found by Motte et al. (2007) in Cyg-X and by Rathborne et al. (2008) in the Pipe nebula. The 0.1 pc scale is also comparable with the average diameter of ammonia cores found by Jijina et al. (1999), although it is considerably larger than the diameter found for low-mass cores in nearby SF regions by Ward-Thompson et al. (1999) and Enoch et al. (2008). However, we also find that of the 31 SIMBA sources associated with BLAST cores, only 4 are actually resolved as a double-core system by the smaller beam of the SEST telescope, suggesting that either the typical scale-length of the cores in Vela-D is considerably smaller than pc, or there are relatively few multiple sources.
In addition, we note that for the typical mass of the cores in Vela-D (a few solar masses, see §5.3) the power-law relation found by Lada et al. (2008) between the core mass and the core radius, would predict (if extrapolated to masses ) a core radius of about 0.05 pc, well matched with the linear resolution of BLAST at the distance of Vela-D. Furthermore, based on data from Beltrán et al. (2006), who surveyed more massive cores, one can also find that (, Cesaroni, priv. comm.), quite similar to the mass-size relation found by Massi et al. (2007), , in Vela-D itself. These findings indicate that for core masses larger than about almost all sources have diameters larger than about pc.
Nevertheless, even in the BLAST cores that are indeed individual entities, the source would still likely be composed of regions at different temperatures, typically a warmer core (with or without a protostar or proto-stellar cluster) embedded in a colder and less dense medium (except for those cores possibly heated from an external source). The variations in physical parameters such as temperature and density are likely to be much less critical in starless cores (e.g., André et al., 1999). Our goal is thus to use a simple, single-temperature SED model to fit the sparsely sampled photometry described in §3, which will allow us to infer the main physical parameters of each core: mass, temperature and luminosity. These quantities must be interpreted as a parameterization of a more complex distribution of temperature and density in the core and the equally complex response of each instrument to these physical conditions.
4.2. SED fitting with modified blackbody function
Following the method described by Chapin et al. (2008) we assume optically-thin emission from an isothermal modified blackbody,
| (3) |
where is a constant, is the Planck function, is the dust emissivity index, and the emissivity factor is normalized at a fixed frequency . We then write the factor in terms of a total (gas + dust) core mass, , the dust mass absorption coefficient (evaluated at ), and the distance to the object, (which is here taken as 700 pc for all cores):
| (4) |
Since refers to a dust mass, the gas-to-dust mass ratio, , is required in the denominator to infer total masses. We adopt cm2 g-1, evaluated at µm. While the actual value of may depend on the physical conditions of the local ISM or molecular cloud (e.g., Frisch & Slavin, 2003, Vuong et al., 2003, and references therein) we adopt the value of for simplicity. Equation (3) is fit to all of the BLAST and archive photometry, from 1200 to 70 µm using optimization. Color correction of the BLAST flux densities, before comparing them with other photometry, is described in Chapin et al. (2008) and Truch et al. (2008), and the resulting BLAST color-corrected fluxes are listed in Table The BLAST Survey of the Vela Molecular Cloud: Physical Properties of the Dense Cores in Vela-D. is not well constrained and we choose to fix it to (see Netterfield et al., 2009 for a discussion about the adopted values for and ), while only and are allowed to vary.
“Survival analysis” is adopted to properly include the upper-limits in the calculation of (see the discussion in Chapin et al., 2008), and we choose to use all photometry at wavelengths shortward of 70 µm as upper-limits. This is motivated by the following reasons: (i) emission at 24 µm and shorter is coming from volumes of material quite different from those emitting at longer wavelengths, which is typically associated with the coldest and less dense dust; (ii) at shorter wavelengths there can be significant contributions from hotter dust grains, PAH bands and other spectral features; and, (iii) in proto-stellar regions multiple sources may be present that are simultaneously associated with the emission in the FIR/submillimeter wavebands. In the latter case, these multiple fluxes are all summed together and taken as upper-limits in the SEDs.
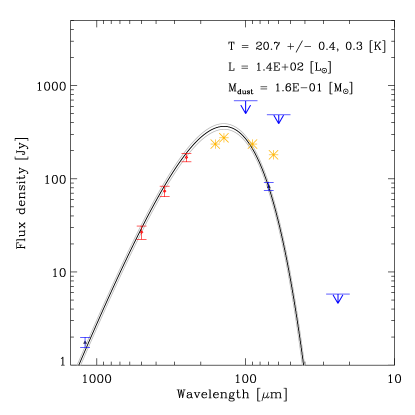
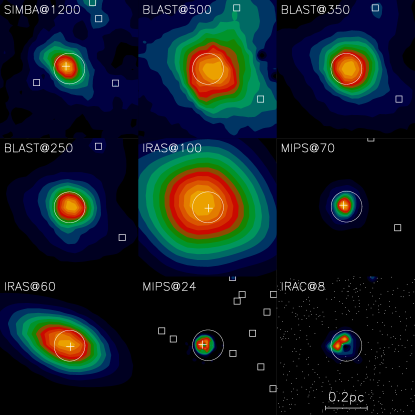
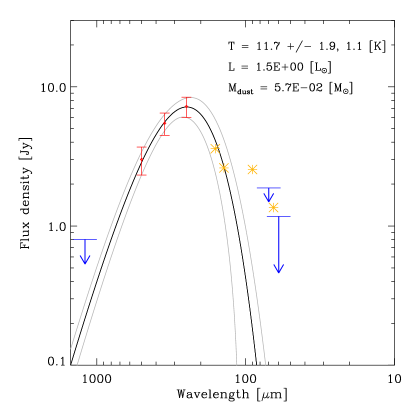
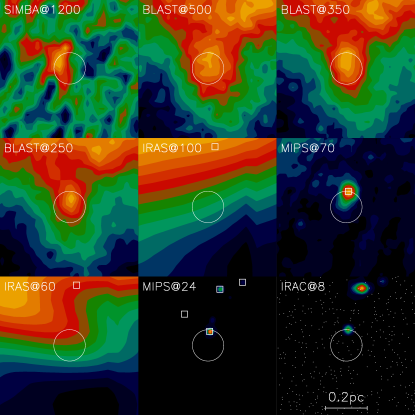
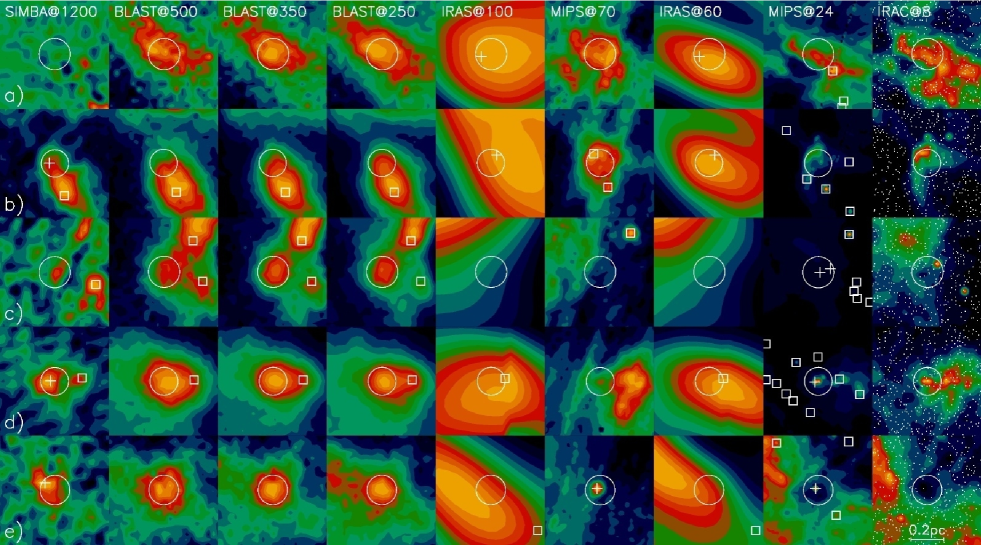
Figure 5 shows an example SED for the source BLAST J084848-433225, one of the brightest BLAST objects in the sample, with a best fit temperature to the mm-FIR data of 20.7 K. Likewise, Figure 6 shows the SED of BLAST J084542-432721, one of the coldest objects in Vela-D ( K). As seen in this example, observations across the BLAST wavelength range clearly reveal a turnover in the FIR SED for the coldest objects. The thumbnails shown in the bottom panel of Figure 6 clearly emphasize the lack of counterparts in the shorter-wavelength bands for this object, though it is located near a warmer object with clear MIPS24 and MIPS70 counterparts.
Particularly for the coldest objects, undetected in the FIR-MIR wavebands, there is a strong degeneracy between the values of and , i.e. there can be a large spread in the values of these parameters that can fit the SED equally well . This effect is less important for more evolved sources, which usually have a FIR-MIR counterpart, thus better constraining the SED shape and location of the FIR peak. Fixing the value of has the advantage of reducing the inferred errors in (Chapin et al., 2008) and makes the shape of the SED depend on temperature only, but it clearly prevents the analysis of possible variations of as a function of other source parameters. The physical parameters derived from the best-fit SED for each source are listed in Table The BLAST Survey of the Vela Molecular Cloud: Physical Properties of the Dense Cores in Vela-D, whereas the flux densities used in the SED and the counterparts found in each catalog are listed in Table The BLAST Survey of the Vela Molecular Cloud: Physical Properties of the Dense Cores in Vela-D.
5. COMPARING THE PHYSICAL PROPERTIES OF STARLESS AND PROTO-STELLAR CORES
5.1. Separating starless and proto-stellar cores
In this section we consider the properties of starless and proto-stellar cores. The former will be defined as those cores without an internal source of luminosity (i.e., a protostar), and may be further defined as “pre-stellar” when they appear to be gravitationally bound. Proto-stellar cores, on the other hand, have an embedded self-luminous source (which may also be a cluster of objects) and possibly show other signs of SF, such as molecular outflows.
Starless and proto-stellar cores may be differentiated by identifying MIR counterparts associated with the submillimeter cores. Here we define as proto-stellar those cores which have a MIPS24 compact source, with flux greater than 3 mJy (see §5.2), within the search radius defined in §3. For the BLAST cores outside the area covered by the MIPS24 map (a total of 52 objects) we use the association with compact sources from the Midcourse Space Experiment (MSX) catalog, although the sensitivity limit is much higher than that of the MIPS24 catalog (e.g., Egan et al., 1999), and thus some of the starless cores outside the MIPS covered area might have a yet undected MIR counterpart (see §5.3.1, §5.3.2 and §5.4 for a discussion of this point). We note that some of the point-like objects detected by MIPS24 may have a very low luminosity, so we would expect that they neither heat up the core overall nor increase its luminosity. Thus, the emission of these early proto-stellar cores in the BLAST wavebands will look much the same as the starless cores.
As SF in the core proceeds, more and more luminosity is generated, mostly from accretion but also from the quasi-static contraction of the interior and, later, from nuclear fusion. This luminosity is re-processed by dust and hence these objects will appear more luminous and warmer (and thus also with a larger luminosity-to-mass ratio, ). In terms of the observational properties, one should therefore expect a smooth transition from the pre- to the proto-stellar phase. Our criteria are not meant to provide a sharp separation between these two classes of objects, but should provide guidelines for understanding the physical conditions where the transition takes place.
5.2. MIPS24 and IRAC counterparts
Analysing in more detail the association of MIPS24 point-sources with the BLAST cores, we find that only two cores, BLAST J084612-432337 and BLAST J084745-432637, have MIPS24 counterparts with fluxes lower than 3 mJy, i.e., the threshold selected by Enoch et al. (2008) to eliminate most extragalactic interlopers. We thus classify these two cores as starless. By comparing the surface density of MIPS24 catalog sources in the area covered by the MIPS24 data with a circular area of radius equal to the search radius, we estimate the probability of finding a chance association with a MIPS24 source, brighter than 3 mJy, within the search radius to be less than 10%. Thus, although chance associations of BLAST cores with MIPS24 point sources seem unlikely, in §5.4 we analyse how these might potentially affect the overall distribution of physical parameters between starless and proto-stellar objects.
| Starless | Proto-stellar | |||||||
|---|---|---|---|---|---|---|---|---|
| All | All | |||||||
| [K] | 14.6 | 13.1 | 12.9 | 15.7 | 15.5 | 17.2 | ||
| [] | 4.6 | 7.0 | 15.3 | 4.8 | 8.7 | 16.5 | ||
| [] | 4.4 | 4.5 | 7.0 | 7.5 | 10.9 | 84.7 | ||
| [] | 1.0 | 0.5 | 0.5 | 1.6 | 1.5 | 2.7 | ||
Note. — Median values of the best fits to the SEDs. The two completeness limits, and , correspond to sources with K and K, respectively.
We also find cases (a total of 26 objects) where a source is detected in the MIPS24 band, but not in the MIPS70 band. As an example, we show in Figure 7(c) source BLAST J084842-431735, where we find an associated point source from the MIPS24 catalog, but no point or even compact MIPS70 emission at the position of the BLAST core. In more than one third of other similar cases, some compact weak or halo emission associated with the BLAST core is found in the MIPS70 map. An example is shown in Figure 7(d): we can clearly see a weak compact source of emission in the MIPS70 map at the position of the BLAST core, though no point source is found in the catalog. In such cases, it is likely that a combination of intrinsically low 70 µm emission and/or instrumental artifacts (e.g., stripes) in the MIPS70 maps may mask the 70 µm counterpart to the MIPS24 source associated with the BLAST core. Geometrical projection effects may also be playing an important role at wavelengths µm for sources with an embedded protostar (e.g., Whitney et al., 2004).
Identifying the NIR/MIR young proto-stellar counterparts associated to the BLAST cores is beyond the scope of this work. However, we have carried out a preliminary search of IR candidates among the IRAC sources, selected using the following criteria: (i) spectral index , estimated using 2MASS, IRAC and MIPS24 data, with values ; (ii) the source must be detected in the IRAC 8 µm band; and (iii) when no MIPS24 flux is available, the flux extrapolated from 2MASS and IRAC data must be consistent with an upper limit in the MIPS24 band. With these criteria, we find that 69% of the starless cores, as defined above, within the area in Vela-D covered by IRAC do not have an IRAC candidate. Likewise, we find that 73% of the proto-stellar cores do have an IRAC candidate. Other criteria can be found in the literature (see, e.g., De Luca et al., 2007, Enoch et al., 2009), but our quick search indicates that the starless and proto-stellar populations have been fairly accurately characterized.
However, we can also use other signposts of early SF activity, such as proto-stellar jets and molecular outflows. In fact, we have identified 13 BLAST cores associated with the H2 jets and knots observed by Giannini et al. (2005), Giannini et al. (2007) and De Luca et al. (2007), and all of them had been correctly identified as proto-stellar, except the core BLAST J084822-433152, which has no MIPS24 (and no MIPS70) counterpart and had thus been classified as starless. However, the association of this specific core with an H2 jet is not as robust as the others (De Luca et al., 2007) and thus given its other properties we have decided to keep its classification as starless. We have also identified the BLAST cores associated with the 12CO(1–0) molecular outflows observed by Elia et al. (2007) and found that only one core, BLAST J084805-435415, had been previously incorrectly classified as starless.
As an additional category, we also find some BLAST cores that are detected in MIPS24, MIPS70 (and in the IRAC bands) that are characterized by quite low temperatures. An example is source BLAST J084928-440426, shown in Figure 7(e), which is clearly associated with bright MIPS24 and 70 point sources. However its temperature, as determined from the best fit to the SED, is only 13.1 K. Such a cold source is not expected to emit a detectable flux in the MIPS70 band and we are therefore left with two possible scenarios: (i) either the 70 µm flux is mostly emitted by the warmer central source associated with the BLAST core, and thus the BLAST fluxes represent the contribution from a much colder envelope; or, (ii) the BLAST fluxes and the MIR emission are associated with two (or more) separate objects, a cold, starless core detected by BLAST, and a nearby proto-stellar core detected by MIPS with negligible emission in the submillimeter. Because of our inability to discriminate between these two scenarios, and for consistency with the criteria given above, we consider these cores as proto-stellar.
Finally, we note that in objects such as core BLAST J084928-440426 (of the previous example) although associated with point sources in the IRAC and MIPS wavebands, the peak of the submillimeter emission corresponds to a minimum in the MIPS24 and IRAC8 maps, as shown in Figure 7(e). This and other similar cores stand out as dark shadows against the diffuse 8 and 24 µm emission.
5.3. Distribution of physical parameters
5.3.1 Best fit values: temperature
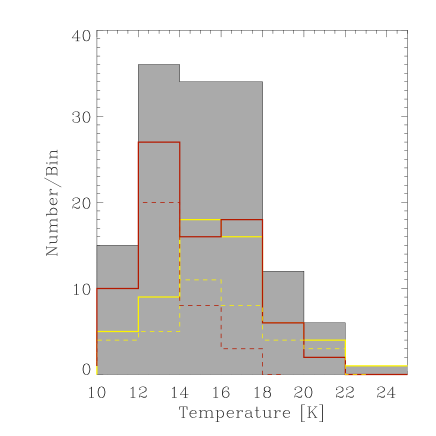
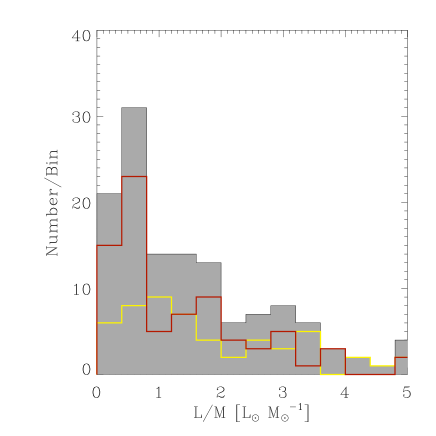
Temperature distributions for starless and proto-stellar cores in Vela-D are shown in Figure 8. The histograms refer to the values of the physical parameters as obtained from the best fit to the SED of each source found in the area defined in §2.1 and Figure 1. The effects, on the overall distribution, of the errors on the parameters determined for each individual source will be discussed in §5.3.3. It must also be noted that only 89 objects are located within the common area covered by the MIPS24 and MIPS70 maps (see Figure 3).
In Figure 8 we note that the temperature distribution has a wide peak at K, with a sharp cutoff at the low end around K and also at the high end, at about K. In fact, less than 7% of the sources are warmer than 20 K, and they are mostly proto-stellar objects. The median value for the whole sample is 15.4 K, and we note that proto-stellar cores are slightly warmer (median temperature 15.7 K) than starless cores (median temperature 14.6 K). However, if we restrict ourselves to mass ranges for which we are progressively more complete, then the temperature difference between starless and proto-stellar cores appears to become increasingly more significant, as shown in Table 1 and by the dashed lines in the top-left panel of Figure 8. Clearly, in this case the sample size also becomes smaller. The higher value of the overall median temperature, as compared for example to the Pipe cores (Rathborne et al., 2008) or the cores in Vela-C, suggests that the cores in Vela-D are indeed in a later stage of evolution. The range of values found for the spectral index (§5.2) is an evidence for different evolutionary stages within the proto-stellar population. However, we have not attempted to separate the starless and proto-stellar populations into further sub-groups.
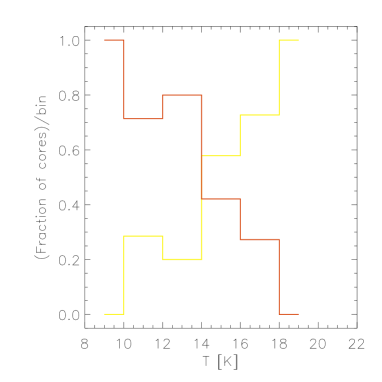
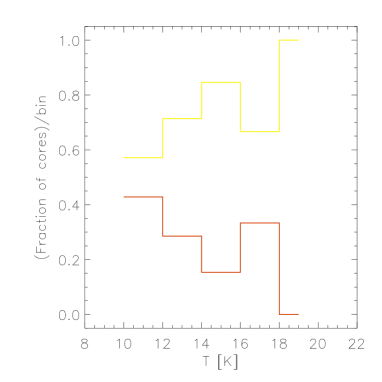
One question of interest is whether temperature is a good discriminator of starless and proto-stellar cores, in a statistical sense. The overlap between the temperature distributions of starless and proto-stellar cores in Figure 8, besides being affected by completeness effects (see Table 1), is also likely to be a consequence of the smooth transition from the pre- to the proto-stellar phase, as discussed in §5.1. This can also be seen in the top panel of Figure 9, where we show the fraction (out of the total number of cores in each bin) of starless and proto-stellar cores, as a function of core temperature, in the whole Vela-D region. The plot clearly shows that the fractions of starless and proto-stellar cores have opposite trends with temperature. This trend is also visible, though to a lesser extent, in the smaller region covered by the MIPS24 map (bottom panel of Figure 9), where we are able to better discriminate starless from proto-stellar cores (§5.1). If sensitive MIR observations were also available outside the MIPS24 map one would expect the top panel of Figure 9 to become more like the histogram in the bottom panel. Possible bias effects caused by the use of MIPS24 and MSX data in different regions of Vela-D are later discussed in §5.4.
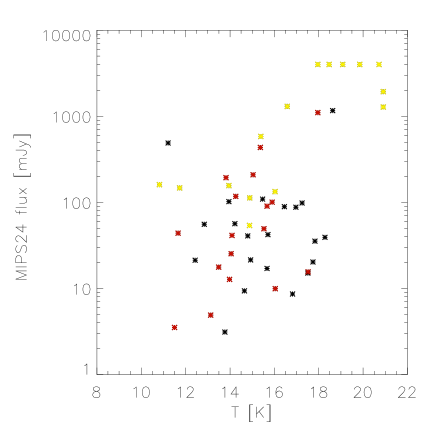
The distribution of temperature among the Vela-D sources can also be used to search for evidence of evolution within the proto-stellar cores found in the MIPS24 map. Thus, in Figure 10 we plot the MIPS24 flux as a function of core temperature, and we also separate cores in two different mass ranges, to be able to partially disentangle evolutionary effects from core mass-related effects.
Figure 10 then shows two distinct features: (i) first, there is a trend for the MIPS24 flux to increase with temperature; and, (ii) this trend is visible also within the two selected mass ranges, though these two subsets appear to populate different regions of the plot. The sources with higher masses, in fact, appear to also have somewhat higher MIPS24 fluxes and temperatures. We tentatively explain the main trend of flux vs. temperature as an evidence of different evolutionary phases within the population of proto-stellar cores, while the partial segregation of the two subsets described above appears to be associated with the mass of the core. This result is consistent with the trend in the diagram observed by Enoch et al. (2009) and modeled by Young & Evans (2005) (see also Whitney et al., 2003). The increase in is accompanied by a general increase of the flux density at MIR wavelengths.
5.3.2 Best fit values: mass and luminosity
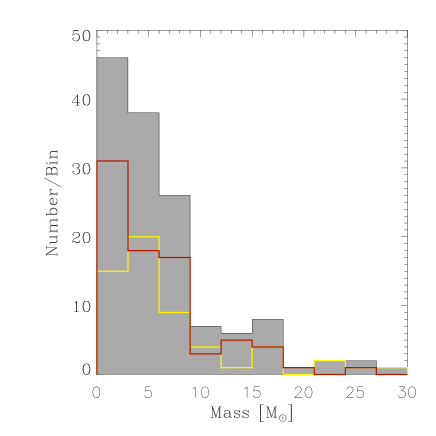
The overall mass distribution in Figure 8 shows, as expected, an almost monotonic decrease from lower to higher masses. It also shows very few cores with . In fact, the median value for the whole sample is , whereas from Table 1 we note that the median masses of starless and proto-stellar cores are not significantly different, suggesting that the envelope mass is not severely affected by the transition between the two phases.
| Starless | Proto-stellar | |||||
|---|---|---|---|---|---|---|
| mm-MIR | BLAST | mm-MIR | BLAST | |||
| [K] | ||||||
| [] | ||||||
| [] | ||||||
| [] | ||||||
Note. — The table lists the mean values obtained by averaging the medians of each Monte carlo simulation, for all cores in the whole Vela-D region. The columns labelled “mm-MIR” list the average values obtained using the SIMBA, BLAST and MIPS70 data in estimating the best-fit SED of each individual source. The columns labelled “BLAST” list the values obtained from BLAST photometry only. Only cores with (see Table 1) have been selected.
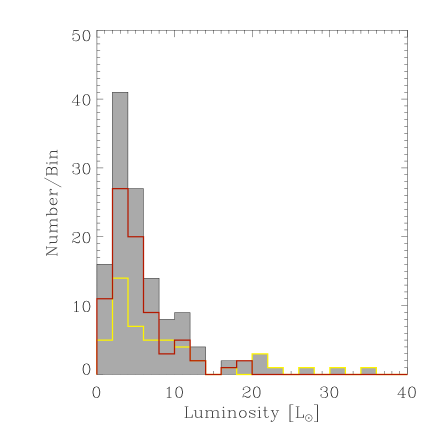
In Figure 8 we also show the FIR luminosity distribution of the cores in Vela-D. FIR luminosities, , are the integrated luminosities from the modified blackbody fit. Though not shown (to make the histogram easier to read), we find 11 sources (% of the total, all proto-stellar but one, BLAST J084539-435133) with luminosities higher than . The luminosity histogram shows a strong peak at and a rapidly decreasing trend at higher luminosities. The median value for the whole sample is and contrary to the mass distribution we find a significant difference between the median luminosity of starless and proto-stellar cores (see Table 1).
Although the luminosity-to-mass ratio, , is essentially equivalent to temperature (see later Figure 11), it is useful to show it separately in Figure 8 and in Table 1, as well as in the rest of the paper. Like temperature, this ratio is also expected to increase with time as more and more gas is converted into stars during the SF process and the embedded protostar, or proto-cluster, becomes more luminous. For the simple SED model adopted, we find a range , with % and % of the sources having and , respectively. The median value for the whole sample is . Like temperature, the higher value of the luminosity-to-mass ratio found in proto-stellar cores does suggest that they are indeed at a later stage of evolution.
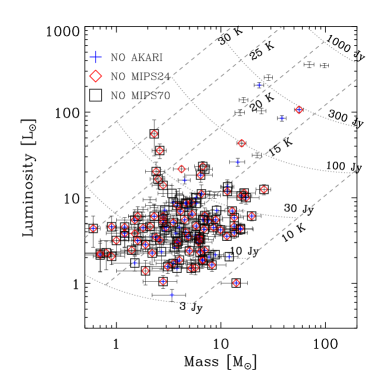
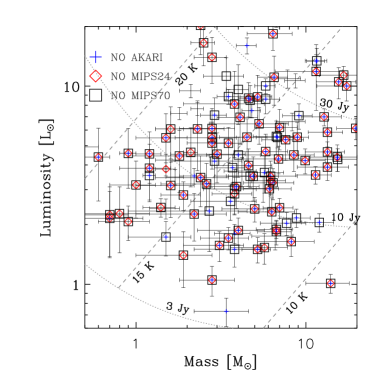
The temperatures and masses of the cores are also shown in Figure 1, for both starless and proto-stellar cores, where we note some interesting features. First, one can see the higher concentration of proto-stellar cores toward the central filaments. While this might partly be a consequence of being unable to identify all proto-stellar cores outside the MIPS24 area, we think that the presence here of many IRS sources (§2.3) would indeed suggest that this region of Vela-D is in a later stage of evolution. We also tentatively note that the most massive cores are rarely found in isolation (such as several of the IRS sources); instead, they are often associated with small clusters of objects. On the other hand, the most isolated cores tend to be low-mass objects. These characteristics, though no quantitative measurement is involved, seem to be in agreement with more systematic observations (e.g., Faustini et al., 2009) and numerical simulations (e.g., Smith et al., 2009). Another interesting feature is the filament at and which is exclusively composed of massive and cold starless cores.
Finally, in Figure 11 we show a plot of the luminosity as a function of mass. The plot shows a high concentration of points at temperatures K, or , which clearly reproduces the results already shown in Figure 8. Separated from the main concentration of sources, we note in Figure 11 a small group of 9 bright objects with flux density (at 250 µm) Jy and . In fact, five of these correspond to known IRS sources (Liseau et al., 1992), IRS17 to IRS21, and all of these objects belong to small clusters of sources (§2.3).
5.3.3 Monte Carlo Simulations
In this section we want to discuss the effects that the errors on the physical parameters of each source, as determined using the procedure described in §4.2, have on the overall statistical distribution. To do this, we have used Monte Carlo simulations in which the values of temperature, mass, luminosity and luminosity-to-mass ratio of each source are varied within the uncertanties listed in Table The BLAST Survey of the Vela Molecular Cloud: Physical Properties of the Dense Cores in Vela-D. After each simulation, the histograms with the distribution of the four physical parameters are evaluated and the median values are determined. Also, the values of each bin in the histograms are stored for further computation. At the end of 500 such simulations, the mean and standard deviation of the median values are determined and listed in Tables 2 and 3.
In order to analyze possible systematic effects and biases, during each simulation the random values of temperature, mass, luminosity and luminosity-to-mass ratio were first determined based on the best fit results and uncertainties obtained using SIMBA, BLAST and MIPS70 photometry (§4 and Table The BLAST Survey of the Vela Molecular Cloud: Physical Properties of the Dense Cores in Vela-D). Then, we repeated the procedure, but using the values obtained from BLAST-only photometry. Furthermore, the Monte Carlo simulations have been performed for two different sets of data: first, we used the complete sample of 141 Vela-D sources (see Table 2). Then, we repeated the simulations only for those BLAST cores falling in both the SIMBA and MIPS70 maps. In both cases we selected only those cores with (see Table 3; see also note in Table 1), thus the values in these tables should be compared with columns 4 and 7 in Table 1. In particular, Table 3 allows to evaluate the effects of our inability to correctly identify all proto-stellar cores outside the MIPS24 area (which overlaps well with the MIPS70 area, see Figure 3).
The results listed in Tables 2 and 3 can be summarized as follows: (i) in general, the uncertanties associated with the physical parameters obtained from BLAST-only photometry are higher, which is a direct consequence of the more accurate determination of the physical parameters achieved through mm to MIR photometry (when available); (ii) the mean values of the physical parameters obtained from BLAST-only and mm-MIR photometry are consistent, within the errors, for both starless and proto-stellar cores, and separately in the two selected samples; (iii) some differences may be seen between corresponding mean values of the whole sample and those of the smaller SIMBA/MIPS70 sample, which reflect several effects such as: completeness, correct identification of starless and proto-stellar cores outside the MIPS24 coverage (§5.4), different evolutionary stage of the densest, central region in Vela-D (§5.3.2); (iv) despite these effects, the main features of starless and proto-stellar cores discussed in §5.3.1 and §5.3.2 are still observable in Tables 2 and 3.
5.4. Potential effects biasing the distribution of physical parameters
In §5.2 we mentioned that as many as 10% of the MIPS24 counterparts to the BLAST cores could be the result of chance associations. To estimate their potential impact on the distribution of physical parameters between starless and proto-stellar cores we used the following procedure. First, we randomly select 10% of the proto-stellar cores and assume that they are false associations, and thus transfer them into the sample of starless cores. Then, we estimate the median of all physical parameters using these re-defined samples of starless and proto-stellar cores. We repeat the previous two steps 500 times and finally we estimate the mean of all the median values previously determined. We thus obtain for starless and proto-stellar cores, respectively: K and K; and ; and ; and . We note that these average values are essentially equivalent to those shown in Table 1 and thus do not change any of our previous conclusions.
We also previously mentioned in §5.1 that outside of the region covered by MIPS24 we used MSX to separate starless and proto-stellar cores. It might be argued, then, that the trend we find in parameter space between starless and proto-stellar cores may be caused partially by our inability to detect faint MIR sources associated with BLAST cores using MSX data. However, we think this is not the case for two reasons: (i) if some of the cores outside the MIPS24 coverage are incorrectly classified as starless because of the lack of a MSX counterpart, then the overall starless sample will be contaminated by (likely) warmer proto-stellar cores, thus reducing the difference in the median temperature between starless and proto-stellar cores; (ii) within the MIPS24 map, when we consider a more complete sample (, see Figure 9) the trend in physical parameter space discussed above is confirmed: the median temperature (or ratio) of starless and proto-stellar cores are, respectively, 14.2 and 15.4 K (or 0.9 and 1.4 , respectively). In addition, we note that 71 % of the BLAST cores associated with a MSX counterpart are concentrated in the region covered by MIPS24 (measuring about deg2), while the remaining 29 % is found outside this area (which measures deg2). Thus, using MSX data alone, we find a larger density of candidate proto-stellar cores toward the central region of Vela-D, suggesting that this region is in a later stage of evolution. It also indicates that the number of BLAST cores with a MIR counterpart should be expected to decrease outside the MIPS24 map, which in turn makes the lack of sensitive MIR observations outside the MIPS24 area less critical. In fact, if we use the MSX source surface density as a rough indicator of the density of proto-stellar sources (correcting for the area ratio, , one expects a % probability of finding a proto-stellar core outside the MIPS24 area), and the ratio of the total number of MIPS24 sources to the number of MIPS24 sources with a MSX counterpart in the MIPS24 area (), we thus estimate that the number of proto-stellar cores not detected by MSX outside the MIPS24 area is .
5.5. Mass Spectrum
It is interesting to investigate the combined mass spectrum, including both starless and proto-stellar sources in Vela-D. The masses of individual cores were placed in logarithmically spaced bins and a lower limit on the error was estimated from the Poisson uncertainty for each bin. The resulting mass function is shown in Figure 12. We then fit a power-law ) to the CMF for , finding a slope with a correlation coefficient . The best-fit slope depends somewhat on the histogram binning. Given the relatively low number of sources in Vela-D we could not vary greatly the bin widths; however, for bin widths of to 4.2 we obtain values to , so we empirically assign the value . We note that in the fit the bin at M⊙ has also been used, but because this bin is likely to be affected somewhat by completeness effects, it may be biasing low the resulting slope of the CMF.

Because almost all of the Vela-D sources have temperatures K (see §5.3) the appropriate mass completeness limit is shown as a vertical dotted line in Figure 12 for cores warmer than 12 K. The two lowest bins suggest a turnover, but this shape is probably due to incompleteness and thus cannot be used to make any statement about the point at which the mass distribution flattens. Compared to previous surveys and measurements of the CMF, our data rely on a robust determination of the core temperature. There may be some concern over the use of a fixed value of the dust emissivity, ; however, as discussed by Chapin et al. (2008) this effect may shift the CMF, but does not affect the power-law index.
The slope of the CMF found for the cores in Vela-D is very similar to that determined for Orion () by Nutter & Ward-Thompson (2006) in the mass range , and also to that found for the cores in Perseus, Serpens and Ophiucus () by Enoch et al. (2008), in a comparatively lower mass range (). Our CMF is steeper than that found also in Vela-D by Massi et al. (2007), who report , and by Elia et al. (2007) who find (with as the most probable). The lower values for measured by Massi et al. (2007) and Elia et al. (2007) are likely a consequence of the smaller source samples used to compute the CMF and also the fact that these surveys may have missed many of the coldest, low-mass sources. In fact, if we evaluate the CMF using only the BLAST cores with SIMBA counterparts we find values of consistent with those of Massi et al. (2007) and Elia et al. (2007).
All of these CMFs appear to have remarkably similar shapes to that of the stellar IMF, as given for example by Kroupa (2002). While the observations taken together suggest that the CMF is a direct precursor of the stellar IMF, it should be noted that the measured masses of Nutter & Ward-Thompson (2006), Enoch et al. (2008) and Massi et al. (2007) are somewhat more uncertain than ours because they lack (partially or completely) temperature information for the cores.
We have not attempted to evaluate separately the CMF of starless and proto-stellar cores in Vela-D, because of the relatively small number of sources in the two sub-samples. However, this has been done for the much larger source sample of the Vela deep map by Netterfield et al. (2009), who use this result to infer the lifetime of the BLAST starless cores in the VMR. Netterfield et al. (2009) find that cores above 14 M⊙ in the Vela deep map follow a CMF with , which is moderately steeper than the CMFs mentioned earlier and also steeper than the Salpeter IMF. However, they also find that in the smaller Vela-C region, the CMF has thus consistent within the errors with the value found in Vela-D, also because, as previously mentioned, we may be biasing low the slope of the CMF. We note that the somewhat less steep CMF in Vela-D, which is in a later evolutionary phase compared to Vela-C, is consistent with cold cores following a steeper mass function than more evolved cores, as found by Netterfield et al. (2009).
6. SUMMARY AND CONCLUSIONS
In this paper we have presented a detailed analysis of the dense cores in the Vela-D molecular cloud, utilizing the sensitive maps at 250, 350 and 500 µm obtained by BLAST during its 2006 science flight from Antarctica. We have combined the multi-color BLAST photometry with previous MIR, FIR, and millimeter-continuum observations to determine the physical parameters of the population of cores detected by BLAST. Our sample includes a total of 141 objects, although only 89 cores are located within the common area covered by the MIPS24 and MIPS70 maps. We summarize the other results of this paper as follows:
1. The multi-band photometry, combined with an isothermal modified blackbody model, allows us to analyze the effects that the uncertainties on the derived physical parameters of the individual sources have on the overall properties of starless and proto-stellar cores.
2. In the area of Vela-D covered by the MIPS24, MIPS70 and SIMBA maps we find 34 cores, out of 89, having no MIPS24 or MIPS70 counterpart, with 28 of these cores not having been detected by SIMBA either. Therefore, these observations demonstrate the importance of observing the early cores at or near the SED peak, as made possible by BLAST.
3. The CMF determined from all (starless and proto-stellar) BLAST cores in Vela-D shows a power-law slope of , consistent, within the errors, with other continuum (sub)millimeter surveys and in particular with the slope found by Netterfield et al. (2009) in Vela-C.
4. We find a moderate difference between the median mass of proto-stellar and starless cores. We also find that proto-stellar cores are somewhat warmer and more luminous than starless cores, and that there is a progressively higher fraction of proto-stellar cores with increasing core temperature. This suggests, as expected, a luminosity and temperature evolution due to the appearance of an embedded protostar.
5. In terms of the observational properties, there appear to be a smooth transition from the pre- to the proto-stellar phase, as suggested by differences found within the two populations. In particular, for proto-stellar cores we find a correlation between the MIPS24 flux, associated with the central protostar, and the temperature of the dust envelope. Our results can thus provide guidelines for understanding the physical conditions where the transition between pre- and proto-stellar cores takes place.
References
- André et al. (1999) André, P., Ward-Thompson, D., & Barsony, M. 1999, in Star Formation 1999, Proceedings of Star Formation 1999, held in Nagoya, Japan, June 21 - 25, 1999, ed. T. Nakamoto, 145–152
- Barnard et al. (2004) Barnard, V. E., Vielva, P., Pierce-Price, D. P. I., Blain, A. W., Barreiro, R. B., Richer, J. S., & Qualtrough, C. 2004, MNRAS, 352, 961
- Beltrán et al. (2006) Beltrán, M. T., Brand, J., Cesaroni, R., Fontani, F., Pezzuto, S., Testi, L., & Molinari, S. 2006, A&A, 447, 221
- Cao et al. (1997) Cao, Y., Terebey, S., Prince, T. A., & Beichman, C. A. 1997, ApJS, 111, 387
- Carey et al. (2005) Carey, S. J., Noriega-Crespo, A., Price, S. D., Padgett, D. L., Kraemer, K. E., Indebetouw, R., Mizuno, D. R., Ali, B., Berriman, G. B., Boulanger, F., Cutri, R. M., Ingalls, J. G., Kuchar, T. A., Latter, W. B., Marleau, F. R., Miville-Deschenes, M. A., Molinari, S., Rebull, L. M., & Testi, L. 2005, in Bulletin of the American Astronomical Society, 1252
- Caswell & Haynes (1987) Caswell, J. L. & Haynes, R. F. 1987, A&A, 171, 261
- Chapin et al. (2008) Chapin, E. et al. 2008, ApJ, 681, 428
- De Luca et al. (2007) De Luca, M., Giannini, T., Lorenzetti, D., Massi, F., Elia, D., & Nisini, B. 2007, A&A, 474, 863
- Egan et al. (1999) Egan, M. P., Price, S. D., Shipman, R. F., Gugliotti, G. M., Tedesco, E. F., Moshir, M., & Cohen, M. 1999, in Astrophysics with Infrared Surveys: A Prelude to SIRTF. Edited by M.D. Bicay, C.A. Beichman, R.M. Cutri and B.F. Madore. ASP Conference Series, Vol. 177, Vol. 177, 404–408
- Egan et al. (1998) Egan, M. P., Shipman, R. F., Price, S. D., Carey, S. J., Clark, F. O., & Cohen, M. 1998, ApJ, 494, L199
- Elia et al. (2007) Elia, D., Massi, F., Strafella, F., De Luca, M., Giannini, T., Lorenzetti, D., Nisini, B., Campeggio, L., & Maiolo, B. M. T. 2007, ApJ, 655, 316
- Enoch et al. (2009) Enoch, M. L., Evans, II, N. J., Sargent, A. I., & Glenn, J. 2009, ApJ, 692, 973
- Enoch et al. (2008) Enoch, M. L., Evans, II, N. J., Sargent, A. I., Glenn, J., Rosolowsky, E., & Myers, P. 2008, ApJ, 684, 1240
- Faustini et al. (2009) Faustini, F., Molinari, S., Testi, L., & Brand, J. 2009, A&A, 503, 801
- Fazio et al. (2004) Fazio, G. G. et al. 2004, ApJS, 154, 10
- Frisch & Slavin (2003) Frisch, P. C. & Slavin, J. D. 2003, ApJ, 594, 844
- Giannini et al. (2007) Giannini, T., Lorenzetti, D., De Luca, M., Nisini, B., Marengo, M., Allen, L., Smith, H. A., Fazio, G., Massi, F., Elia, D., & Strafella, F. 2007, ApJ, 671, 470
- Giannini et al. (2005) Giannini, T., Massi, F., Podio, L., Lorenzetti, D., Nisini, B., Caratti o Garatti, A., Liseau, R., Lo Curto, G., & Vitali, F. 2005, A&A, 433, 941
- Griffin et al. (2008) Griffin, M. J. et al. 2008, in Presented at the Society of Photo-Optical Instrumentation Engineers (SPIE) Conference, Vol. 7010, Space Telescopes and Instrumentation 2008: Optical, Infrared, and Millimeter. Proceedings of the SPIE, Volume 7010, pp. 701006-701006-12, ed. J. M. Oschmann, M. W. M. de Graauw, & H. A. MacEwen, 701006–701006–12
- Helou & Walker (1988) Helou, G. & Walker, D. W., eds. 1988, Infrared astronomical satellite (IRAS) catalogs and atlases. Volume 7: The small scale structure catalog, Vol. 7
- Jijina et al. (1999) Jijina, J., Myers, P. C., & Adams, F. C. 1999, ApJS, 125, 161
- Kirk et al. (2005) Kirk, J. M., Ward-Thompson, D., & André, P. 2005, MNRAS, 360, 1506
- Kroupa (2002) Kroupa, P. 2002, in Modes of Star Formation and the Origin of Field Populations, ASP Conference Proceedings, Vol. 285., ed. E. K. Grebel & W. Brandner, 86
- Lada et al. (2008) Lada, C. J., Muench, A. A., Rathborne, J., Alves, J. F., & Lombardi, M. 2008, ApJ, 672, 410
- Liseau et al. (1992) Liseau, R., Lorenzetti, D., Nisini, B., Spinoglio, L., & Moneti, A. 1992, A&A, 265, 577
- Lorenzetti et al. (2002) Lorenzetti, D., Giannini, T., Vitali, F., Massi, F., & Nisini, B. 2002, ApJ, 564, 839
- Lorenzetti et al. (1993) Lorenzetti, D., Spinoglio, L., & Liseau, R. 1993, A&A, 275, 489
- Massi et al. (2007) Massi, F., De Luca, M., Elia, D., Giannini, T., Lorenzetti, D., & Nisini, B. 2007, A&A, 466, 1013
- Massi et al. (1999) Massi, F., Giannini, T., Lorenzetti, D., Liseau, R., Moneti, A., & Andreani, P. 1999, A&AS, 136, 471
- Massi et al. (2003) Massi, F., Lorenzetti, D., & Giannini, T. 2003, A&A, 399, 147
- Massi et al. (2000) Massi, F., Lorenzetti, D., Giannini, T., & Vitali, F. 2000, A&A, 353, 598
- Massi et al. (2006) Massi, F., Testi, L., & Vanzi, L. 2006, A&A, 448, 1007
- McKee & Ostriker (2007) McKee, C. F. & Ostriker, E. C. 2007, ARA&A, 45, 565
- Motte et al. (1998) Motte, F., André, P., & Neri, R. 1998, A&A, 336, 150
- Motte et al. (2007) Motte, F., Bontemps, S., Schilke, P., Schneider, N., Menten, K. M., & Broguiére, D. 2007, A&A, 476, 1243
- Murphy & May (1991) Murphy, D. C. & May, J. 1991, A&A, 247, 202
- Netterfield et al. (2009) Netterfield, C. B. et al. 2009, submitted
- Nutter & Ward-Thompson (2006) Nutter, D. & Ward-Thompson, D. 2006, MNRAS, 368, 1833
- Pascale et al. (2008) Pascale, E. et al. 2008, ApJ, 681, 400
- Patanchon et al. (2009) Patanchon, G., Ade, P. A. R., Bock, J. J., Chapin, E. L., Devlin, M. J., Dicker, S. R., Griffin, M., Gundersen, J. O., Halpern, M., Hargrave, P. C., Hughes, D. H., Klein, J., Marsden, G., Mauskopf, P., Moncelsi, L., Netterfield, C. B., Olmi, L., Pascale, E., Rex, M., Scott, D., Semisch, C., Thomas, N., Truch, M. D. P., Tucker, C., Tucker, G. S., Viero, M. P., & Wiebe, D. V. 2009, ArXiv e-prints
- Patanchon et al. (2008) Patanchon, G. et al. 2008, ApJ, 681, 708
- Rathborne et al. (2008) Rathborne, J. M., Lada, C. J., Muench, A. A., Alves, J. F., & Lombardi, M. 2008, ApJS, 174, 396
- Rieke et al. (2004) Rieke, G. H. et al. 2004, ApJS, 154, 25
- Simon et al. (2006) Simon, R., Rathborne, J. M., Shah, R. Y., Jackson, J. M., & Chambers, E. T. 2006, ApJ, 653, 1325
- Smith et al. (2009) Smith, R. J., Longmore, S., & Bonnell, I. 2009, ArXiv e-prints
- Stahler & Palla (2004) Stahler, S. W. & Palla, F. 2004, in The Formation of Stars, ed. WILEY-VCH
- Strafella et al. (2009) Strafella, F. et al. 2009, in prep.
- Truch et al. (2008) Truch, M. D. P. et al. 2008, ApJ, 681, 415
- Truch et al. (2009) —. 2009, ApJ, submitted
- Turner et al. (2001) Turner, A. D., Bock, J. J., Beeman, J. W., Glenn, J., Hargrave, P. C., Hristov, V. V., Nguyen, H. T., Rahman, F., Sethuraman, S., & Woodcraft, A. L. 2001, Appl. Opt., 40, 4921
- Vuong et al. (2003) Vuong, M. H., Montmerle, T., Grosso, N., Feigelson, E. D., Verstraete, L., & Ozawa, H. 2003, A&A, 408, 581
- Ward-Thompson et al. (1999) Ward-Thompson, D., Motte, F., & André, P. 1999, MNRAS, 305, 143
- Whitney et al. (2004) Whitney, B. A., Indebetouw, R., Bjorkman, J. E., & Wood, K. 2004, ApJ, 617, 1177
- Whitney et al. (2003) Whitney, B. A., Wood, K., Bjorkman, J. E., & Cohen, M. 2003, ApJ, 598, 1079
- Wiebe (2008) Wiebe, D. V. 2008, in Ph.D. Thesis in Physics, University of Toronto
- Williams et al. (1994) Williams, J. P., de Geus, E. J., & Blitz, L. 1994, ApJ, 428, 693
- Wu et al. (2007) Wu, J., Dunham, M. M., Evans, II, N. J., Bourke, T. L., & Young, C. Y. 2007, AJ, 133, 1560
- Yamamura et al. (2008) Yamamura, I., Fukuda, Y., & Makiuti, S. 2008, in AKARI/FIS - Release Note (Rev.2)
- Young & Evans (2005) Young, C. H. & Evans, II, N. J. 2005, ApJ, 627, 293
| Source # | Source name | Deconvolved | ||||||||
|---|---|---|---|---|---|---|---|---|---|---|
| diameter | ||||||||||
| deg | deg | (Jy) | (Jy) | (Jy) | (K) | () | () | (pc) | ||
| 0 | BLAST J084441-431144 | 263.0044 | 0.14 | |||||||
| 1 | BLAST J084508-433755 | 263.3975 | 0.14 | |||||||
| 2 | BLAST J084509-434544 | 263.5011 | 0.10 | |||||||
| 3 | BLAST J084531-435006 | 263.6001 | 0.17 | |||||||
| 4 | BLAST J084535-435156 | 263.6303 | 0.18 | |||||||
| 5 | BLAST J084538-435507 | 263.6770 | 0.12 | |||||||
| 6 | BLAST J084539-435133 | 263.6334 | 0.21 | |||||||
| 7 | BLAST J084540-430400 | 263.0150 | 0.15 | |||||||
| 8 | BLAST J084542-432721 | 263.3239 | 0.10 | |||||||
| 9 | BLAST J084546-432458 | 263.3005 | 0.12 | |||||||
| 10 | BLAST J084548-435334 | 263.6766 | 0.12 | |||||||
| 11 | BLAST J084548-430453 | 263.0429 | 0.20 | |||||||
| 12 | BLAST J084552-432152 | 263.2707 | 0.22 | |||||||
| 13 | BLAST J084606-433956 | 263.5331 | 0.20 | |||||||
| 14 | BLAST J084612-432337 | 263.3322 | 0.16 | |||||||
| 15 | BLAST J084617-424907 | 262.8924 | 0.19 | |||||||
| 16 | BLAST J084617-445843 | 264.5787 | 0.05 | |||||||
| 17 | BLAST J084620-443122 | 264.2282 | 0.18 | |||||||
| 18 | BLAST J084621-424758 | 262.8847 | 0.22 | |||||||
| 19 | BLAST J084625-424709 | 262.8819 | 0.19 | |||||||
| 20 | BLAST J084626-434227 | 263.6028 | 0.15 | |||||||
| 21 | BLAST J084626-424646 | 262.8789 | 0.05 | |||||||
| 22 | BLAST J084629-424612 | 262.8781 | 0.16 | |||||||
| 23 | BLAST J084633-432100 | 263.3370 | 0.22 | |||||||
| 24 | BLAST J084633-435432 | 263.7742 | 0.11 | |||||||
| 25 | BLAST J084635-424522 | 262.8779 | 0.13 | |||||||
| 26 | BLAST J084637-432245 | 263.3685 | 0.12 | |||||||
| 27 | BLAST J084639-424441 | 262.8768 | 0.06 | |||||||
| 28 | BLAST J084643-424400 | 262.8748 | 0.11 | |||||||
| 29 | BLAST J084647-424323 | 262.8747 | 0.20 | |||||||
| 30 | BLAST J084648-435257 | 263.7814 | 0.14 | |||||||
| 31 | BLAST J084654-431626 | 263.3177 | 0.14 | |||||||
| 32 | BLAST J084654-435253 | 263.7922 | 0.15 | |||||||
| 33 | BLAST J084710-432245 | 263.4313 | 0.14 | |||||||
| 34 | BLAST J084718-432804 | 263.5147 | 0.18 | |||||||
| 35 | BLAST J084724-434859 | 263.7982 | 0.05 | |||||||
| 36 | BLAST J084727-432807 | 263.5323 | 0.11 | |||||||
| 37 | BLAST J084728-432706 | 263.5208 | 0.08 | |||||||
| 38 | BLAST J084731-435344 | 263.8713 | 0.14 | |||||||
| 39 | BLAST J084734-432654 | 263.5293 | 0.14 | |||||||
| 40 | BLAST J084735-432829 | 263.5521 | 0.12 | |||||||
| 41 | BLAST J084736-434332 | 263.7488 | 0.17 | |||||||
| 42 | BLAST J084737-434828 | 263.8151 | 0.21 | |||||||
| 43 | BLAST J084738-434931 | 263.8305 | 0.28 | |||||||
| 44 | BLAST J084739-432623 | 263.5322 | 0.17 | |||||||
| 45 | BLAST J084742-434347 | 263.7637 | 0.12 | |||||||
| 46 | BLAST J084744-435120 | 263.8652 | 0.17 | |||||||
| 47 | BLAST J084744-435045 | 263.8591 | 0.16 | |||||||
| 48 | BLAST J084745-432637 | 263.5466 | 0.17 | |||||||
| 49 | BLAST J084746-432548 | 263.5387 | 0.09 | |||||||
| 50 | BLAST J084749-434810 | 263.8349 | 0.18 | |||||||
| 51 | BLAST J084751-432522 | 263.5417 | 0.11 | |||||||
| 52 | BLAST J084754-432748 | 263.5802 | 0.22 | |||||||
| 53 | BLAST J084759-433942 | 263.7428 | 0.24 | |||||||
| 54 | BLAST J084801-435108 | 263.8947 | 0.15 | |||||||
| 55 | BLAST J084803-433051 | 263.6369 | 0.15 | |||||||
| 56 | BLAST J084805-435415 | 263.9430 | 0.15 | |||||||
| 57 | BLAST J084813-423730 | 262.9644 | 0.11 | |||||||
| 58 | BLAST J084813-423405 | 262.9202 | 0.08 | |||||||
| 59 | BLAST J084815-434714 | 263.8713 | 0.10 | |||||||
| 60 | BLAST J084819-433247 | 263.6913 | 0.19 | |||||||
| 61 | BLAST J084820-433443 | 263.7178 | 0.17 | |||||||
| 62 | BLAST J084822-432504 | 263.5970 | 0.14 | |||||||
| 63 | BLAST J084822-433152 | 263.6856 | 0.20 | |||||||
| 64 | BLAST J084823-433536 | 263.7349 | 0.18 | |||||||
| 65 | BLAST J084823-433858 | 263.7799 | 0.11 | |||||||
| 66 | BLAST J084825-431714 | 263.5023 | 0.10 | |||||||
| 67 | BLAST J084829-433122 | 263.6922 | 0.12 | |||||||
| 68 | BLAST J084829-423553 | 262.9754 | 0.12 | |||||||
| 69 | BLAST J084832-425333 | 263.2092 | 0.11 | |||||||
| 70 | BLAST J084833-433056 | 263.6952 | 0.21 | |||||||
| 71 | BLAST J084834-435455 | 264.0059 | 0.13 | |||||||
| 72 | BLAST J084834-432430 | 263.6126 | 0.22 | |||||||
| 73 | BLAST J084834-424515 | 263.1062 | 0.13 | |||||||
| 74 | BLAST J084835-424801 | 263.1430 | 0.15 | |||||||
| 75 | BLAST J084837-431651 | 263.5195 | 0.20 | |||||||
| 76 | BLAST J084840-433153 | 263.7204 | 0.29 | |||||||
| 77 | BLAST J084842-431735 | 263.5392 | 0.15 | |||||||
| 78 | BLAST J084843-431618 | 263.5245 | 0.15 | |||||||
| 79 | BLAST J084844-433733 | 263.8007 | 0.17 | |||||||
| 80 | BLAST J084844-424455 | 263.1208 | 0.21 | |||||||
| 81 | BLAST J084847-425423 | 263.2482 | 0.08 | |||||||
| 82 | BLAST J084848-433225 | 263.7415 | 0.09 | |||||||
| 83 | BLAST J084852-433057 | 263.7300 | 0.14 | |||||||
| 84 | BLAST J084857-433818 | 263.8358 | 0.16 | |||||||
| 85 | BLAST J084859-431339 | 263.5209 | 0.18 | |||||||
| 86 | BLAST J084902-433802 | 263.8422 | 0.12 | |||||||
| 87 | BLAST J084906-432300 | 263.6548 | 0.18 | |||||||
| 88 | BLAST J084910-441636 | 264.3543 | 0.13 | |||||||
| 89 | BLAST J084912-431353 | 263.5480 | 0.13 | |||||||
| 90 | BLAST J084912-433618 | 263.8379 | 0.13 | |||||||
| 91 | BLAST J084920-440152 | 264.1834 | 0.12 | |||||||
| 92 | BLAST J084923-431312 | 263.5607 | 0.12 | |||||||
| 93 | BLAST J084925-431710 | 263.6165 | 0.10 | |||||||
| 94 | BLAST J084926-431220 | 263.5560 | 0.10 | |||||||
| 95 | BLAST J084928-440426 | 264.2312 | 0.14 | |||||||
| 96 | BLAST J084929-431128 | 263.5500 | 0.14 | |||||||
| 97 | BLAST J084932-441046 | 264.3206 | 0.18 | |||||||
| 98 | BLAST J084935-441147 | 264.3394 | 0.11 | |||||||
| 99 | BLAST J084936-431147 | 263.5680 | 0.13 | |||||||
| 100 | BLAST J084951-432235 | 263.7363 | 0.15 | |||||||
| 101 | BLAST J084952-433808 | 263.9381 | 0.17 | |||||||
| 102 | BLAST J084958-432253 | 263.7532 | 0.07 | |||||||
| 103 | BLAST J085007-431620 | 263.6862 | 0.15 | |||||||
| 104 | BLAST J085010-431704 | 263.7015 | 0.12 | |||||||
| 105 | BLAST J085010-442625 | 264.5952 | 0.10 | |||||||
| 106 | BLAST J085016-442535 | 264.5947 | 0.14 | |||||||
| 107 | BLAST J085017-442516 | 264.5923 | 0.05 | |||||||
| 108 | BLAST J085025-432244 | 263.8032 | 0.16 | |||||||
| 109 | BLAST J085033-433318 | 263.9551 | 0.13 | |||||||
| 110 | BLAST J085054-434234 | 264.1140 | 0.12 | |||||||
| 111 | BLAST J085123-425007 | 263.4955 | 0.11 | |||||||
| 112 | BLAST J085123-424607 | 263.4443 | 0.21 | |||||||
| 113 | BLAST J085127-433135 | 264.0353 | 0.19 | |||||||
| 114 | BLAST J085127-424914 | 263.4914 | 0.16 | |||||||
| 115 | BLAST J085135-430339 | 263.6928 | 0.18 | |||||||
| 116 | BLAST J085144-434939 | 264.3001 | 0.14 | |||||||
| 117 | BLAST J085147-424819 | 263.5191 | 0.17 | |||||||
| 118 | BLAST J085149-430532 | 263.7438 | 0.10 | |||||||
| 119 | BLAST J085152-430238 | 263.7119 | 0.21 | |||||||
| 120 | BLAST J085152-430353 | 263.7288 | 0.18 | |||||||
| 121 | BLAST J085153-424834 | 263.5339 | 0.22 | |||||||
| 122 | BLAST J085159-424907 | 263.5525 | 0.16 | |||||||
| 123 | BLAST J085232-430202 | 263.7824 | 0.18 | |||||||
| 124 | BLAST J085232-430717 | 263.8504 | 0.15 | |||||||
| 125 | BLAST J085234-430059 | 263.7726 | 0.22 | |||||||
| 126 | BLAST J085238-430516 | 263.8355 | 0.25 | |||||||
| 127 | BLAST J085239-430631 | 263.8547 | 0.23 | |||||||
| 128 | BLAST J085241-433657 | 264.2472 | 0.12 | |||||||
| 129 | BLAST J085241-431129 | 263.9212 | 0.17 | |||||||
| 130 | BLAST J085242-425655 | 263.7364 | 0.24 | |||||||
| 131 | BLAST J085243-425803 | 263.7540 | 0.17 | |||||||
| 132 | BLAST J085248-431010 | 263.9179 | 0.16 | |||||||
| 133 | BLAST J085254-430331 | 263.8454 | 0.19 | |||||||
| 134 | BLAST J085305-433329 | 264.2496 | 0.10 | |||||||
| 135 | BLAST J085310-430200 | 263.8564 | 0.11 | |||||||
| 136 | BLAST J085313-430120 | 263.8535 | 0.19 | |||||||
| 137 | BLAST J085318-430714 | 263.9382 | 0.20 | |||||||
| 138 | BLAST J085319-430047 | 263.8583 | 0.20 | |||||||
| 139 | BLAST J085320-430805 | 263.9541 | 0.17 | |||||||
| 140 | BLAST J085322-430704 | 263.9452 | 0.18 |
Note. — Flux densities for BLAST sources are quoted at precisely 250, 350, and 500 µm using SED fits to obtain color-corrections for the band-averaged flux densities (Chapin et al., 2008; Truch et al., 2008). The quoted statistical uncertainties are determined from Monte Carlo simulations and do not include calibration uncertainties (see §4). The deconvolved or intrinsic source FWHM is obtained from the of best-fit source size, , and the BLAST beam size, , as (Netterfield et al., 2009).
| Source # | Source name | |||||||||||
|---|---|---|---|---|---|---|---|---|---|---|---|---|
| (Jy) | (Jy) | (Jy) | (Jy) | (Jy) | ||||||||
| 0 | BLAST J084441-431144 | – | 0 | 0 | – | – | 0 | |||||
| 1 | BLAST J084508-433755 | 0 | 0 | 1 | 1 | 1 | 0 | |||||
| 2 | BLAST J084509-434544 | 0 | 0 | 0 | 0 | 0 | 0 | |||||
| 3 | BLAST J084531-435006 | 1 | 0 | 0 | 1 | 1 | 1 | |||||
| 4 | BLAST J084535-435156 | 1 | 0 | 2 | 1 | 2 | 0 | |||||
| 5 | BLAST J084538-435507 | 0 | 0 | 0 | 0 | 1 | 0 | |||||
| 6 | BLAST J084539-435133 | 1 | 0 | 0 | 1 | 0 | 1 | |||||
| 7 | BLAST J084540-430400 | – | 0 | 0 | – | – | 0 | |||||
| 8 | BLAST J084542-432721 | 0 | 0 | 1 | 0 | 0 | 0 | |||||
| 9 | BLAST J084546-432458 | 0 | 0 | 0 | 0 | 0 | 0 | |||||
| 10 | BLAST J084548-435334 | 0 | 0 | 0 | 0 | 1 | 0 | |||||
| 11 | BLAST J084548-430453 | – | 1 | 0 | – | – | 0 | |||||
| 12 | BLAST J084552-432152 | 0 | 0 | 0 | 0 | 0 | 0 | |||||
| 13 | BLAST J084606-433956 | 0 | 0 | 0 | 0 | 0 | 0 | |||||
| 14 | BLAST J084612-432337 | 0 | 0 | 0 | 0 | 1 | 0 | |||||
| 15 | BLAST J084617-424907 | – | 0 | 0 | – | – | 0 | |||||
| 16 | BLAST J084617-445843 | – | 1 | 1 | – | – | 0 | |||||
| 17 | BLAST J084620-443122 | – | 1 | 1 | – | – | 1 | |||||
| 18 | BLAST J084621-424758 | – | 0 | 0 | – | – | 0 | |||||
| 19 | BLAST J084625-424709 | – | 0 | 0 | – | – | 0 | |||||
| 20 | BLAST J084626-434227 | 1 | 1 | 1 | 2 | 4 | 0 | |||||
| 21 | BLAST J084626-424646 | – | 0 | 0 | – | – | 0 | |||||
| 22 | BLAST J084629-424612 | – | 1 | 1 | – | – | 0 | |||||
| 23 | BLAST J084633-432100 | 0 | 1 | 2 | 1 | 1 | 0 | |||||
| 24 | BLAST J084633-435432 | 1 | 1 | 1 | 1 | 1 | 1 | |||||
| 25 | BLAST J084635-424522 | – | 0 | 0 | – | – | 0 | |||||
| 26 | BLAST J084637-432245 | 0 | 0 | 0 | 0 | 1 | 0 | |||||
| 27 | BLAST J084639-424441 | – | 1 | 0 | – | – | 0 | |||||
| 28 | BLAST J084643-424400 | – | 0 | 0 | – | – | 0 | |||||
| 29 | BLAST J084647-424323 | – | 0 | 0 | – | – | 0 | |||||
| 30 | BLAST J084648-435257 | 1 | 0 | 0 | 0 | 2 | 0 | |||||
| 31 | BLAST J084654-431626 | 0 | 0 | 0 | 0 | 0 | 0 | |||||
| 32 | BLAST J084654-435253 | 1 | 0 | 0 | 0 | 2 | 0 | |||||
| 33 | BLAST J084710-432245 | 0 | 0 | 1 | 1 | 1 | 0 | |||||
| 34 | BLAST J084718-432804 | 0 | 0 | 0 | 0 | 0 | 0 | |||||
| 35 | BLAST J084724-434859 | 0 | 0 | 0 | 1 | 1 | 1 | |||||
| 36 | BLAST J084727-432807 | 0 | 0 | 0 | 0 | 0 | 0 | |||||
| 37 | BLAST J084728-432706 | 1 | 0 | 0 | 0 | 1 | 0 | |||||
| 38 | BLAST J084731-435344 | 0 | 0 | 0 | 1 | 1 | 0 | |||||
| 39 | BLAST J084734-432654 | 0 | 0 | 0 | 0 | 1 | 0 | |||||
| 40 | BLAST J084735-432829 | 0 | 0 | 0 | 0 | 0 | 0 | |||||
| 41 | BLAST J084736-434332 | 1 | 1 | 0 | 0 | 0 | 0 | |||||
| 42 | BLAST J084737-434828 | 0 | 0 | 0 | 0 | 0 | 0 | |||||
| 43 | BLAST J084738-434931 | 0 | 0 | 1 | 0 | 2 | 0 | |||||
| 44 | BLAST J084739-432623 | 1 | 0 | 0 | 0 | 2 | 0 | |||||
| 45 | BLAST J084742-434347 | 1 | 0 | 2 | 1 | 1 | 1 | |||||
| 46 | BLAST J084744-435120 | 0 | 0 | 0 | 0 | 0 | 0 | |||||
| 47 | BLAST J084744-435045 | 0 | 0 | 0 | 0 | 0 | 0 | |||||
| 48 | BLAST J084745-432637 | 0 | 0 | 0 | 0 | 1 | 0 | |||||
| 49 | BLAST J084746-432548 | 1 | 0 | 0 | 0 | 0 | 0 | |||||
| 50 | BLAST J084749-434810 | 0 | 0 | 0 | 0 | 0 | 0 | |||||
| 51 | BLAST J084751-432522 | 0 | 0 | 1 | 1 | 1 | 0 | |||||
| 52 | BLAST J084754-432748 | 0 | 0 | 1 | 0 | 1 | 0 | |||||
| 53 | BLAST J084759-433942 | 1 | 0 | 0 | 0 | 2 | 0 | |||||
| 54 | BLAST J084801-435108 | 0 | 0 | 0 | 0 | 1 | 0 | |||||
| 55 | BLAST J084803-433051 | 0 | 0 | 0 | 0 | 0 | 0 | |||||
| 56 | BLAST J084805-435415 | 0 | 1 | 0 | 0 | 0 | 0 | |||||
| 57 | BLAST J084813-423730 | – | 0 | 0 | – | – | 0 | |||||
| 58 | BLAST J084813-423405 | – | 0 | 1 | – | – | 0 | |||||
| 59 | BLAST J084815-434714 | 1 | 1 | 1 | 1 | 2 | 0 | |||||
| 60 | BLAST J084819-433247 | 0 | 0 | 0 | 0 | 2 | 0 | |||||
| 61 | BLAST J084820-433443 | 0 | 0 | 0 | 0 | 1 | 0 | |||||
| 62 | BLAST J084822-432504 | 0 | 0 | 0 | 0 | 0 | 0 | |||||
| 63 | BLAST J084822-433152 | 1 | 0 | 0 | 0 | 0 | 0 | |||||
| 64 | BLAST J084823-433536 | 0 | 0 | 1 | 0 | 0 | 0 | |||||
| 65 | BLAST J084823-433858 | 0 | 0 | 1 | 0 | 0 | 1 | |||||
| 66 | BLAST J084825-431714 | 0 | 0 | 0 | 1 | 1 | 0 | |||||
| 67 | BLAST J084829-433122 | 0 | 0 | 0 | 0 | 0 | 0 | |||||
| 68 | BLAST J084829-423553 | – | 1 | 1 | 1 | – | 1 | |||||
| 69 | BLAST J084832-425333 | – | 0 | 0 | 0 | 0 | 1 | |||||
| 70 | BLAST J084833-433056 | 2 | 0 | 1 | 1 | 2 | 1 | |||||
| 71 | BLAST J084834-435455 | 0 | 0 | 0 | 0 | 1 | 0 | |||||
| 72 | BLAST J084834-432430 | 0 | 0 | 0 | 0 | 0 | 0 | |||||
| 73 | BLAST J084834-424515 | – | 0 | 1 | 0 | – | 0 | |||||
| 74 | BLAST J084835-424801 | – | 0 | 0 | – | – | 0 | |||||
| 75 | BLAST J084837-431651 | 1 | 0 | 0 | 0 | 2 | 0 | |||||
| 76 | BLAST J084840-433153 | 2 | 0 | 0 | 1 | 4 | 0 | |||||
| 77 | BLAST J084842-431735 | 0 | 0 | 0 | 0 | 2 | 0 | |||||
| 78 | BLAST J084843-431618 | 0 | 0 | 0 | 1 | 1 | 0 | |||||
| 79 | BLAST J084844-433733 | 1 | 0 | 0 | 0 | 1 | 0 | |||||
| 80 | BLAST J084844-424455 | – | 0 | 0 | – | – | 0 | |||||
| 81 | BLAST J084847-425423 | – | 1 | 1 | 1 | 1 | 1 | |||||
| 82 | BLAST J084848-433225 | 1 | 1 | 1 | 1 | 1 | 1 | |||||
| 83 | BLAST J084852-433057 | 2 | 0 | 0 | 1 | 2 | 0 | |||||
| 84 | BLAST J084857-433818 | 1 | 0 | 0 | 1 | 1 | 0 | |||||
| 85 | BLAST J084859-431339 | 0 | 0 | 0 | 0 | 1 | 0 | |||||
| 86 | BLAST J084902-433802 | 1 | 1 | 1 | 0 | 0 | 1 | |||||
| 87 | BLAST J084906-432300 | 0 | 0 | 0 | 0 | 0 | 0 | |||||
| 88 | BLAST J084910-441636 | 0 | 0 | 2 | 1 | 0 | 0 | |||||
| 89 | BLAST J084912-431353 | 0 | 0 | 0 | 0 | 0 | 0 | |||||
| 90 | BLAST J084912-433618 | 1 | 1 | 1 | 1 | 1 | 0 | |||||
| 91 | BLAST J084920-440152 | 0 | 0 | 1 | 1 | 1 | 0 | |||||
| 92 | BLAST J084923-431312 | 1 | 0 | 0 | 0 | 1 | 0 | |||||
| 93 | BLAST J084925-431710 | 1 | 1 | 1 | 1 | 1 | 1 | |||||
| 94 | BLAST J084926-431220 | 2 | 0 | 0 | 0 | 1 | 0 | |||||
| 95 | BLAST J084928-440426 | 1 | 0 | 1 | 1 | 1 | 0 | |||||
| 96 | BLAST J084929-431128 | 0 | 0 | 0 | 0 | 0 | 0 | |||||
| 97 | BLAST J084932-441046 | 1 | 1 | 1 | 1 | 1 | 1 | |||||
| 98 | BLAST J084935-441147 | 1 | 0 | 0 | 1 | 1 | 0 | |||||
| 99 | BLAST J084936-431147 | 0 | 0 | 0 | 0 | 0 | 0 | |||||
| 100 | BLAST J084951-432235 | 0 | 0 | 0 | 0 | 3 | 0 | |||||
| 101 | BLAST J084952-433808 | 0 | 0 | 1 | 0 | 0 | 0 | |||||
| 102 | BLAST J084958-432253 | 1 | 0 | 1 | 1 | 2 | 0 | |||||
| 103 | BLAST J085007-431620 | 1 | 0 | 1 | 0 | 1 | 1 | |||||
| 104 | BLAST J085010-431704 | 1 | 0 | 0 | 0 | 1 | 0 | |||||
| 105 | BLAST J085010-442625 | – | 0 | 0 | – | – | 0 | |||||
| 106 | BLAST J085016-442535 | – | 1 | 1 | – | – | 0 | |||||
| 107 | BLAST J085017-442516 | – | 0 | 0 | – | – | 0 | |||||
| 108 | BLAST J085025-432244 | 0 | 0 | 0 | 0 | 0 | 0 | |||||
| 109 | BLAST J085033-433318 | 0 | 0 | 1 | 0 | 0 | 0 | |||||
| 110 | BLAST J085054-434234 | – | 0 | 0 | 0 | 1 | 0 | |||||
| 111 | BLAST J085123-425007 | – | 1 | 1 | – | – | 1 | |||||
| 112 | BLAST J085123-424607 | – | 0 | 0 | – | – | 0 | |||||
| 113 | BLAST J085127-433135 | – | 1 | 1 | 1 | 1 | 1 | |||||
| 114 | BLAST J085127-424914 | – | 1 | 0 | – | – | 0 | |||||
| 115 | BLAST J085135-430339 | – | 0 | 0 | 0 | – | 0 | |||||
| 116 | BLAST J085144-434939 | – | 0 | 0 | – | – | 0 | |||||
| 117 | BLAST J085147-424819 | – | 0 | 0 | – | – | 0 | |||||
| 118 | BLAST J085149-430532 | – | 1 | 1 | 1 | – | 1 | |||||
| 119 | BLAST J085152-430238 | – | 0 | 0 | – | – | 0 | |||||
| 120 | BLAST J085152-430353 | – | 0 | 0 | – | – | 0 | |||||
| 121 | BLAST J085153-424834 | – | 1 | 1 | – | – | 1 | |||||
| 122 | BLAST J085159-424907 | – | 0 | 0 | – | – | 0 | |||||
| 123 | BLAST J085232-430202 | – | 0 | 0 | – | – | 0 | |||||
| 124 | BLAST J085232-430717 | – | 1 | 1 | – | – | 0 | |||||
| 125 | BLAST J085234-430059 | – | 0 | 0 | – | – | 0 | |||||
| 126 | BLAST J085238-430516 | – | 0 | 0 | – | – | 0 | |||||
| 127 | BLAST J085239-430631 | – | 0 | 0 | – | – | 0 | |||||
| 128 | BLAST J085241-433657 | – | 1 | 1 | – | – | 1 | |||||
| 129 | BLAST J085241-431129 | – | 0 | 1 | 0 | – | 0 | |||||
| 130 | BLAST J085242-425655 | – | 0 | 0 | – | – | 0 | |||||
| 131 | BLAST J085243-425803 | – | 0 | 0 | – | – | 0 | |||||
| 132 | BLAST J085248-431010 | – | 0 | 0 | – | – | 0 | |||||
| 133 | BLAST J085254-430331 | – | 0 | 0 | – | – | 0 | |||||
| 134 | BLAST J085305-433329 | – | 0 | 1 | – | – | 0 | |||||
| 135 | BLAST J085310-430200 | – | 0 | 0 | – | – | 0 | |||||
| 136 | BLAST J085313-430120 | – | 0 | 0 | – | – | 0 | |||||
| 137 | BLAST J085318-430714 | – | 0 | 0 | – | – | 0 | |||||
| 138 | BLAST J085319-430047 | – | 0 | 0 | – | – | 0 | |||||
| 139 | BLAST J085320-430805 | – | 0 | 1 | – | – | 0 | |||||
| 140 | BLAST J085322-430704 | – | 0 | 0 | – | – | 0 |
Note. — Flux density () and number () of sources associated with BLAST objects for each catalog considered: SIMBA, IRAS, Akari, MIPS70, MIPS24 and MSX. Fluxes are catalog fluxes, unless noted otherwise. When , but the flux density is not zero, then an upper limit to the flux is listed, either estimated by aperture photometry (indicated by “a”) or by determining the noise in the map. The search radius is a variable function of both BLAST and IRAS positional uncertainties (see §3.1).