The Hot and Clumpy Molecular Cocoon Surrounding the Ultracompact H II Region G5.890.39
Abstract
We present observations of CH3CN (1211) emission at a resolution of 2″ toward the shell-like ultracompact H II region G5.890.39 with the Submillimeter Array. The integrated CH3CN emission reveals dense and hot molecular cocoon in the periphery of the H II region G5.890.39, with a CH3CN deficient region roughly centered at G5.890.39. By analyzing the CH3CN emission using population diagram analysis, we find, for the first time, a decreasing temperature structure from 150 to 40 K with the projected distance from Feldt’s star, which is thought to be responsible for powering the H II region. Our results further indicate that the majority of the heating energy in the observed dense gas is supplied by the Feldt’s star. From the derived CH3CN column density profile, we conclude that the dense gas is not uniformly-distributed but centrally-concentrated, with a power-law exponent of 5.5 for r 8000 AU, and 2.0 for 8000 AU r 20000 AU, where r is the distance to Feldt’s star. The estimated large power index of 5.5 can be attributed to an enhancement of CH3CN abundance in the close vicinity of Feldt’s star.
1 Introduction
G5.890.39 (hereafter G5.89, also known as W28 A2) is a shell-like ultracompact (UC) H II region with an angular diameter of 4″, presumably powered by a young O-type star (Wood & Churchwell, 1989). Recently, near-IR observations reported a candidate for powering the UC H II region, an O5-V type star (Feldt et al., 2003, hereafter Feldt’s star), although there is a positional offset of 1″ between the H II region center and the near-IR source. The off-center location probably results from the migration of Feldt’s star (Feldt et al., 2003). The estimated distance to G5.89 varies from 1.9 kpc to 3.8 kpc (Hunter et al., 2008, and references therein). In this letter, we adopt a distance of 2 kpc, which is favored by most recent studies (e.g., Watson et al., 2007; Hunter et al., 2008). Several signposts of high-mass star formation such as energetic outflows (e.g., Sollins et al., 2004; Watson et al., 2007; Hunter et al., 2008) and maser activities (Fish et al., 2005; Kurtz et al., 2004) have been reported toward this region. The orientation of the reported outflows in various tracers is notably different, indicating the existence of multiple young stellar objects in this region (Hunter et al., 2008, and reference therein). Indeed, subarcsecond sub-millimeter observations have identified at least five dust condensations (denoted as SMA1, SMA2, SMA-N, SMA-E and SMA-S) (Hunter et al., 2008). With the existence of a young O-type star still embedded in its natal cloud core, G5.89 provides an ideal laboratory for studying the physical and chemical conditions of molecular gas surrounding a newly formed massive star.
In this letter, we present methyl cyanide (CH3CN) observations of G5.89 at an angular resolution of 2″ with the Submillimeter Array111The Submillimeter Array is a joint project between the Smithsonian Astrophysical Observatory and the Academia Sinica Institute of Astronomy and Astrophysics, and is funded by the Smithsonian Institution and the Academia Sinica. (SMA). As CH3CN is a symmetric-top molecule, its K-ladder components between adjacent J levels are closely spaced in frequency while dramatically different in excitation energies. Therefore, an excitation analysis of the CH3CN K-ladder transitions provides an ideal tool for probing (rotational) temperature of dense molecular gas with small calibration uncertainties (Cummins et al., 1983). Since radiative transitions are not allowed across K-ladders, the derived rotational temperature is close to the kinetic temperature if the gas is thermalized. Using population diagram (PD) analysis (Goldsmith & Langer, 1999), we derive the distribution of the temperatures as well as the filling factor and column density of CH3CN gas toward G5.89. We then discuss the implications of the observed temperature, filling factor and CH3CN column density structures and evaluate the density profile in this region. A possible variation of CH3CN fractional abundance is also illustrated.
2 Observations and Data Reduction
The observations of CH3CN (1211) in the band of 220 GHz were carried out with the SMA on 2008 April 17 and May 2. With seven antennas in the array, the projected baselines ranged from about 9 m to 120 m (7 to 90 k). The phase center was R.A. = 18h00m30.32s (J2000) and decl. = 24°04′00.50 (J2000), and the half-power width of the SMA primary beam was 54. The spectral resolution was 0.41 MHz, corresponding to a velocity resolution of 0.55 km s-1. The total available double-sideband bandwidth was 4 GHz. See Ho, Moran, & Lo (2004) for more complete specifications of the SMA. The flux calibrators were Uranus (Apr 17) and Titan (May 2), and the bandpass calibrators were 3C273 (Apr 17 and May 2) and 3C454.3 (Apr 17). The nearby compact radio sources 1733130 (S 2.8 Jy in both Apr 17 and May 2) and 1924292 (S 4.4 Jy in Apr 17 and 4.7 Jy in May 2) served as complex gain calibrators. We calibrated the data using the MIR software package and made maps using the MIRIAD package. With uniform weighting, the synthesized beam size was about 3.1 1.8 at P.A. of 55.0∘. The rms noise level in a single channel of the spectral line images was 130 mJy beam-1 (equivalently 0.6 K).
3 The Spectra and Morphology of the CH3CN Emission
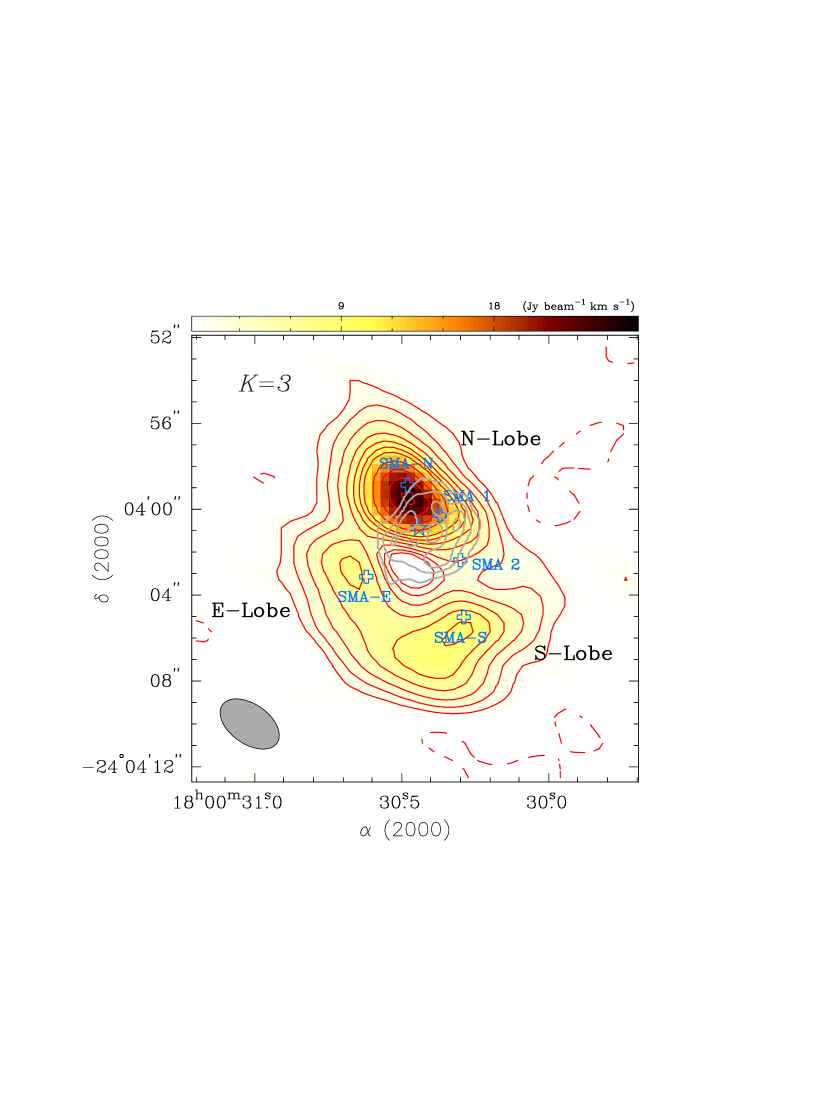
Figure 1 shows the integrated K = 3 component of the CH3CN (1211) transition. Figure 2 shows the CH3CN (1211) spectra toward the five sub-mm dust components identified by Hunter et al. (2008) as well as toward Feldt’s star. The K components of the CH3CN (1211) transition are detected toward G5.89 up to K = 7 with an excitation energy of 420 K. Comparing the integrated CH3CN flux measured from our SMA observations with the single-dish results (e.g., Pankonin et al., 2001), we estimate that approximately 80% of the CH3CN emission is recovered by the SMA observations.
The morphologies of the lower K (i.e., K = 0, 1, and 2) components are similar to that of the K = 3 component shown in Figure 1. A cavity roughly centered at the UC H II region can be discerned. This cavity is spatially coincident with the dust-deficient region reported by Hunter et al. (2008), indicating a deficiency of both molecules and dust grains. With a synthesized beam of 3.1 1.8, the molecular cocoon seen in the K = 3 component is resolved into at least three peaks, here referred to as N-lobe, E-lobe, and S-lobe, whose locations agree with the sub-mm dust condensations SMA-N, SMA-E, and SMA-S, respectively, as shown in Figure 1. The higher K (i.e., K = 5, 6, and 7) components are mainly concentrated in N-lobe (i.e., the vicinity of SMA-N as well as SMA1) and become much weaker or even undetected toward E-lobe and S-lobe.
4 Excitation Analysis of the CH3CN Gas
4.1 Methodology
Given the fairly strong detection of CH3CN transitions toward G5.89, estimates of gas temperature as a function of position are feasible. We first performed Gaussian line-profile fitting to estimate line parameters, including radial velocity, line-width, and integrated intensity, of each K component at each pixel. By assuming observed transitions to be optically thin and in LTE, we then calculated N, the CH3CN column density of the upper level of the transition, from the integrated intensities. For details, see equation (1) in Thompson & MacDonald (1999). Since the inferred gas density of 106 cm-3 (see §5) is at least a factor of 10 higher than the critical density at the derived gas temperature (Chen et al., 2006), the LTE approximation should be valid.
In the G5.89 region the lower K components of the CH3CN (1211) emission are apparently optically thick, as shown in Figure 2. Under such conditions, a good estimation of gas rotational temperature is not achievable by using the well-known rotation diagram technique (Hollis, 1982; Turner, 1991). To remedy this situation, we estimate the gas temperature with the PD analysis instead. The difference between the PD analysis and the rotational diagram analysis is that the former includes two additional correction factors, i.e., the optical depth correction factor Cτ (= /(1e-τ)) and the filling factor f (=/), where is the line opacity, is the source solid angle, and is the beam solid angle. Under LTE conditions, the rotational temperatures as well as the filling factors and column densities of CH3CN can be determined from the following equation in PD analysis:
| (1) |
where is the expected upper-state column density of the target molecule incorporating the effects of the line opacity (Cτ) and the beam dilution (f); g is the degeneracy of upper state; N is the total column density of the molecule; Q(T) is the dimensionless rotational partition function; T is the rotational temperature; and E is the upper energy level.
According to equation (1), for a given upper level, can be evaluated from a set of N, T, f, and Cτ. Since Cτ is actually a function of N and T, the independent parameters are therefore N, T, and f only. We calculated for the parameter space of T = 10300 K, N in the range of 10131018 cm-2, and f between 0.01 and 1.0. By comparing with N deduced from observational results, we performed minimization
| (2) |
to determine for each pixel the physical properties, i.e., T, N, and f, from the selected parameter space. is the 1- error of N. See Wang et al. (2009) for a detailed description of the analysis method.
4.2 Temperature & Illumination of Molecular Gas
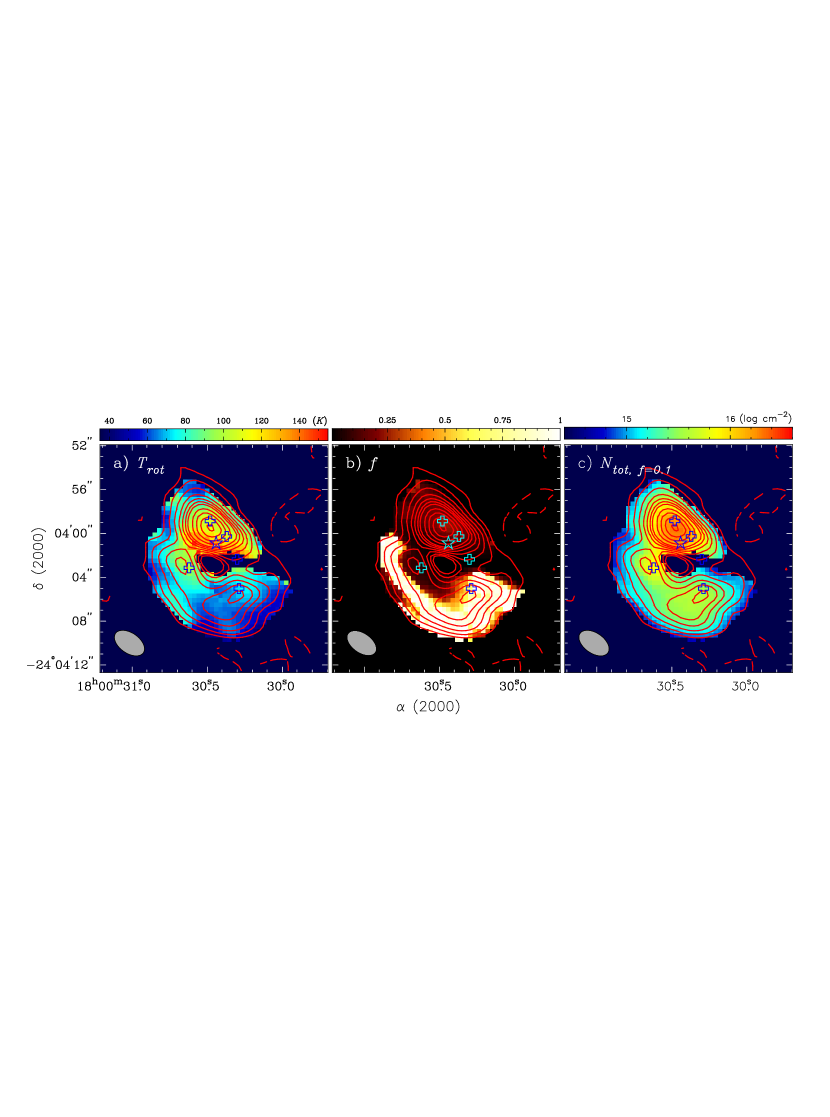
As shown in Figure 3a, we have for the first time resolved the temperature structure of the neutral dense gas in this region with the PD analysis. The inferred CH3CN gas temperatures range from 40 K to 150 K, in agreement with the single-dish results of 5675 K (Thompson & MacDonald, 1999; Pankonin et al., 2001; Purcell et al., 2006). Among the three CH3CN lobes, N-lobe is the hottest, E-lobe next, and S-lobe is the coldest. In particular, the CH3CN gas in the close vicinity of Feldt’s star has the highest temperature within the whole region.
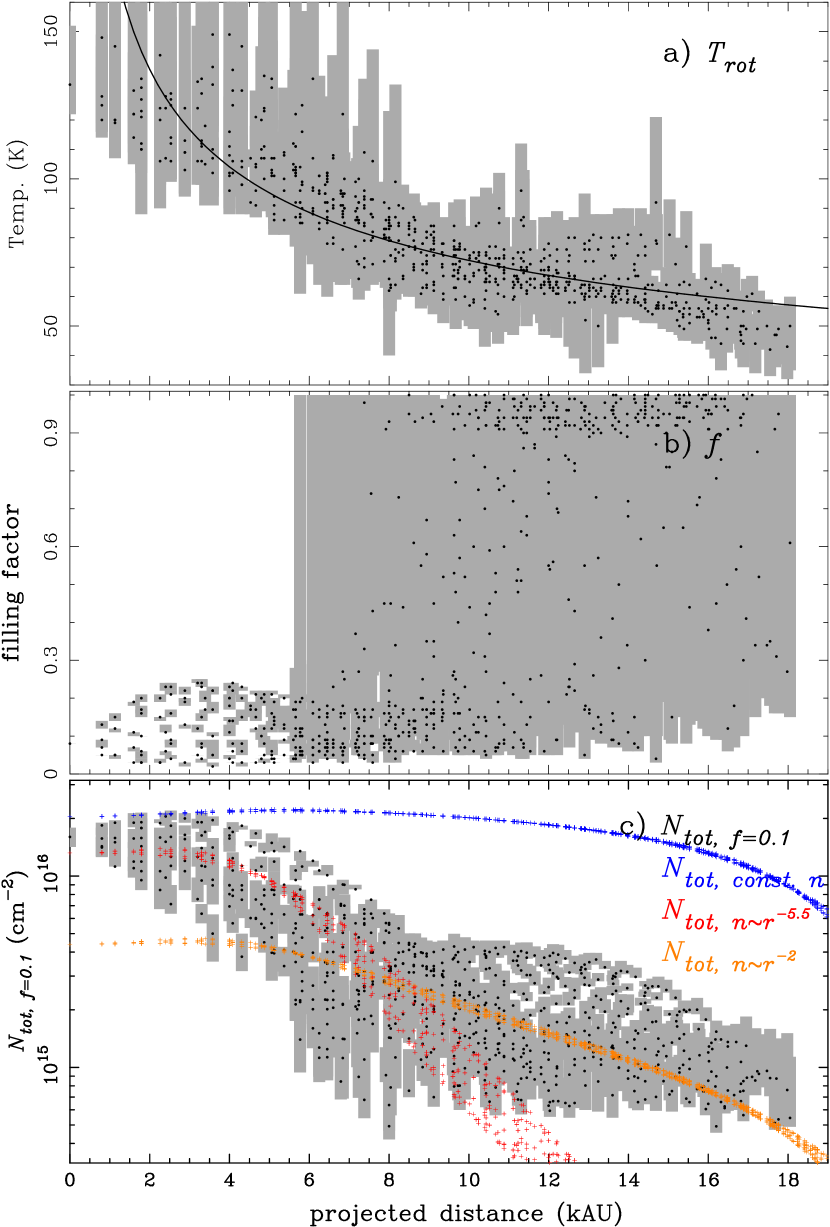
To further explore the role of Feldt’s star in illuminating its surrounding gas, we plot the deduced gas temperature T versus the projected distance, d, to Feldt’s star. Indeed, a good correlation between the temperature and the projected distance is revealed in Figure 4a. In contrast, the correlation between T and d becomes much more vague when the fiducial center is shifted about 2 in any direction away from Feldt’s star. Together with the sufficient luminosity budget of the O5-type Feldt’s star and the non-detection of other candidate H II region powering stars within 2 from Feldt’s star, we conclude that the majority of the energy for heating the dense gas enshrouding the UC H II region G5.89 comes from Feldt’s star.
A power-law fit to the data indicates that the gas temperature scales as T d-0.40. Note that the deduced temperature T(d) is actually a representative or averaged temperature for the gas along the line of sight. We suggest, however, that with a highly centrally-concentrated density distribution as shown in §5, the deduced temperature at small d is heavily weighted by high density, hence this represents the gas temperature at small r, where r is the distance to Feldt’s star. Therefore the temperature profile T(d) can be viewed as T(r). The temperature profile of T r-0.40 is shallower than the profile of T r-3/4 measured toward hot-molecular core sources (e.g., Cesaroni et al., 1998; Beltrán et al., 2005). This disparity can be attributed to different dust grain properties and/or variant evolutionary stages. The temperature structure provides clues for the dust opacity index . Theoretical models found that, for example, the temperature structure of uniform dust shells surrounding a newly formed O star can be described by Tdust r-α, where 2/(+4) (Wolfire & Churchwell, 1994). Modifications of the models with a centrally-concentrated density profile, however, are required to match the case of G5.89.
4.3 Filling Factors & Column Density Profiles
Figures 3b and 3c show the derived filling factor and CH3CN column density, respectively. The CH3CN column density plotted in Figure 3c, N, is the CH3CN column density scaled by a filling factor of 0.1 (see below). Figure 4b shows the derived filling factor versus the projected distance to Feldt’s star, and it clearly demonstrates that the molecular gas in the close vicinity of Feldt’s star (i.e., d 6000 AU, mainly associated with N-lobe) has small filling factors ranging from 0.02 to 0.24, suggestive of a clumpy medium. The small filling factors can also be readily recognized from the low brightness temperatures (20 K) of the hot (100150 K) but optically thick low-K components. For the gas further out, the filling factors become noticeably scattered with not only large values of 0.81 for the majority but also large uncertainties. Nevertheless, such large uncertainties in fact imply all the observed transitions to be optically thin. In such case, the filling factor, f, and the total column density, N, become degenerate in the calculation and hence cannot be well determined.
In short, the CH3CN gas toward G5.89 can be coherently considered as clumpy, with f 0.1.0.2. As shown in Figure 4c, we thus plot the CH3CN column density scaled by a filling factor of 0.1, N, versus the projected distance to Feldt’s star. Obviously N decreases with increasing projected distance d, and the ratio between the inner (d 4000 AU) and outer (d 18000 AU) region is more than a factor of 10. Note that if N instead of N is plotted, this ratio will be even larger because the inferred f is larger for gas further out.
5 Density Structure
The deduced CH3CN column density profile reflects the density structure of the molecular gas. For simplicity, we assume a spherical cloud core with a power-law density profile, n(r) r-p, and a constant CH3CN fractional abundance X(CH3CN) of 1 10-9, similar to that found in other massive star forming regions (Wilner et al., 1994; Zhang et al., 1998). We further adopt inner and outer boundaries at 4000 and 20000 AU, respectively, based on the size of the UC H II region and the CH3CN emission. We then convolve the column density with a two-dimensional Gaussian beam of 3.1 1.8, equivalent to our SMA beam. As shown in Figure 4c, we examine three model column density profiles calculated with power-law indices p of 0, 2, and 5.5. The adopted values for density at the inner edge are 3.5107, 3.5107, and 3.5108 cm-3, respectively. Obviously, the modeled column density profile of p=0 (i.e., constant density) is too flat to agree with the observational results (i.e., N profile). Since the N profile would be even steeper than N, the discrepancy between the profiles of observations and constant density can not be attributed to the adopted constant filling factor of 0.1. The observed N profile can be well represented by the results modeled from a broken power law density distribution, with p = 5.5 for r 8000 AU and p = 2.0 for 8000 AU r 20000 AU. Note that for the p = 2 profile, the gas density at r = 20000 AU is 1.4 106 cm-3, more than sufficient to thermalize the observed CH3CN transitions. We therefore conclude that a centrally-concentrated density distribution is required to interpret the observational column density profile.
Observations of massive star-forming cores indicated that the density power-law indices range from 1 to 2, while theoretical models also predicted similar power-law indices (e.g., Mueller et al., 2002, and reference therein). The density profile of n r-5.5 is significantly steeper than typical cases. Feedback processes such as the expansion of the H II region may play a role to steepen the density profile. Since the observed CH3CN column density depends on the gas density and CH3CN abundance, X(CH3CN), the steep CH3CN column density profile may also be a result of an enhancement of CH3CN gas due to the evaporation of grain mantles in the inner region, similar to the cases of abundance jump reported by van der Tak et al. (2000).
Finally, we note that the temperatures as well as column densities are estimated simultaneously under the assumption of one isothermal gas component along the line of sight. While the deduced temperature and density structures are in fact not uniform, they form a self-consistent set of solutions. That is, the highly centrally-concentrated CH3CN density profile supports the temperature profile, which in term validates the density profile itself. The derived “projected” profile therefore reflects the actual radial-dependent structure. More rigorous radiative transfer calculation that can account for all the involved parameters such as temperature, density, filling factors, and abundance, as well as observations with even higher angular resolutions will be desired to further refine the results.
References
- Beltrán et al. (2005) Beltrán, M. T., et al. 2005, A&A, 435, 901
- Cesaroni et al. (1998) Cesaroni, R., et al. 1998, A&A, 331, 709
- Chen et al. (2006) Chen, H.-R., et al. 2006, ApJ, 639, 975
- Cummins et al. (1983) Cummins, S. E., et al. 1983, ApJ, 266, 331
- Feldt et al. (2003) Feldt, M., et al. 2003, ApJ, 599, L91
- Fish et al. (2005) Fish, V. L., et al. 2005, ApJS, 160, 220
- Goldsmith & Langer (1999) Goldsmith, P. F., & Langer, W. D. 1999, ApJ, 517, 209
- Ho, Moran, & Lo (2004) Ho, P. T. P., Moran, J., & Lo, K. Y. 2004, ApJ, 616, L1
- Hollis (1982) Hollis J. M., 1982, ApJ, 260, 159
- Hunter et al. (2008) Hunter, T. R., et al. 2008, ApJ, 680, 1271
- Kurtz et al. (2004) Kurtz, S., Hofner, P., & Álvarez, C. V. 2004, ApJS, 155, 149
- Mueller et al. (2002) Mueller, K. E., et al. 2002, ApJS, 143, 469
- Pankonin et al. (2001) Pankonin, V., et al. 2001, ApJ, 558, 194
- Purcell et al. (2006) Purcell, C. R., et al. 2006, MNRAS, 367, 553
- Scoville & Kwan (1976) Scoville, N. Z., & Kwan, J. 1976, ApJ, 206, 718
- Sollins et al. (2004) Sollins, P. K., et al. 2004, ApJ, 616, L35
- Tang et al. (2009) Tang, Y.-W., et al. 2009, ApJ, 695, 1399
- Thompson & MacDonald (1999) Thompson, M. A., & MacDonald, G. H. 1999, A&AS, 135, 531
- Turner (1991) Turner B. E., 1991, ApJS, 76, 617
- Wang et al. (2009) Wang, K.-S., et al. 2009, ApJ, submitted.
- Watson et al. (2007) Watson, C., et al. 2007, ApJ, 657, 318
- Wilner et al. (1994) Wilner, D. J., et al. 1994, ApJ, 422, 642
- Wolfire & Churchwell (1994) Wolfire, M. G., & Churchwell, E. 1994, ApJ, 427, 889
- Wood & Churchwell (1989) Wood, D. O. S., & Churchwell, E. 1989, ApJS, 69, 831
- van der Tak et al. (2000) van der Tak, F. F. S., et al. 2000, A&A, 361, 327
- Zhang et al. (1998) Zhang, Q., et al. 1998, ApJ, 494, 636