Observation of an energetic radiation burst from mountain-top thunderclouds
Abstract
During thunderstorms on 2008 September 20, a simultaneous detection of rays and electrons was made at a mountain observatory in Japan located 2770 m above sea level. Both emissions, lasting 90 seconds, were associated with thunderclouds rather than lightning. The photon spectrum, extending to 10 MeV, can be interpreted as consisting of bremsstrahlung rays arriving from a source which is m in distance at 90% confidence level. The observed electrons are likely to be dominated by a primary population escaping from an acceleration region in the clouds.
pacs:
82.33.Xj, 92.60.Pw, 93.85.-qI Introduction
Energetic radiation bursts from thunderstorm activity have been observed by space observatories as well as ground-based detectors. Interestingly, these bursts appear to be classified into two types according to their duration. One comprises short bursts lasting for milli-seconds or less, mainly observed from the upper atmosphere of the Earth Fishman et al. (1994); Smith et al. (2005), natural lightning discharges Moore et al. (2001); Dwyer et al. (2005), and rocket-triggered ones Dwyer et al. (2003, 2004a, 2004b). Though not necessary homogeneous, they generally occur in association with lightning discharges. The other consists of long bursts with duration of a few seconds to a few minutes, mostly detected at aircraft altitudes McCarthy and Parks (1985); Each et al. (1996), at high mountains Suszcynsky et al. (1996); Brunetti et al. (2000); Chubenko et al. (2000); Alexeenko et al. (2000); Muraki et al. (2004), and around the coastal area of Japan Sea Torii et al. (2002); Tsuchiya et al. (2007). Unlike the short bursts, few of them appear to be clearly associated with lightning discharges.
To date, at least some of these radiation bursts are thought to result from relativistic electrons, which are produced in turn by a mechanism involving runaway and avalanches of electrons in the atmosphere. The mechanism, first proposed by Gurevich et al. (1992), needs intense electric fields, high-energy seed electrons, and spatial length long enough for the avalanches to develop. When these conditions are fulfilled, the electrons can gain energy from the electric fields fast enough to exceed their ionization loss. Then, they will be accelerated to relativistic energies, and produce bremsstrahlung rays.
Actually, -ray spectra extending to 10 MeV have been observed from both short and long bursts Dwyer et al. (2004b); Smith et al. (2005); Tsuchiya et al. (2007), with their properties generally consistent with the bremsstrahlung emission scenario. However, according to Monte Carlo simulations considering a feedback mechanism in which back-scattered photons and/or positrons successively supply seed electrons in the high-electric-field region, electron avalanches are likely to last only for microseconds Dwyer_MC2003 ; Babich_MC ; Dwyer_MC2007 . Observationally, only a few examples of long bursts have so far been reported to extend to MeV energies. Therefore, it is not yet clear whether the runaway electron avalanche scenario, which is generally successful on some short bursts Smith et al. (2005); Dwyer et al. (2004b), can also explain the prolonged events. Furthermore, we need to explain the fact that some long bursts consist solely of x/ rays McCarthy and Parks (1985); Each et al. (1996); Suszcynsky et al. (1996); Brunetti et al. (2000); Chubenko et al. (2000); Torii et al. (2002); Tsuchiya et al. (2007), while others involve only charged particles Alexeenko et al. (2000); Muraki et al. (2004). Here, utilizing a detector that is capable of separating photons from charged particles, we first report on a simultaneous detection of rays and electrons in one long burst, with the photon spectrum extending to 10 MeV.
II Experiment
The Norikura cosmic-ray observatory (N, E), belonging to the Institute for Cosmic Ray Research, the University of Tokyo, is located on a high mountain in Gifu prefecture, Japan. Due to its high altitude, 2770 m above sea level, as well as meteorological conditions from summer to autumn, the observatory is frequently shrouded in thunderclouds.
Outside the observatory, we installed a radiation detection system on 2008 September 4, and operated it until 2008 October 2. The system consists of a spherical NaI scintillator with a diameter of 7.62 cm, and a plastic scintillator which is enclosed in an aluminum box with the top and bottom being 1 mm and 3 mm thick, respectively. Each scintillator has a photomultiplier (HAMAMATSU R878) of its own, and each output signal is fed to a self-triggering electronics system, incorporating a 12 bit analog-to-digital converter (ADC). The detected events are collected in the order of arrival without individual arrival-time information, and recorded every 1 sec synchronized by Global Positioning System. Thus, both scintillators have a time resolution of 1 sec. The NaI scintillator was operated over keV MeV, while the plastic scintillator, placed above it, was operated with a threshold energy deposit of 500 keV.
The plastic scintillator has a high sensitivity for charged particles while it is much less sensitive to photons. Therefore, when the NaI detector is triggered by an incident particle without a coincident (within 0.7 sec) signal in the plastic scintillator, the incident particle would be a photon, not a charged particle. Thus, the plastic signals mainly represent incoming charged particles including electrons, and using them in anti-coincidence, the NaI signals can be considered to indicate rays with little ( 0.1%) contamination by electrons.
Aiming at an independent radiation observation, we installed, inside the observatory, another inorganic scintillation detector. This indoor detector uses a cubic bismuth germanate (BGO) scintillator of 5 5 15 , which is coupled to a photomultiplier (HAMAMATSU R7600U-203), and observes in the 100 keV 5 MeV range. The signal is pulse-height analyzed by a self-triggering 8 bit ADC, and the pulse height is recorded, on event-by-event basis, with arrival-time information of 20 ms resolution.
In addition to the radiation observations, we measure optical and electric field variations outside the observatory. The visible-light intensity is measured by an optical sensor using a photodiode (HAMAMATSU S1226-8BK) having a sensitivity to photons with wavelength of 320 1000 nm, with its peak at 750 nm. Output signals of this optical sensor are fed to a 12 bit ADC every 1 sec, and recorded as voltages between 0 and +10 V with a resolution of 5 mV. The electric field is measured by a commercial electric field mill (BOLTEK EFM-100). Its outputs are also collected by a 12 bit ADC every 1 sec, and converted to the electric field strength between 100 with a resolution of 50 .
III Results
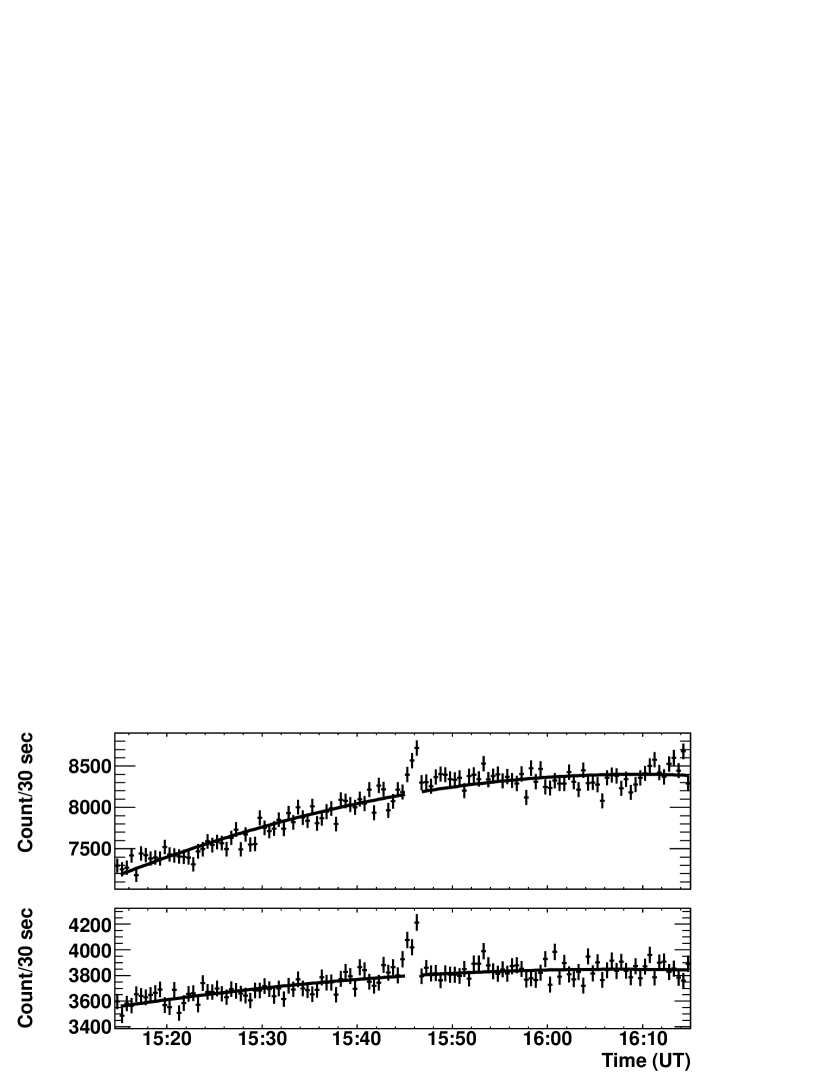
Examining the data over a period of September 4 to October 2, we found a long-duration enhancement during thunderstorms on September 20, but found no other events of similar properties. Figure 1 shows count histories of 10 keV NaI and 500 keV plastic scintillators, between 15:15 and 16:15 UT on September 20. Besides gradual count-rate changes mainly due to Radon rain-outs, both scintillators detected a significant count enhancement, or a burst, over a 90 sec interval of 15:45:10 15:46:40 UT. Excluding the data obtained in this interval and applying a quadratic least square fitting to the remaining data, we estimated background (solid curves in Fig. 1) in the two scintillators. Subtracting the interpolated background from the total observed counts in the 90 sec period and calculating the background errors using the derived quadratic function and the number of bins used in the fit procedure, 117, both NaI and plastic scintillators gave highly significant increases of and , respectively.
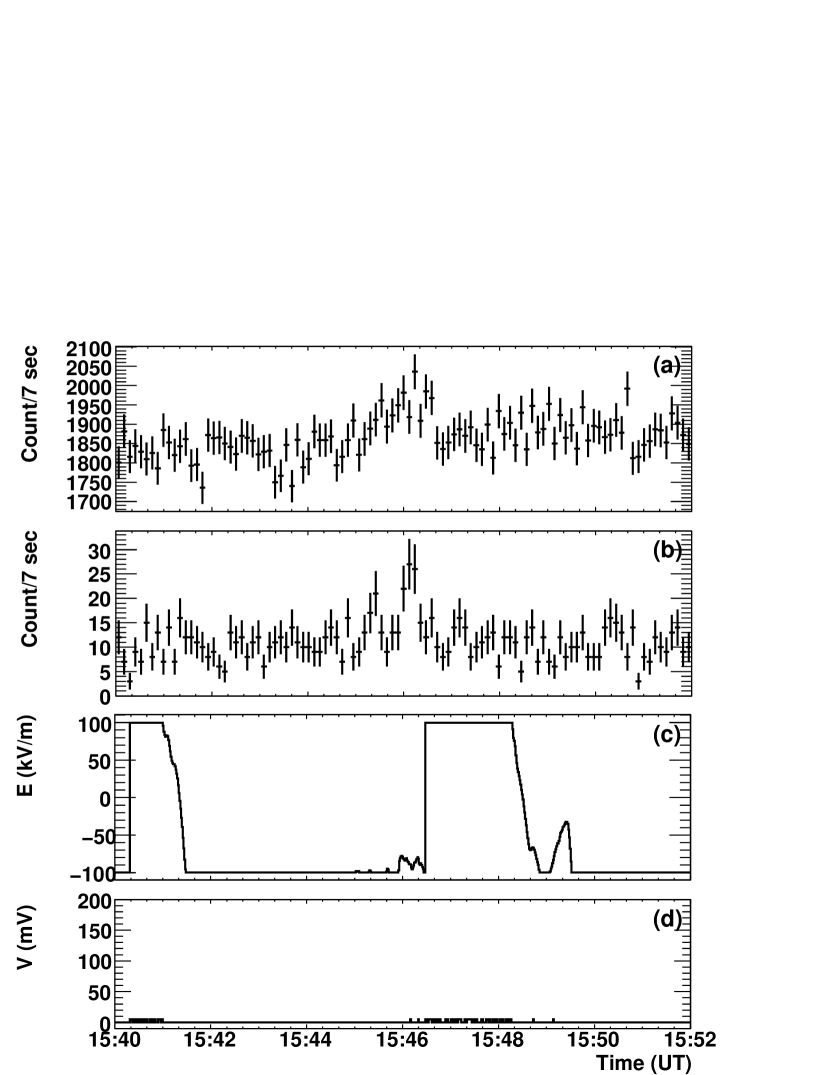
Figure 2 gives details of the count histories of the NaI scintillator, together with outputs of the electric field and light sensors. Since the plastic scintillator signals are used here in anticoincidence, the NaI events are thought to represent energetic photons. The excess counts in the MeV and MeV bands [Fig. 2(a) and (b)] become and , respectively, while those without anticoincidece in the two energy bands are and , respectively. Since the excess counts with and without the anticoincidence thus statistically agree, we infer that the NaI signals were dominated by photons, not charged particles.
On this occasion, the indoor BGO detector also showed a moderate increase in 2.6 MeV energies, with a significance when summed over a 15 sec interval. The absolute time of this increase is consistent with that in the outdoor detector, within a relatively large uncertainty of 3 min with which the clock of the data-taking computer of the indoor detector was adjusted. Supposing that the outdoor and indoor detectors observed the same event, the lower significance in the latter, compared to the former, suggests that the burst source was located outside the building, and the radiation was attenuated by the roofs and/or walls.
Due to a limited dynamic range of the electric field mill, the electric field [Fig. 2(c)] was saturated at at 15:45:10 UT (burst onset), and kept negative polarity until 15:46:29 UT. At that time, the electric field rapidly changed its polarity from negative to positive within 1 sec, and saturated at . However, the outputs of the optical sensor [Fig. 2(d)] remained at 0 mV which is typical at midnight (15:00 UT corresponds to local midnight): its small fluctuations, , reflect the ADC resolution. In reality, when the optical sensor detects lightning, it typically records a few hundred mV or even 5 V on rare occasions. Thus, we conclude that no lightning occurred during the burst, and hence this burst is associated with thunderclouds.
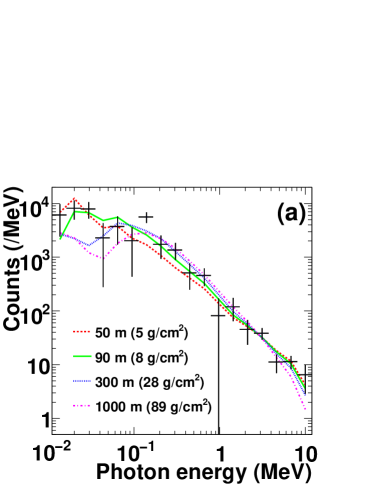
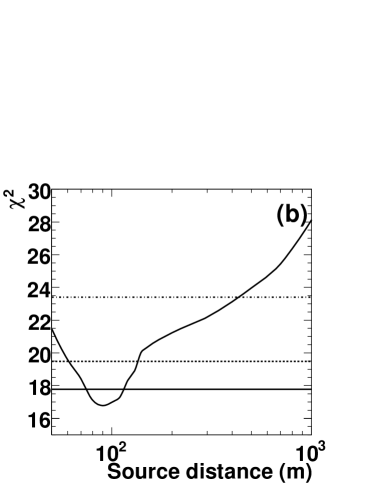
Figure 3(a) shows the background-subtracted photon spectrum, summed over the burst period (90 sec). Here, we subtracted a background spectrum averaged over 15:30 15:40 UT and 15:50 16:00 UT, when the thunderstorm was ongoing. This is to remove effects of Radon rain-outs, which gradually increased the MeV background up to twice those in quiescent periods. The resultant background-subtracted spectrum exhibits a very hard continuum, clearly extending to 10 MeV.
We can estimate the initial photon energy spectrum at the source, from the background-subtracted spectrum. Theoretically, the number of non-thermal bremsstrahlung photons per unit energy emitted by monochromatic electrons is in inverse proportion to the photon energy, up to energies which are close to the electron energy KM_1959 . Also, a numerical simulation Kotoku et al. (2007) has shown that a population of rather flat power-law distributed, or even monochromatic, relativistic electrons colliding with a thick medium produces a power-law bremsstrahlung photon spectrum with a very hard photon index. Thus, we simply assume that the initial photon spectrum is a power-law of the form , where is a normalization factor (photons ), is the photon index, and is the photon energy in MeV. Then, to derive the photon energy spectra to be observed at the observatory, we simulated the photon propagation in the atmosphere with CORSIKA 6.500 CORSIKA incorporating EGS4 EGS4 to correctly treat electromagnetic interactions in relatively low energies relevant to the present work. The photons were assumed to be injected vertically into the atmosphere, and to propagate while suffering Compton scattering and other processes. Finally, the simulated arrival photon spectra, after convolving with the detector response, were fitted to the observed photon spectrum in search for the best-fit values of and for various source distances assumed. The predicted spectra for representative source distances up to 1000 m are shown in Fig. 3(a); larger distances give poorer fits (e.g. for 3000 m). From Fig. 3(b), the source distance, m, gives the minimum , with and (quoted errors are 90% confidence values). Figure 3(b) also gives a constraint as m at 90% confidence level.
IV Discussion
The present -ray burst is not due to Radon or its daughters, because the -rays related to Radon have energies of 0.1 2 MeV, and last for a much longer time Suszcynsky et al. (1996). Compared with some prolonged intracloud x-ray emissions McCarthy and Parks (1985); Each et al. (1996), this burst strongly suggests that electrons were accelerated beyond 10 MeV in thunderclouds. Furthermore, the most outstanding difference of the present burst from previous ones McCarthy and Parks (1985); Each et al. (1996); Suszcynsky et al. (1996); Brunetti et al. (2000); Chubenko et al. (2000); Alexeenko et al. (2000); Torii et al. (2002); Muraki et al. (2004); Tsuchiya et al. (2007) is that charged particles, most likely electrons, were simultaneously observed. This difference may be attributable to the short distance, m, of the present event. Actually, 20 (10) MeV electrons have a range of 110 (60) m at an altitude of 2770 m, which is in good agreement with the constraint on derived above.
We can construct the following picture of the present event. As predicted by Gurevich et al. (1992), seed electrons with energies of keV, produced by e.g. cosmic rays, are electrostatically accelerated in thunderclouds to relativistic energies, and are multiplied therein. We may expect the electron spectrum to reach 20 MeV, because a numerical study Roussel-Dupr é et al. (2008) predicts that the runaway electrons have an average kinetic energy of 7 MeV with a spread of 12 MeV. The 20 MeV electrons can effectively emit bremsstrahlung rays extending to 10 MeV, and escape from the thunderclouds to propagate a distance of 90 m, with their energies reducing down to a few MeV. Because of a Compton optical depth of 0.51 (0.12) at 1 (10) MeV for m, the emitted rays are sometimes scattered by large angles with significant energy loss, producing secondary electrons.
If the primary electrons were in a perfect parallel beam, relativistic effects would make the emitted rays, especially high-energy ones, mostly beamed into a forward narrow cone with a half-opening angle of , where is the Lorentz factor of 20 MeV electrons. In practice, the cone will be much broader, due to multiple scatterings of the emitting electrons, and to the mild Compton scatterings of the emitted photons. The -ray spectrum is expected to be hardest along the cone axis. Since the observed spectrum clearly extends to 10 MeV, it is thought that a rather harder part of the -ray emissions was detected. In particular, the derived photon index, , is close to the theoretically hardest limit (1.0). Thus, we infer that our detectors viewed the cone nearly along its axis.
We may estimate how the Compton-scattered electrons and the escaping primary ones contribute to the excess counts detected by the plastic scintillator, . According to a Monte Carlo simulation, the survival probability of MeV (at the detector) secondary electrons, produced by 3, 5, and 10 MeV rays propagating from a source at m, are 0.01, 0.02, and 0.04, respectively. Thus, employing the photon spectrum at m, , the expected count of the MeV secondary electrons in the plastic scintillator becomes at most even if all the scattered electrons with arriving energies of MeV are collected: we neglected lower-energy ones, since ionization losses in the 1 mm thick aluminum window prevents them from depositing keV energies in the plastic scintillator. Hence, we presume that the escaping primary electrons contribute to by .
From this , we can evaluate the total number of 20 MeV primary electrons for m as
| (1) |
where represents the area of the plastic scintillator, and denotes the attenuation factor of MeV electrons in the atmosphere and the aluminum window. Using this and the initial photon spectrum , the spatial vertical length of the acceleration region, needed for the accelerated electrons to produce the observed bremsstrahlung rays, can be estimated with an assumed beam half-opening angle as
| (2) |
where is the probability per 1 with which the 20 MeV electrons emit bremsstrahlung photons with an energy and an angle with respect to the cone axis KM_1959 . At , which is ten times larger than the perfect parallel beam case (), the above becomes 200 m, and in turn gives the electrostatic potential difference in the acceleration region as , where is the critical electric field for seed electrons to cause the runaway electron avalanches given by Dwyer_MC2007 with the atmospheric pressure atm. This is generally sufficient to accelerate high-energy seed electrons to relativistic energies or 20 MeV if an electric field is higher than the critical value by %. As discussed so far, this observation suggests that long-duration emissions of rays and electrons are due to relativistic runaway electrons, although other possibilities may not necessarily be excluded.
Acknowledgements.
We deeply thank the staff of Norikura cosmic-ray observatory of Institute for Cosmic Ray Research, the University of Tokyo, for support of our experiment. We are grateful to Y. Ikegami and S. Shimoda for production of part of our system. The authors thank G. Poshak for carefully reading the manuscript. The work is supported in part by Grant-in-Aid for Young Scientists (B), No. 19740167, the Special Podoctoral Research Project for Basic Science in RIKEN, and the Special Research Project for Basic Science in RIKEN (“Investigation of Spontaneously Evolving Systems”).References
- Fishman et al. (1994) G. J. Fishman et al., Science 264, 1313 (1994).
- Smith et al. (2005) D. M. Smith et al., Science 307, 1085 (2005).
- Moore et al. (2001) C. B. Moore et al., Geophys. Res. Lett. 28, 2141 (2001).
- Dwyer et al. (2005) J. R. Dwyer et al., Geophys. Res. Lett. 32, L01803 (2005).
- Dwyer et al. (2003) J. R. Dwyer et al., Science 299, 694 (2003).
- Dwyer et al. (2004a) J. R. Dwyer et al., Geophys. Res. Lett. 31, L05118 (2004).
- Dwyer et al. (2004b) J. R. Dwyer et al., Geophys. Res. Lett. 31, L05119 (2004).
- McCarthy and Parks (1985) M. P. McCarthy, and G. K. Parks, Geophys. Res. Lett. 12, 393 (1985).
- Each et al. (1996) K. B. Eack et al., J. Geophys. Res., 101, 29637 (1996).
- Suszcynsky et al. (1996) D. M. Suszcynsky, R. Roussel-Dupré, and C. Shaw, J. Geophys. Res. 101, 23505 (1996).
- Brunetti et al. (2000) M. Brunetti et al., Geophys. Res. Lett.27, 1599 (2000).
- Chubenko et al. (2000) A. P. Chubenko et al., Phys. Lett. A 275, 90 (2000).
- Alexeenko et al. (2000) V. V. Alexeenko et al., Phys. Lett. A 301, 299 (2002).
- Muraki et al. (2004) Y. Muraki et al., Phys. Rev. D69, 123010 (2004).
- Torii et al. (2002) T. Torii, M. Takeishi, and T. Hosono, J. Geophys. Res. 107, 4324 (2002).
- Tsuchiya et al. (2007) H. Tsuchiya et al., Phys. Rev. Lett. 99, 165002 (2007).
- Gurevich et al. (1992) A. V. Gurevich, G. M. Milikh, and R. Roussel-Dupre, Phys. Lett. A 165, 463 (1992).
- (18) J. R. Dwyer, Geophys. Res. Lett. 30, 2055 (2003).
- (19) L. P. Babich, E. N. Donskoy, and R. A. Roussel-Dupré, Geomag. and Aeron. 47, 515 (2007).
- (20) J. R. Dwyer, Phys. Plasm. 14, 042901 (2007).
- (21) H. W. Koch, and J. W. Motz, Rev. Mod. Phys. 31, 920 (1959).
- Kotoku et al. (2007) J. Kotoku et al., Publ. Astron. Soc. Japan 59, 1161 (2007).
- (23) D. Heck et al., Report FZKA 6019, Forschungszentrum Karlsruhe (1998).
- (24) W. R. Nelson, H. Hirayama, and D. W. O Rogers, Report SLAC 265 (1985).
- Roussel-Dupr é et al. (2008) R. Roussel-Dupré, et al., Space Sci. Rev. 137, 51 (2008).