11email: fotis@stef.teicrete.gr 22institutetext: Institute of Astronomy & Astrophysics, National Observatory of Athens, I. Metaxa & V. Pavlou, P. Penteli, GR-15236 Athens, Greece.
22email: ptb@astro.noa.gr 33institutetext: Jodrell Bank Centre for Astrophysics, University of Manchester, Manchester, UK., M13 9PL.
33email: jmeaburn@jb.man.ac.uk 44institutetext: Department of Astronomy, University of Illinois at Urbana-Champaign, 1002 West Green Street, Urbana, IL 61801-3080, USA.
44email: caulet@astro.uiuc.edu
A new candidate supernova remnant G 70.51.9
A compact complex of line emission filaments in the galactic plane has the appearance of those expected of an evolved supernova remnant though non–thermal radio and X–ray emission have not yet been detected. This optical emission line region has now been observed with deep imagery and both low and high–dispersion spectroscopy. Diagnostic diagrams of the line intensities from the present spectra and the new kinematical observations both point to a supernova origin. However, several features of the nebular complex still require an explanation within this interpretation.
Key Words.:
ISM: general – ISM: supernova remnants – ISM: individual objects: G 70.51.91 Introduction
During observations of a new candidate supernova remnant (SNR) in the Cygnus region, close to the known remnant CTB 80, a bright emission line source was detected (Mavromatakis & Strom mav02 (2002)). This source, henceforth to be called G 70.51.9, is relatively compact (a few arcminutes wide), its boundaries are rather sharp and it exhibits a tail of diffuse emission to the east, only seen in the O iii image. We note here that the southern part of this structure is visible on the POSS plates. However, no other information is available on this peculiar, optical line source. Published radio surveys do not show any strong evidence for non–thermal emission at the position of the optical source, while the ROSAT All–Sky survey data do not reveal any excess X–ray emission at this position. Both could be expected if the filamentary nebula is an evolved SNR. In order to study in more detail the detected structures and try to understand their origin we performed deep optical, flux calibrated, imaging observations in the low and medium ionization lines of HN ii, S ii, O ii and O iii. We have also obtained deep spatially–resolved low–dispersion long–slit spectra at four different slit positions of this filamentary structure in an effort to get more information about the actual physical conditions. Spatially resolved long-slit spectra along one slit position have also been obtained to reveal any motions typical of an evolved SNR. Information about the observations and results are given in Sect. 2, while in Sect. 3 we discuss the nature of these new filamentary structure.
2 Observations & Results
2.1 Imaging
The observations presented in this paper were performed with the 1.3 m Ritchey–Cretien telescope at Skinakas Observatory, Crete, Greece. The filamentary nebula, G70.51.9 was observed on July 09 and 10, 2001 with interference filters isolating the optical emission lines of HN ii, S ii, O ii, and O iii. The 1024 1024 SITe CCD used during the observations had a pixel size of 24 m resulting in a 8′.5 8′.5 field of view. Two different pointing directions were performed in order to cover the area of emission seen in the wide field images of Mavromatakis & Strom (mav02 (2002)). The first concentrated on the bright filaments in the west, while the second focuses on the diffuse O iii emission in the east. All fields were projected to a common origin on the sky and were subsequently combined to create the final mosaics. The astrometric solutions were calculated with IRAF routines and utilized the HST Guide star catalogue (Lasker et al. las99 (1999)). The log of the observations together with the filter characteristics and the exposure times are given in Table 1. All coordinates given in this work refer to epoch J2000.
We employed standard IRAF and MIDAS routines for the reduction of the data. Individual frames were bias subtracted and flat–field corrected using well exposed twilight flat–fields. The spectrophotometric standard stars HR5501, HR7950, HR7596, HR9087, and HR8634 were observed for absolute flux information (Hamuy et al. ham92 (1992), ham94 (1994)).
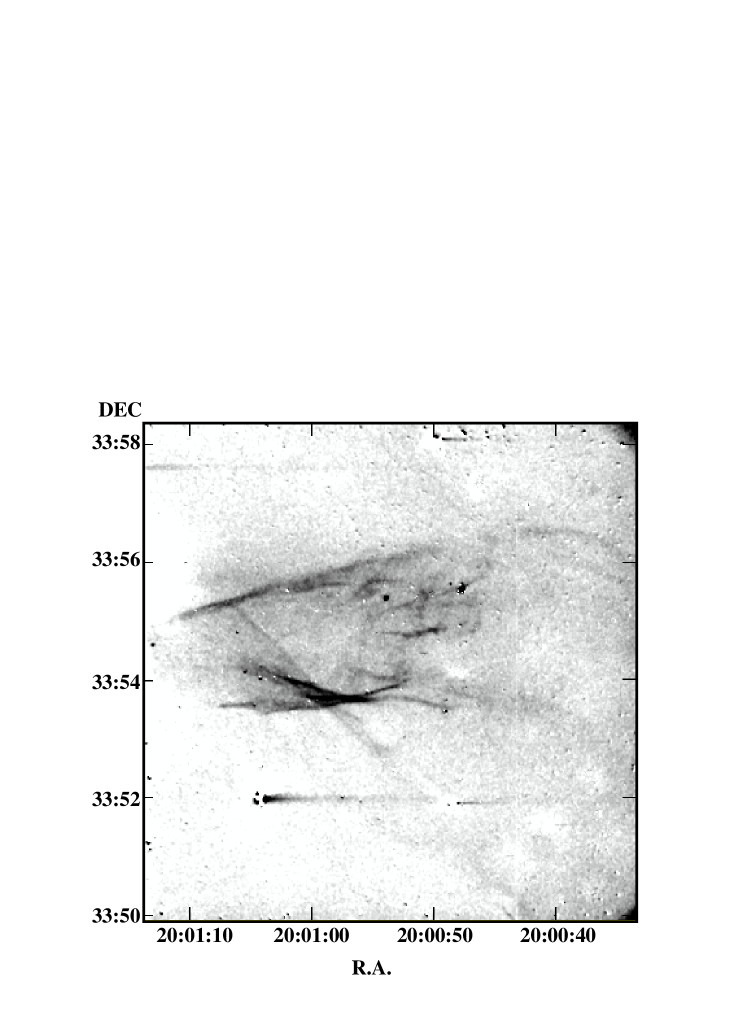
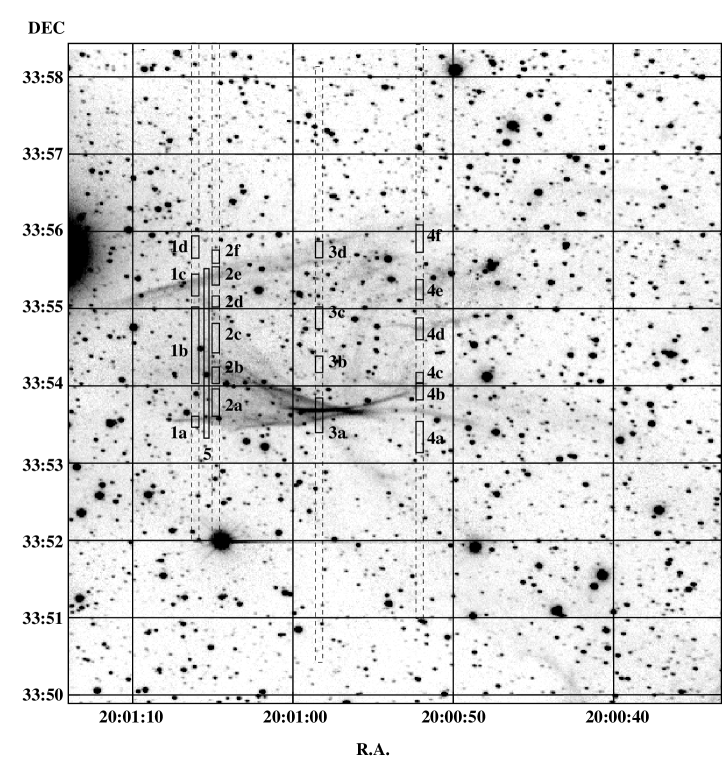
2.1.1 The HN ii and S ii line images
The higher angular resolution images of G70.51.9 allow us to study in more detail the network of filaments. A basic characteristic of these filaments is their brightness in HN ii (Fig. 1) and S ii (Fig. 2). The bulk of the emission seems to be bounded by two very sharp filaments. These are separated by a typical distance of 2′ along the declination axis. The southern filament is found at an almost constant declination (33°53′30″), while the northern is inclined by 15° with respect to the east–west direction. Diffuse emission and several shorter filamentary structures are detected between the north and south boundaries (Figs. 1 and 2). The detected emission line structures are not bounded in the east–west direction and weak diffuse as well as filamentary emission is detected further to west in an arc–like shape (Fig. 3, 20h00m40s, 33°53′). There is also a long filamentary structure originating roughly from 20h01m07s, 33°55′20″ and extending down to 20h00m42s and 33°50′02″, after a long gap of 3′. Finally, a patchy structure is present around 20h01m05s and 33°52′15″ to the south of the main emission area. The east field was also observed in these filters as reported in Table 1 but it is not shown here since any emission is below our detection limit.
2.1.2 The O ii and O iii line mosaics
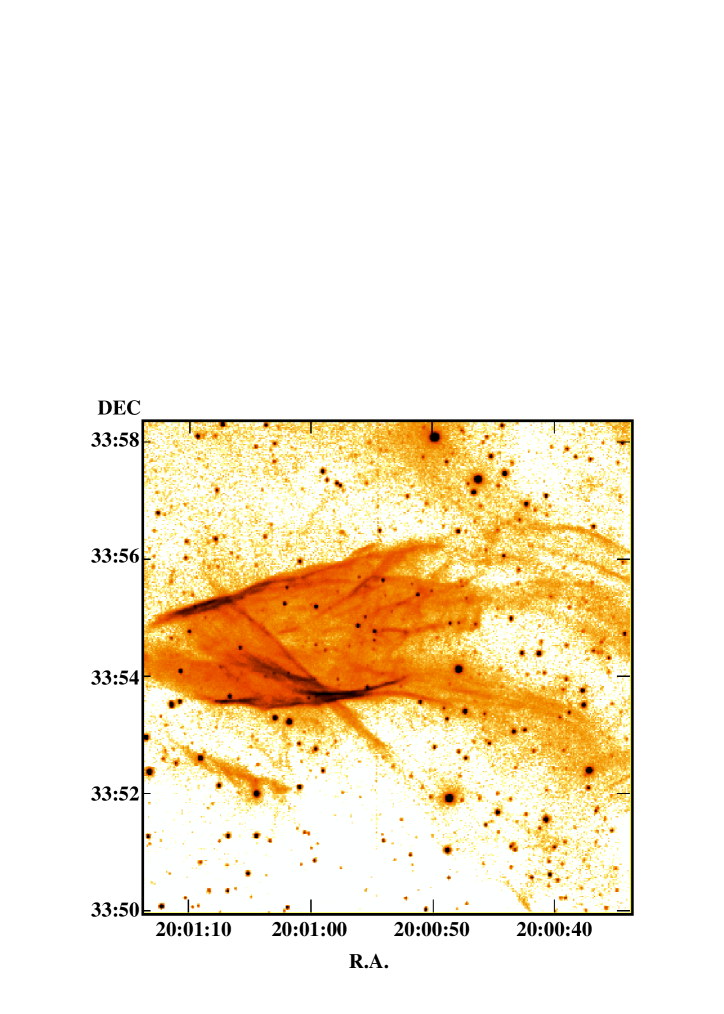
The detected structures are also quite strong in the low ionization line of O ii3727 Å (Fig. 3). The morphology in this emission line is generally similar to that of the low ionization lines discussed above. The south, bright filament (20h01m, 33°53′30″) is characterized by a surface brightness up to 28 erg s-1 cm-2 arcsec-2, while the northern filament displays a surface brightness in the range of 12–19 erg s-1 cm-2 arcsec-2. The weak but arc–like shaped emission to the west is detected at a level of 1–2 erg s-1 cm-2 arcsec-2. The typical full width at half maximum (fwhm) of the filament in the south is found in the range of 3″ – 6″, while the northern filament (20h01m10s, 33°55′20″) is broader with a fwhm of 8″. The weaker filaments seen to the interior of the bright emission are characterized by fwhm of 3″.5.
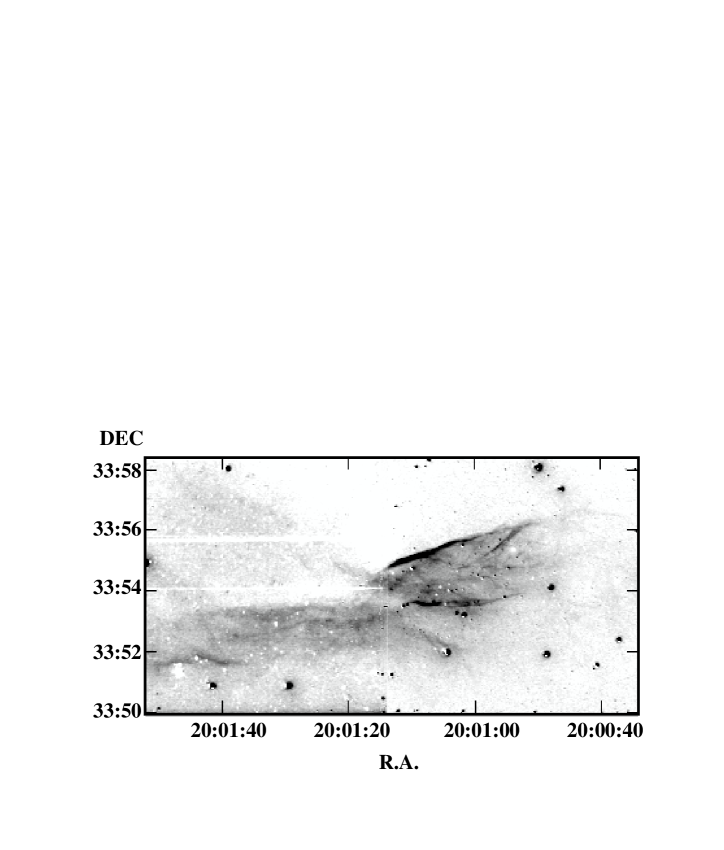
The morphology of the structure as recorded through the O iii interference filter (Fig. 4) differs from the morphology of the low ionization images, including the O ii image. The variety of structures detected in the HN ii, S ii and O ii images between the south and north filaments are not clearly present in the medium ionization line of O iii. In fact, some structures may not be present at all or their morphology has now become so diffuse that does not allow the direct identification of the corresponding structures seen in the low ionization images. The north boundary filament appears quite sharp in this emission line, while it appears less well defined in HN ii. The inverse holds in the south–west, i.e. the filament is sharp in the HN ii image but diffuse emission is seen in the O iii image. A major difference between the low and medium ionization line images is the greater extent to the east of the north and south filaments (Fig. 4). The north O iii filament extends for 43″ further to the east from the tip of the corresponding HN ii filament, while the south O iii filament extends for 34″ further to the east compared to the HN ii emission (around 20h01m15s). The images of these regions provide direct evidence for the presence of incomplete shock structures, i.e. areas where part of the recombination zone is missing allowing high O iii/H ratios. Finally, the O iii image displays a “tail” of, mainly, diffuse emission further to the east for 8′. The typical width of this diffuse emission is less than 2′, while its typical brightness is 1.5–2.0 erg s-1 cm-2 arcsec-2. This diffuse component is not detected in the low ionization images and it is not clear if it is related to the filamentary emission in the west.
2.2 Spectroscopy
2.2.1 Low dispersion
Long–slit low–dispersion spectra were obtained on June 22 and 23, 2001 using the 1.3 m Ritchey–Cretien telescope at Skinakas Observatory. The data were taken with a 1300 line mm-1 grating and a 800 2000 SITe CCD covering the range of 4750 Å – 6815 Å. The slit had a width of 77 and a length of 7′.9 and, in all cases, was oriented in the south–north direction. The coordinates of the slit centers along with the number of spectra and the total exposure times are given in Table 1. A spectrum taken on August 3, 2000 with the same hardware configuration and presented by Mavromatakis & Strom (mav02 (2002)) is also used here with different apertures extracted. The spectrophotometric standard stars HR5501, HR7596, HR7950, HR9087, and HR718 were observed for absolute flux information (Hamuy et al. ham92 (1992), ham94 (1994)).
Long–slit spectra have been obtained at four different positions. The relatively small size of the source (3′) compared with the slit length of 7′.9 allowed very good background subtraction. In addition, we have the possibility to study the nature of the diffuse emission detected between the bright filaments. The absolute H flux ranges from 0.5 to 7 erg s-1 cm-2 arcsec-2 (Table 2). The high S ii/H ratios clearly demonstrate that the detected emission originates from shock heated gas (S ii/H 0.5–1.6; Table 2). The fluxes of the individual sulfur lines may provide data on the electron density of the emitting gas (Osterbrock & Ferland ost06 (2006)). However, all sulfur line ratios approach the high end of the allowable range of values suggesting low electron densities. Using the nebular package within the IRAF software (Shaw and Dufour sha95 (1995)) we find that all electron densities are estimated to lie below 120 cm-3. Therefore we cannot directly estimate the preshock cloud densities but can only place upper limits, provided that there is no magnetic field to halt the compression.
2.2.2 High dispersion
Observations of G70.51.9 were made with the Manchester Echelle Spectrometer (MES–SPM – see Meaburn et al. mea84 (1984); mea03 (2003)) combined with the 2.1–m San Pedro Martir telescope on 23 August, 2005. A SITe CCD was the detector with 10241024, 24 m pixels although 22 binning was employed throughout the observations.
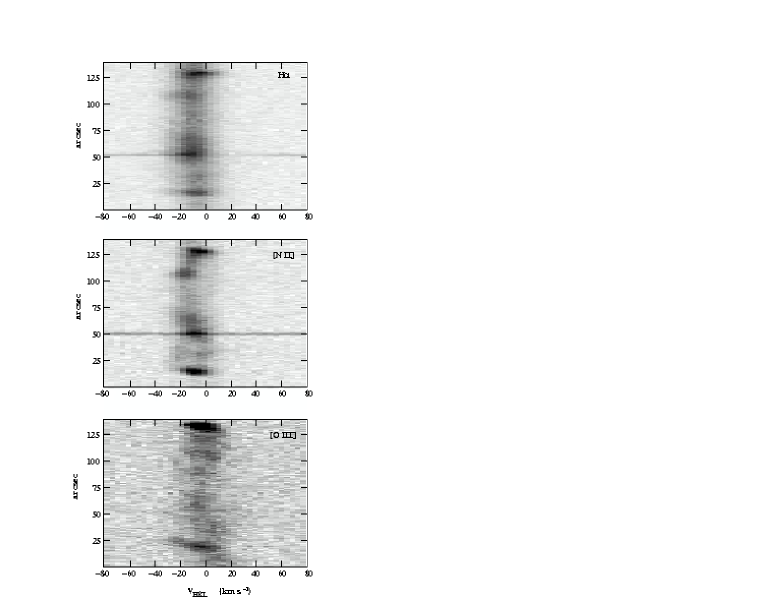
Spatially resolved, long-slit H, N ii & O iii line profiles were obtained with the MES–SPM along the line marked 5 in Fig. 2. This is only a partial length of the full NS slits as relevant emission only occurred over small sections of the full slit length. The increments along the slit length each corresponds to 0″.63.
In this spectroscopic mode MES–SPM has no cross–dispersion consequently, for the present observations, a filter of 90 Å bandwidth was used to isolate the 87th echelle order containing the H and N ii nebular emission lines and one of 60 Å bandwidth for O iii. The slit width was always 150 m which is 1.9″ on the sky and 10 km s-1 spectral halfwidth. Each integration time was 1800 s.
The longslit spectra were cleaned of cosmic rays and calibrated in wavelength to 1 km s-1 accuracy in the usual way using STARLINK figaro software. The greyscale representation of the position–velocity (pv) arrays of H, N ii & O iii line profiles for the partial slit length shown in Fig. 2 for Slit 5 are shown in Fig. 5. As no standard star was observed the absolute surface brightnesses are unreliable and will not be presented here.
3 Discussion
Detailed optical observations have been performed in an attempt to understand the nature of G70.51.9. The lower ionization images in HN ii, S ii, O ii and the higher ionization image in O iii reveal several filamentary structures. In addition, velocity resolved profiles have been obtained along a specific slit position. The current data point to a shock heated origin of the optical emission.
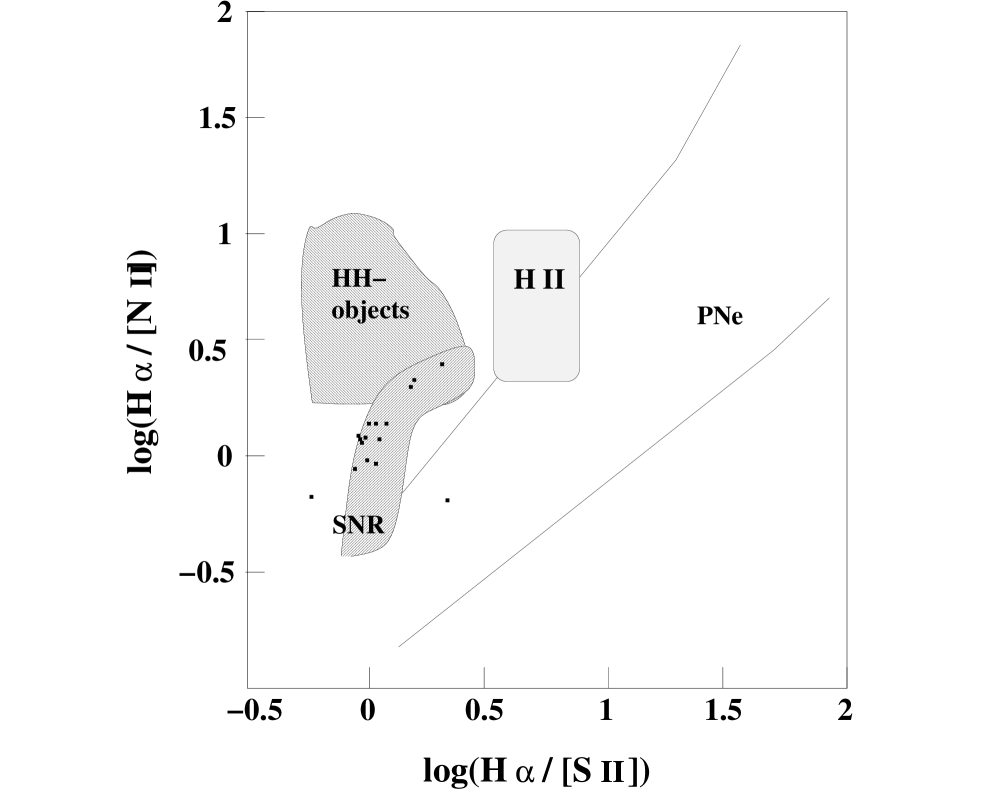
The SNR origin of the proposed candidate remnant is strongly suggested by the positions of the line ratios in Fig. 6 compared with those of Herbig–Haro objects (HH–objects), Hii regions and planetary nebulae (PNe). They follow closely the shape of those observed for those of shock ionized evolved SNRs. The O iii/H ratio is a very usefull diagnostic tool for complete or incomplete shock structures (Raymond et al. ray88 (1988)). All spectra suggest complete shock structures except that from Area 1a with an O iii/H ratio of 26. Typically, this ratio is below 6 (Cox & Raymond cox85 (1985); Hartigan et al. har87 (1987)). However, this limit is easily exceeded in case of shocks with incomplete recombination zones like in Area 1a. Since the long–slit spectra do not cover the full extent of the source, we can use our flux calibrated images to map areas with incomplete shock structures. Since our HN ii filter transmits equally the N ii6548, 6584 Å, and H lines we can estimate the H flux as 1/2 of the flux measured in the HN ii filter. Assuming that the H/H ratio is 4 all over this source, as the long–slit spectra suggest, we estimate the O iii/H ratio as 8 O iii/HN ii. Interestingly, we find that the area further to the east, i.e. between 20h01m08s and 20h01m14s is dominated by such structures.
The motions of the filaments as seen in Fig. 5 also suggest an evolved SNR origin. The line profiles are single over the bright filaments, where expansive motions are expected to be tangential along the line of sight, but become split, albeit by only a few tens of km s-1 towards the fainter regions.
It remains possible that this isolated, and irregular group of filaments is part of a wider structure but being seen through holes in intervening clouds leading to patchy optical interstellar extinction. The correlation of these filaments with the structures reported by Mavromatakis & Strom (kal76 (1976)) is also not clear. The current data alone are not sufficient to claim a correlation. The H/H ratios in Table 2 can be used to estimate the variations in logarithmic extinction coefficient c over this source assuming an intrinsic ratio of 3 and the interstellar extinction curve of Kaler (kal76 (1976)) as implemented in the nebular package (Shaw and Dufour (sha95 (1995)) within the IRAF software. The signal to noise weighted average of the observed H/H ratios in Table 2 is 4.0 (0.1) derived from all different apertures and spectra available. The logarithmic extinction c is then 0.40 which is equivalent to an AV of 0.8 and an E(BV) of 0.27. Here we have assumed E(BV) = 0.664 c (Kaler kal76 (1976); Aller all84 (1984)). E(B-V) values are listed in Table 2 along with other parameters, where it can be seen that statistical significant H/H ratios vary from 2.9 (area 4f) to 4.5 (area 4d).
The average hydrogen column density derived from the statistical relation of Predehl& Schmidt (pre95 (1995)) is 1.4 1021 cm-3, while the total galactic hydrogen column density in the direction of the candidate remnant is around 1 1022 cm-3(Kalberla et al. kal05 (2005) and Dickey & Lockman dic90 (1990)). It is clear that the value based on the optical data and a statistical relation is lower by a factor of 6 than the estimated total Nh. This implies that the detected structures are closer to us than the total distance to the outer part of the galaxy in that specific direction. The use of the code given by Hakkila et al. (hak97 (1997)) to calculate the visual extinction in the direction of G70.51.9 supports the above suggestion given our measurements of optical extintion (with typical color excess of 0.27). It is likely that the distance to the proposed candidate remnant is less than 1 kpc.
A crucial issue concerns the existence of radio emission. Radio emission in the area of the optical structures is detected in the low resolution (7′) 4850 MHz images of the Green Bank survey (Gregory & Condon gre91 (1991)). Given the low resolution, it is very hard to state any spatial correlation. We have also examined the higher resolution CGPS data at 1420 MHz (Taylor et al. tay03 (2003)) but no prominent emission was detected. The 3 upper limit obtained is 4 mJy/beam. We note here that there are also other SNRs that do not display radio emission, at least, at the detection level of the corresponding observations (e.g. Dickel et al. dic01 (2001), Filipovi et al. fil08 (2008)). Radio observations in different wavelengths should be performed to provide conclusive evidence on the nature of the source as an evolved SNR. Finally, we have searched ROSAT data for X-rays but none have been detected in the area of the optical emission.
Acknowledgements.
We would like to thank the referee Prof. Dickel J. for his comments and S. Akras for his help on spectral fluxes calculations. Skinakas Observatory is a collaborative project of the University of Crete, the Foundation for Research and Technology-Hellas and the Max-Planck-Institut für Extraterrestrische Physik. This research has made use of data obtained through the High Energy Astrophysics Science Archive Research Center Online Service, provided by the NASA/Goddard Space Flight Center.References
- (1) Aller L. H. 1984, “Physics of thermal gaseous nebulae”, D. Reidel Publishing Company
- (2) Cantó J., 1981, in. Investigating the Universe, ed. Reidel, Dordrecht, p. 95
- (3) Cox D. P., Raymond J. C. 1985, ApJ 298, 651
- (4) Dickey, J. M. & Lockman, F. J. 1990, ARAA, 28, 215
- (5) Dickel, J. R., Williams, R. M., Carter, L. M., Milne, D. K., Petre, R., and Amy, S. W. 2001, AJ, 122, 849
- (6) Filipovi, M.D., Haberl, F., Winkler, P. F., Pietsch, W., Payne, J. L., Crawford, E. J., De Horta, A. Y., Stootman, F. H., and Reaser, B.E. 2008, A&A, 485, 63
- (7) Gregory, P. C. & Condon, J. J., 1991, ApJS, 75, 1011
- (8) Hakkila, J., Myers, J. M., Stidham, B. J., Hartmann, D. H., 1997, AJ, 114, 2043
- (9) Hamuy M., Walker A. R., Suntzeff N. B., Gigoux P., Heathcote S. R. & Phillips M. M., 1992, PASP, 104, 533
- (10) Hamuy M., Suntzeff N. B., Heathcote S. R., Walker A. R., Gigoux P., Phillips M. M. 1994, PASP 106, 566
- (11) Hartigan P., Raymond J. and Hartmann L. 1987, ApJ 316, 323
- (12) Kalberla P. M. W., Burton, W. B., Hartmann, Dap, Arnal, E. M., Bajaja, E., Morras, R., Pöppel, W. G. L., 2005, A&A, 440, 775
- (13) Kaler J. B. 1976, ApJS 31, 517
- (14) Lasker B. M., Russel J. N. & Jenkner H., 1999, in the HST Guide Star Catalog, version 1.1-ACT, The Association of Universities for Research in Astronomy, Inc
- (15) Mavromatakis F., Strom, R. G. 2002, A&A 382, 291
- (16) McKee C. F., Cowie L. 1975, ApJ 195, 715
- (17) Meaburn, J., Blundell, B., Carling, R., Gregory, D. E., Keir, D. F. & Wynne C. G., 1984, MNRAS, 210, 463.
- (18) Meaburn, J., López, J. A., Gutiérrez, L., Quiróz, F., Murillo, J. M., Valdéz, J., Pedrayez, M., 2003, RMxAA, 39, 185.
- (19) Osterbrock D. E. & Ferland G. J., 2006, Astrophysics of gaseous nebulae and AGN, eds. University Science Books, US
- (20) Predehl P., and Schmitt J. H. M. M. 1995, A&A 293, 889
- (21) Raymond J. C., Hester J. J., Cox. D., Blair W. P., Fesen R. A., Gull T. R. 1988, ApJ 324, 869
- (22) Sabbadin F., Minello S. & Bianchini A. 1977, A&A 60, 147
- (23) Shaw R. A. and Dufour R. J. 1995, PASP 107, 896
- (24) Taylor, A. R., Gibson, S. J., Peracaula, M., et al. 2003, AJ, 125, 3145
| IMAGING | ||||||
| Filter | Total exp. time | Fieldsa | ||||
| () | () | (sec) | ||||
| H[N ii] | 6566 | 75 | 6600 (3)b | W | ||
| S ii | 6712 | 20 | 6600 (3) | W | ||
| O iii | 5014 | 28 | 4800 (2) | W | ||
| O ii | 3727 | 25 | 4800 (2) | W | ||
| Cont blue | 5470 | 230 | 360 (3) | W | ||
| Cont red | 6096 | 134 | 510 (5) | W | ||
| H[N ii] | 6566 | 75 | 2400 (1) | E | ||
| S ii | 6712 | 20 | 2400 (1) | E | ||
| O iii | 5014 | 28 | 4800 (2) | E | ||
| O ii | 3727 | 25 | 2400 (1) | E | ||
| Cont blue | 5470 | 230 | 360 (3) | E | ||
| Cont red | 6096 | 134 | 360 (3) | E | ||
| SPECTROSCOPY | ||||||
| Area | Slit centers | Total exp. time | Telescope | |||
| (sec) | ||||||
| Area 1 | 20h01m06.2s | 33°56′20″ | 2700 (1) | 1.3-m | ||
| Area 2 | 20h01m05.0s | 33°56′15″ | 7200 (2) | 1.3-m | ||
| Area 3 | 20h00m58.2s | 33°54′34″ | 3600 (2) | 1.3-m | ||
| Area 4 | 20h00m52.0s | 33°55′41″ | 3600 (2) | 1.3-m | ||
| Area 5 | 20h01m05.4s | 33°54′20″ | 3600 (2) | 2.1-m | ||
a Field observed: W(West), E(East).
b Numbers in parentheses represent the number of individual frames.
| Area 1a | Area 1b | Area 1c | Area 1d | Area 2a | |||||||||||
| Line (Å) | Fa | Ib | S/Nc | F | I | S/N | F | I | S/N | F | I | S/N | F | I | S/N |
| H 4861 | 15 | 36 | (6) | 26 | 33 | (43) | 24 | 34 | (26) | 20 | 34 | (11) | 24 | 34 | (28) |
| [O iii] 4959 | 99 | 226 | (39) | 35 | 44 | (61) | 32 | 45 | (40) | – | – | – | 31 | 43 | (39) |
| [O iii] 5007 | 317 | 702 | (114) | 107 | 134 | (177) | 103 | 142 | (115) | – | – | – | 92 | 126 | (111) |
| O i 6300 | 11 | 11 | (7) | 5 | 5 | (17) | – | – | – | – | – | – | 7 | 7 | (10) |
| O i 6364 | – | – | – | – | – | – | – | – | – | – | – | – | 2 | 2 | (3) |
| [N ii] 6548 | 40 | 40 | (27) | 25 | 25 | (68) | 25 | 25 | (50) | 15 | 15 | (21) | 27 | 27 | (54) |
| H 6563 | 100 | 100 | (47) | 100 | 100 | (158) | 100 | 100 | (133) | 100 | 100 | (105) | 100 | 100 | (147) |
| [N ii] 6583 | 141 | 140 | (72) | 79 | 79 | (148) | 84 | 84 | (35) | 47 | 47 | (53) | 89 | 89 | (144) |
| [S ii] 6716 | 91 | 86 | (55) | 50 | 49 | (119) | 51 | 50 | (87) | 29 | 28 | (41) | 68 | 66 | (125) |
| [S ii] 6731 | 68 | 64 | (40) | 36 | 35 | (76) | 37 | 36 | (67) | 21 | 20 | (23) | 49 | 48 | (94) |
| Absolute H fluxd | 2 | 2.1 | 3.9 | 1.3 | 2.5 | ||||||||||
| [S ii]/H | 1.50 0.04 | 0.84 0.01 | 0.86 0.01 | 0.48 0.01 | 1.14 0.01 | ||||||||||
| F(6716)/F(6731) | 1.34 0.04 | 1.39 0.03 | 1.38 0.03 | 1.38 0.07 | 1.39 0.02 | ||||||||||
| N ii/H | 1.80 0.05 | 1.04 0.02 | 1.09 0.01 | 0.62 0.01 | 1.16 0.01 | ||||||||||
| [O iii]/H | 25.8 4.3 | 5.40 0.13 | 5.50 0.21 | – | 5.00 0.18 | ||||||||||
| c(H) | 1.10 0.20 | 0.31 0.03 | 0.44 0.05 | 0.67 0.12 | 0.44 0.05 | ||||||||||
| EB-V | 0.73 0.13 | 0.21 0.02 | 0.29 0.03 | 0.44 0.08 | 0.29 0.03 | ||||||||||
| Area 2b | Area 2c | Area 2d | Area 2e | Area 2f | |||||||||||
| Line (Å) | Fa | Ib | S/Nc | F | I | S/N | F | I | S/N | F | I | S/N | F | I | S/N |
| H 4861 | 24 | 34 | (35) | 23 | 34 | (25) | 25 | 34 | (21) | 24 | 34 | (38) | 29 | 33 | (17) |
| [O iii] 4959 | 18 | 25 | (30) | 25 | 36 | (30) | 32 | 43 | (29) | 39 | 54 | (69) | 5 | 6 | (2) |
| [O iii] 5007 | 56 | 77 | (88) | 72 | 101 | (83) | 97 | 128 | (87) | 119 | 164 | (190) | 12 | 14 | (9) |
| O i 6300 | 9 | 9 | (17) | 7 | 7 | (9) | 10 | 10 | (10) | 6 | 6 | (12) | 10 | 10 | (5) |
| O i 6364 | 2 | 2 | (5) | 3 | 3 | (5) | 3 | 3 | (5) | – | – | – | – | – | – |
| [N ii] 6548 | 24 | 24 | (60) | 21 | 21 | (41) | 23 | 23 | (36) | 26 | 26 | (72) | 17 | 17 | (19) |
| H 6563 | 100 | 100 | (174) | 100 | 100 | (140) | 100 | 100 | (109) | 100 | 100 | (197) | 100 | 100 | (77) |
| [N ii] 6583 | 78 | 78 | (159) | 69 | 68 | (111) | 71 | 71 | (89) | 84 | 84 | (189) | 48 | 48 | (44) |
| [S ii] 6716 | 63 | 62 | (159) | 51 | 50 | (92) | 44 | 43 | (64) | 50 | 49 | (130) | 30 | 30 | (44) |
| [S ii] 6731 | 45 | 44 | (102) | 36 | 35 | (69) | 32 | 31 | (49) | 36 | 35 | (99) | 22 | 22 | (25) |
| Absolute H fluxd | 4.2 | 2.1 | 2.2 | 3.7 | 1.5 | ||||||||||
| [S ii]/H | 1.06 0.01 | 0.85 0.01 | 0.74 0.01 | 0.84 0.01 | 0.52 0.01 | ||||||||||
| F(6716)/F(6731) | 1.40 0.02 | 1.42 0.03 | 1.38 0.04 | 1.39 0.02 | 1.36 0.07 | ||||||||||
| N ii/H | 1.02 0.01 | 0.89 0.01 | 0.94 0.01 | 1.10 0.01 | 0.65 0.01 | ||||||||||
| [O iii]/H | 3.00 0.09 | 4.00 0.18 | 5.00 0.25 | 6.40 0.17 | 0.60 0.07 | ||||||||||
| c(H) | 0.44 0.04 | 0.47 0.05 | 0.38 0.07 | 0.44 0.04 | 0.16 0.08 | ||||||||||
| EB-V | 0.29 0.03 | 0.31 0.03 | 0.25 0.05 | 0.29 0.03 | 0.11 0.06 | ||||||||||
a Observed surface brightness normalized to F(H)=100 and uncorrected for interstellar extinction.
b Intrinsic surface brightness normalized to F(H)=100 and corrected for interstellar extinction.
c Numbers in parentheses represent the signal–to–noise ratio of the quoted fluxes.
d In units of erg s-1 cm-2 arcsec-2.
The letters next to the areas number indicate different apertures extracted along the slit.
Listed fluxes are a signal–to–noise weighted average of two fluxes for areas 2, 3 and 4.
The emission line ratios [S ii]/H, F(6716)/F(6731), N ii/H and [O iii]/H are calculated using the values corrected for interstellar extinction.
The errors of the emission line ratios, c(H) and EB-V, are calculated through standard error propagation.
| Area 3a | Area 3b | Area 3c | Area 3d | Area 4a | |||||||||||
| Line (Å) | Fa | Ib | S/Nc | F | I | S/N | F | I | S/N | F | I | S/N | F | I | S/N |
| H 4861 | 25 | 34 | (83) | 28 | 34 | (12) | 26 | 33 | (19) | 25 | 34 | (23) | 27 | 34 | (9) |
| [O iii] 4959 | 9 | 12 | (33) | 26 | 31 | (12) | 32 | 40 | (24) | 14 | 19 | (15) | 11 | 14 | (3) |
| [O iii] 5007 | 25 | 33 | (89) | 84 | 100 | (37) | 109 | 136 | (80) | 46 | 61 | (48) | 57 | 70 | (20) |
| O i 6300 | 7 | 7 | (40) | – | – | – | – | – | – | – | – | – | 50 | 51 | (10) |
| O i 6364 | 3 | 3 | (18) | – | – | – | – | – | – | – | – | – | 17 | 17 | (5) |
| [N ii] 6548 | 22 | 22 | (127) | 27 | 27 | (20) | 18 | 18 | (23) | 24 | 24 | (40) | – | – | – |
| H 6563 | 100 | 100 | (383) | 100 | 100 | (59) | 100 | 100 | (98) | 100 | 100 | (123) | 100 | 100 | (44) |
| [N ii] 6583 | 72 | 72 | (317) | 82 | 82 | (53) | 65 | 65 | (72) | 76 | 76 | (107) | 43 | 43 | (17) |
| [S ii] 6716 | 65 | 64 | (301) | 55 | 54 | (39) | 45 | 44 | (55) | 44 | 43 | (67) | 95 | 94 | (42) |
| [S ii] 6731 | 46 | 45 | (218) | 36 | 35 | (27) | 31 | 30 | (38) | 32 | 31 | (52) | 64 | 63 | (31) |
| Absolute H fluxd | 6.9 | 1.6 | 1.8 | 3.7 | 0.5 | ||||||||||
| [S ii]/H | 1.09 0.01 | 0.89 0.02 | 0.74 0.01 | 0.74 0.01 | 1.57 0.05 | ||||||||||
| F(6716)/F(6731) | 1.41 0.01 | 1.53 0.07 | 1.45 0.05 | 1.37 0.03 | 1.48 0.06 | ||||||||||
| N ii/H | 0.94 0.01 | 1.09 0.02 | 0.83 0.01 | 1.00 0.01 | 0.43 0.01 | ||||||||||
| [O iii]/H | 1.32 0.02 | 3.80 0.32 | 5.30 0.28 | 2.40 0.11 | 2.50 0.31 | ||||||||||
| c(H) | 0.38 0.02 | 0.24 0.11 | 0.31 0.07 | 0.38 0.06 | 0.28 0.15 | ||||||||||
| EB-V | 0.25 0.01 | 0.16 0.07 | 0.21 0.05 | 0.25 0.04 | 0.19 0.10 | ||||||||||
| Area 4b | Area 4c | Area 4d | Area 4e | Area 4f | |||||||||||
| Line (Å) | Fa | Ib | S/Nc | F | I | S/N | F | I | S/N | F | I | S/N | F | I | S/N |
| H 4861 | 26 | 33 | (30) | 23 | 34 | (22) | 22 | 34 | (37) | 28 | 34 | (30) | 35 | 36 | (29) |
| [O iii] 4959 | 7 | 9 | (10) | 6 | 9 | (7) | 11 | 16 | (20) | 11 | 13 | (15) | 14 | 15 | (14) |
| [O iii] 5007 | 35 | 44 | (46) | 37 | 52 | (39) | 50 | 73 | (92) | 41 | 49 | (50) | 52 | 54 | (48) |
| O i 6300 | – | – | – | 6 | 6 | (7) | 11 | 12 | (24) | 10 | 10 | (12) | 13 | 13 | (9) |
| O i 6364 | – | – | – | – | – | – | 3 | 3 | (8) | 4 | 4 | (6) | 3 | 3 | (2) |
| [N ii] 6548 | 28 | 28 | (59) | 20 | 20 | (34) | 29 | 29 | (86) | 24 | 24 | (46) | 18 | 18 | (27) |
| H 6563 | 100 | 100 | (156) | 100 | 100 | (118) | 100 | 100 | (215) | 100 | 100 | (144) | 100 | 100 | (109) |
| [N ii] 6583 | 88 | 88 | (148) | 66 | 66 | (90) | 101 | 101 | (233) | 80 | 80 | (127) | 57 | 57 | (73) |
| [S ii] 6716 | 66 | 65 | (127) | 51 | 49 | (78) | 68 | 66 | (182) | 55 | 54 | (101) | 37 | 37 | (58) |
| [S ii] 6731 | 48 | 47 | (100) | 34 | 33 | (56) | 49 | 47 | (131) | 41 | 40 | (81) | 26 | 26 | (42) |
| Absolute H fluxd | 2.6 | 3.4 | 2.7 | 2.6 | 1.9 | ||||||||||
| [S ii]/H | 1.12 0.01 | 0.82 0.01 | 1.13 0.01 | 0.94 0.01 | 0.63 0.01 | ||||||||||
| F(6716)/F(6731) | 1.38 0.02 | 1.48 0.03 | 1.40 0.01 | 1.35 0.02 | 1.42 0.04 | ||||||||||
| N ii/H | 1.16 0.01 | 0.86 0.01 | 1.30 0.01 | 1.04 0.01 | 0.75 0.01 | ||||||||||
| [O iii]/H | 1.60 0.06 | 1.80 0.09 | 2.60 0.08 | 1.82 0.07 | 1.92 0.08 | ||||||||||
| c(H) | 0.31 0.04 | 0.47 0.06 | 0.53 0.04 | 0.24 0.04 | 0.16 0.05 | ||||||||||
| EB-V | 0.21 0.03 | 0.31 0.04 | 0.35 0.03 | 0.16 0.03 | 0.11 0.03 | ||||||||||
a Observed surface brightness normalized to F(H)=100 and uncorrected for interstellar extinction.
b Intrinsic surface brightness normalized to F(H)=100 and corrected for interstellar extinction.
c Numbers in parentheses represent the signal–to–noise ratio of the quoted fluxes.
d In units of erg s-1 cm-2 arcsec-2.
The letters next to the areas number indicate different apertures extracted along the slit.
Listed fluxes are a signal–to–noise weighted average of two fluxes for areas 2, 3 and 4.
The emission line ratios N ii/H and [O iii]/H are calculated using the values corrected for interstellar extinction.