Testing the radio halo-cluster merger scenario. The case of RXCJ 2003.5–2323
Abstract
Aims. We present a combined radio, X–ray and optical study of the galaxy cluster RXCJ 2003.5–2323. The cluster hosts one of the largest, most powerful and distant giant radio halos known to date, suggesting that it may be undergoing a strong merger process. The aim of our multiwavelength study is to investigate the radio–halo cluster merger scenario.
Methods. We studied the radio properties of the giant radio halo in RXCJ 2003.5–2323 by means of new radio data obtained at 1.4 GHz with the Very Large Array, and at 240 MHz with the Giant Metrewave Radio Telescope, in combination with previously published GMRT data at 610 MHz. The dynamical state of the cluster was investigated by means of X–ray observations and optical ESO–NTT observations.
Results. Our study confirms that RXCJ 2003.5–2323 is an unrelaxed cluster. The unusual filamentary and clumpy morphology of the radio halo could be due to a combination of the filamentary structure of the magnetic field and turbulence in the inital stage of a cluster merger.
Key Words.:
radio continuum: galaxies - galaxies: clusters: general - galaxies: clusters: individual: RXCJ2003.5-23231 Introduction
RXCJ 2003.5–2323 is an X–ray luminous and massive galaxy cluster at
redshift z=0.317, belonging to the ROSAT–ESO Flux Limited X–ray cluster
catalogue (REFLEX; Böhringer et al. boeringer04 (2004)).
Its main properties are summarized in Tab. 1.
RXCJ 2003.5–2323 hosts a cluster scale radio source classified as giant
radio halo (Venturi et al. venturi07 (2007), hereinafter VGB07).
Radio halos are diffuse, cluster–scale low surface brightness radio sources of
synchrotron origin found in a fraction of X–ray luminous (i.e. massive)
clusters. They are not
associated with individual galaxies but rather with the intracluster medium
itself, and provide direct evidence for the existence of relativistic
particles and G magnetic fields in galaxy clusters (see Ferrari et al.
ferrari08 (2008) for a recent review).
The giant radio halo in RXCJ 2003.5–2323 was discovered thanks to
observations carried out at 610 MHz with the Giant Metrewave Radio Telescope
(GMRT) as part of the GMRT Radio Halo Survey (VGB07 and venturi08 (2008),
hereinafter VGD08), devoted to a statistical study of diffuse radio emission
in a complete sample of galaxy clusters in the redshift range z=0.2–0.4.
With a largest linear size of 1.4 Mpc and a total radio power of
logP (W Hz-1)= 25.53, this source is among the largest,
most powerful and most distant halos known to date.
The radio halo in RXCJ 2003.5–2323 has a complex morphology,
with clumps and filaments extending over hundreds of kpc, an uncommon
feature of radio halos, which generally show a fairly regular and homogeneous
radio brightness distribution (VGB07).
Its peculiar radio emission is reminiscent of the giant radio halo in A 2255
(z=0.08), whose emission has a filamentary structure, with a typical length of
kpc and fractional polarization at levels of
(Govoni et al. govoni05 (2005)). So far A 2255 is the only known radio halo
with polarized emission.
The origin of giant radio halos in clusters has long been debated, since the life–time of the relativistic electrons responsible for the synchrotron radio emission is much shorter than the diffusion time necessary to cover their Mpc extent, therefore some form of re–acceleration is invoked. Among the possible models provided so far, the re–acceleration scenario (Brunetti et al. brunetti01 (2001); Petrosian petrosian01 (2001)), which requires that electrons are in–situ re–accelerated by turbulence injected in the intracluster medium (ICM) by a recent or still ongoing cluster major merger event, has been recently given support (Feretti feretti03 (2003); and Brunetti brunetti08 (2008) and Cassano cassano09 (2009) for recent reviews).
A connection between radio halos and mergers is suggested by radio
observations. Indeed, an analysis of the clusters with
sensitive radio and X–ray imaging shows that all clusters hosting a radio
halo show signs of ongoing mergers, while those without
may be either perturbed or relaxed (Buote buote01 (2001); Govoni et al.
govoni04 (2004); VGD08 and references therein).
In the case of RXCJ 2003.5–2323, the sparse information available
in the literature and public archives, both in the X–ray and optical bands,
was insufficient to derive its dynamical properties (VGB07).
In order to test the merger–halo connection, we carried out Chandra
X–ray and ESO New Technology Telescope (NTT) optical observations, to
study the dynamics of the ICM (which represents the collisional part)
and of the cluster galaxy population (essentially collisionless).
Moreover, we observed the cluster with the GMRT at 240 MHz and with the
Very Large Array (VLA) at 1.4 GHz, in order to derive the radio spectral
properties of the halo.
In this paper we report on the new multi–band observations. The radio observations and data reduction are described in Sec. 2, and their results and analysis are reported in Sec. 3; the Chandra observations and analysis are described in Sec. 4; the ESO–NTT optical observations are presented in Sec. 5; results are presented and discussed in Sec. 6; summary and conclusions are given in Sec. 7.
We adopt the CDM cosmology with H0=70 km s-1 Mpc-1, and . At the redshift of RXCJ 2003.5–2323 (z=0.317) this cosmology leads to a linear scale of kpc. The spectral index is defined according to S. All the error ranges are 90% confidence interval, unless stated otherwise.
2 Radio observations and data reduction
In order to derive the spectrum of the giant radio halo in RXCJ 2003.5–2323 with at least three data points and to investigate its polarization properties, we observed the cluster at 1.4 GHz with the VLA and at 240 MHz with the GMRT. The details on all the observations are summarized in Tab. 2, where we provide the observing date, frequency, total bandwidth, total time on source, half power bandwidth (HPBW) and rms level (1) in the full resolution images, u–v range and largest detectable structure (LDS).
| Telescope | Observation | t | HPBW, p.a. | rms | u–v range | LDS | ||
|---|---|---|---|---|---|---|---|---|
| date | (MHz) | (MHz) | (min) | (full array , , ∘) | (Jy b-1) | (k) | (′) | |
| VLA–CnB | 9, 30 Oct 2006 | 1400 | 25 | 540 | 12.6 9.2, 85 | 20 | 0.27–26.5 | 7 |
| GMRT | 3 Jun 2007 | 240 | 8 | 240 | 31.610.8, 52 | 290 | 0.04–20.5 | 44 |
2.1 VLA 1.4 GHz observations
The 1.4 GHz observations were carried out in October 2006 with the VLA in the hybrid CnB configuration in order to optimize the u–v coverage at the low declination of the source. We observed the halo in two different runs, for a total integration time of 9 hours on source (Tab. 2). The standard polarization mode at 1.4 GHz was used during the observations. The data were collected in spectral–line mode in order to better filter out the radio frequency interference in the observing band, and properly image the whole cluster field with wide–field imaging. We used 8 channels for each of the two IFs, centered at 1385 MHz and 1465 MHz, with a total bandwidth of 25 MHz/IF. 3C 286 and 3C 343 were observed for the bandpass and primary flux density calibration, and for the calibration of the polarization electric vector. The phase calibration was obtained from the nearby calibrator 1923–210, while multiple observations of 1949–199 over a large range of parallactic angles were used to calibrate the instrumental polarization. Calibration and imaging were performed using the National Radio Astronomy Observatory (NRAO) Astronomical Image Processing System (AIPS) package.
The datasets from the two different days were calibrated separately. After bandpass calibration, the 8 channels/IF of each dataset were averaged to 1 single channel of 22 MHz. Each dataset was self–calibrated in phase only, implementing the wide–field imaging faceting technique to compensate for non–coplanarity. We used a total of 18 facets to cover the primary beam area and bright outlying sources. The final self–calibrated datasets were then combined together to produce the final images.
Both uniform and natural weighting were used for the total intensity image I, and for the images in the Stokes parameters Q and U. The polarized intensity images were derived from the Q and U images. A high sensitivity (1 Jy b-1) was achieved in our final full resolution I image (Tab. 2). The sensitivity of the U and Q images is 1= 11 Jy b-1. The residual amplitude errors are 5%.
2.2 GMRT observations at 240 MHz
RXCJ 2003.5–2323 was observed using the GMRT at 240 MHz in June 2007 for a total integration time of 4 hours (Tab. 2). The observations were performed in spectral–line mode using the upper side band (USB) with 128 channels, with a spectral resolution of 62.5 kHz/channel. The total observing band is 8 MHz. During the observations a number of antennas in the East arm was not available due to a power outage. This led to a very asymmetric beam in the final images produced using the full array (Tab. 2).
The data calibration and reduction was carried out using AIPS. The bandpass calibration was performed using the primary calibrator. Removal of radio frequency interference (RFI) was carried out using the task FLGIT in AIPS, and by a subsequent careful editing of residual RFI (see Giacintucci et al. giacintucci08 (2008) for details). The central 84 channels were averaged to 6 channels of 0.9 MHz each after bandpass calibration in order to reduce the size of the dataset, and at the same time to minimize the bandwidth smearing effects within the primary beam. Given the large field of view of the GMRT, 25 facets covering a field were used during the imaging in the self–calibration process. After a number of phase self–calibration cycles, the final dataset was further averaged from 6 channels to 1 single channel111Bandwidth smearing is relevant only at the outskirts of the wide field, and does not significantly affect the region presented and analysed here.. Despite the limited number of available antennas, we achieved a sensitivity level of 1=290 Jy b-1 in the full resolution image (Tab. 2). The residual amplitude errors are of the order of 5%.
3 The giant radio halo
3.1 Morphology at 1.4 GHz
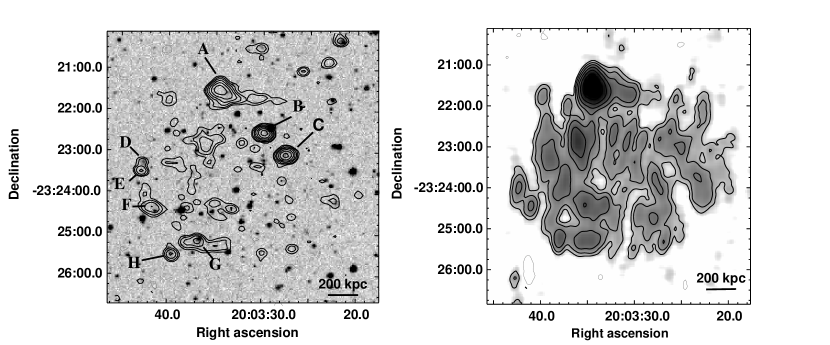
The VLA full resolution image at 1.4 GHz of the central region
of RXCJ2003.5–2323 is presented in the left panel of
Fig. 1. The radio contours are overlaid
on the POSS–2 red optical image to highlight the discrete radio
sources in the cluster region (labelled from A to H), which were
also detected in the resolution image at 610
MHz (see Fig. 6 in VGB07). All sources have an optical association,
except source A which has no clear counterpart on the POSS–2 image.
The nature of A is unclear, as it will be briefly discussed in Sect.
3.4.
Given the high sensitivity of the image,
the brightest regions of the diffuse emission from the central part of the
radio halo are already clearly visible, despite the inadequate angular
resolution. An image of the halo tapered to a resolution of
is given in the right panel of
Fig. 1. The image was obtained after subtraction
of the optically identified radio sources (i.e. B to H).
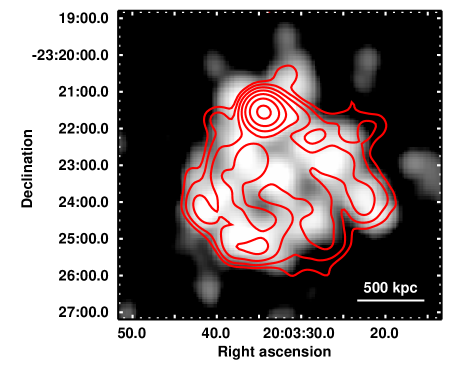
The halo extends on a total scale of , corresponding to a liner size of 1.4 Mpc, in very good agreement with the source size at 610 MHz. As observed with the GMRT at 610 MHz (VGB07), the source exhibits a complex and inhomogeneous structure, characterized by bright clumps and filaments of emission (significant at the level of ). In Fig. 2 we compare the halo at 610 MHz (grey scale) and at 1.4 GHz (red contours). The images were produced using the same u–v range (0.2–10 k), and restored with the same beam of 35 35′′. The overall size and shape of the source at these two frequencies are in general agreement, however the details of the halo surface brightness distribution, i.e. position of peaks and clumps, differ in the two images. Most likely, such discrepancy is both observational and intrinsic, i.e. partly due to the different sensitivity and u–v coverage of the two observations, and partly due to a patchy distribution of the spectral index.
3.2 The radio halo polarization at 1.4 GHz
The inhomogenous surface brightness distribution of the giant radio halo in RXCJ 2003.5–2323 is reminiscent of the morphology of the halo in A 2255, where polarized filaments of emission were detected by Govoni et al. (2005) with the VLA at 1.4 GHz, with fractional polarization is of the order of . The upper limit to the polarized emission in the faintest regions of the halo is of the order of .
We used our VLA 1.4 GHz polarimetric observations (Tab. 2) to search for possible polarized emission associated with the substructures in the surface brightness distribution of the radio halo in RXCJ 2003.5–2323. We obtained images of the linear polarized intensity from the full resolution Q and U images (), as well images tapered to a resolution of the order of . We did not detect any significant polarized signal in the source. The upper limit (1Jy bħ-1) to the fractional polarization is in the brightest regions of the halo (i.e. clumps and filaments) and in the faintest regions, where the average total intensity emission is about 0.15 mJy. This is consistent with the polarization properties of radio halos, which are unpolarized, with upper limits of the order of few percent (Govoni et al. 2005), and confirms that A 2255 is an exceptional case.
3.3 Morphology at 240 MHz
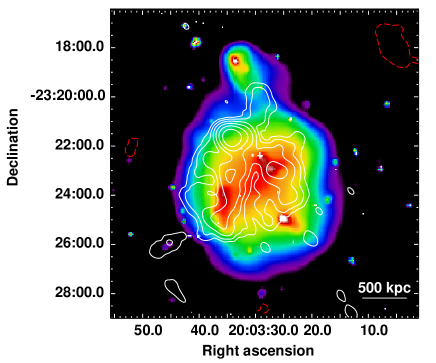
In Figure 3 we present the image of radio
halo at 240 MHz, after subtraction of the individual radio
galaxies. The image is overlaid with the X–ray emission from
Chandra (see Sect. 4 for details).
The 240 MHz image has been convolved with a circular beam with
HPBW=35′′ and has a sensitivity of 1=400 mJy b-1.
The morphology of the halo at this frequency is very similar to what
is observed at 610 MHz and 1.4 GHz, both in the total extent and in the
brightness distribution (Fig. 2).
The only feature which differs in the two images is a filament of radio
emission, detected in the upper portion of the source, which departs
from source A and extends
toward the North for ( kpc). Such filament, barely
visible at 610 MHz, and almost undetected at 1.4 GHz
(Fig. 2), has a steep spectrum, well represented
by a single power law with =1.8.
Very little can be said about this feature at this stage, but it deserves
further investigation.
3.4 General properties of the radio halo
The overall extent and shape of the radio halo in RXCJ 2003.5–2323 are very similar at 240 MHz, 610 MHz and at 1.4 GHz. In Tab. 3 we summarize the main observational properties. All the given flux densities were obtained from images of comparable resolution (35′′), and include the contribution of source A (Fig. 1, left panel, see also Sec. 3.1). In particular, the total flux density at 1.4 GHz was measured on the low resolution image in Fig. 2. The derived total radio power at 1.4 GHz is logP (W Hz-1)= 25.09. This value is consistent with the power of other known radio halos hosted by clusters of similar X–ray luminosity, and in agreement with the P – LX correlation observed for clusters with giant radio halos (e.g., Cassano et al. cbs06 (2006); Brunetti et al. brunetti07 (2007) and VGB07).

The spectrum of RXCJ 2003.5–2323 derived between 240 MHz and 1.4 GHz
is shown in Fig. 4. It can be fitted with a single power law
with spectral index (solid line
in the figure), consistent with the spectral index measured in
the 240–1400 MHz range (Tab. 3), and
in line with the typical values
reported in the literature for the class of giant radio halos (i.e.
1.2–1.3; e.g. Feretti 2005).
The spectral index distribution across the radio halo did not provide
significant results in any frequency interval, due to the substantially
different u–v coverages, which provided a patchy spectral index image with
random variations around the average value.
The spectrum of source A, derived with flux density measurements obtained from the full resolution images at each of the available radio frequencies, is consistent with that of the radio halo, its spectral index being (see Fig. 4). The nature of this source is unclear. It is extended in the East–West direction, for a total projected size of the order of 410 kpc, if located at the cluster distance. Its morphology is similar to that of cluster radio galaxies; at the same time, the lack of a counterpart in the optical and in the near infra–red (after inspection of the SuperCOSMOS Sky Survey and of the Two Micron All Sky Survey respectively), as well as the lack of any point–like feature in the X–ray surface brightness (see Sect. 4) suggest that it might be a peculiar bright spot in the radio halo.
We can give an estimate of the magnetic field associated with the radio halo using the equipartition equations with a low energy cut–off of in the particle energy spectrum (Brunetti et al. brunetti97 (1997)), we obtain G (see Tab. 3).222Note that if we adopt the standard equipartition equations (computed in the frequency range 10 MHz–100 GHz), we obtain G. This is an average value, and should be considered as indicative of the cluster magnetic field.
| S (mJy) | 352 |
|---|---|
| S (mJy) | 975 |
| S (mJy) | 36018 |
| 1.320.06 | |
| logP (W Hz-1) | 25.09 |
| Linear size (Mpc) | 1.4 |
| B (G) | 1.7 |
VGB07.
4 X–ray Chandra observations and analysis
RXCJ2003.5–2323 was observed by Chandra on August 2 2007 with the ACIS‐-I detector in very faint (VF) mode. The details on the observation are listed in Tab. 4.
| Observation mode | ACIS–I, 01236 |
| Observing date | 2007 August 2 |
| Total exposure | 50.1 ks |
| Effective exposure | 49.8 ks |
The data were re–processed from the level 1 event files using the version 3.4 of the Chandra Interactive Analysis of Observations (CIAO) package and calibration database CALDB 3.4.2. The standard filtering was performed, excluding known bad columns, hot pixels, chip node boundaries, and events with ASCA grades 1, 5, and 7. We also applied the VF mode filtering, which significantly reduces the level of the particle background. The data were cleaned for flaring episodes using the recommendations given in Markevitch et al. (2003) leading to a useful exposure of 49.8 ksec. For the background subtraction we used the period D compilation of blank field observations provided by Markevitch333http:cxc.harvard.educontribmaximacisbgdata. Following the prescription of Markevitch et al. (2000), the blank-field dataset was first processed identically to the dataset and then reprojected onto the sky using the aspect information and the tool make_acisbg. The resulting background file was finally re–normalized to take into account the short–term and secular intensity variation of the changed particle background which dominate the spectra at high energies. This was done by calculating the ratio of the count rates of the observation to the blank-field in the energy band of , where the Chandra effective area is nearly zero, which gives a normalization factor of 1.41.
4.1 Image Analysis
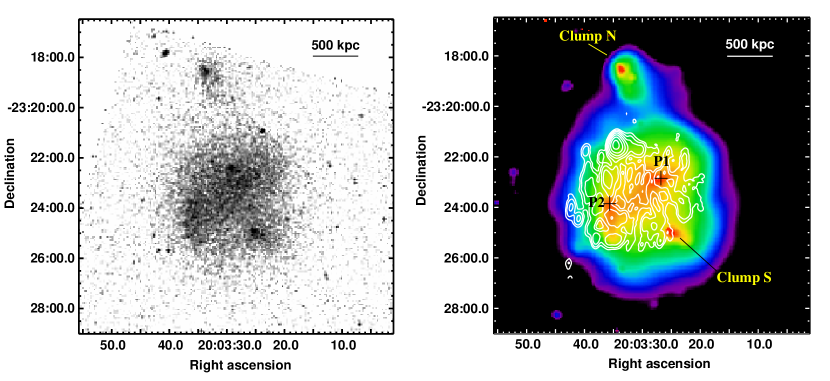
The Chandra photon image of RXCJ 2003.5–2323 in the 0.5–2.5 keV band is presented in the left panel of Fig. 5. The image is background subtracted and divided by the exposure map. In the right panel we show the smoothed Chandra image in the 0.5-5.0 keV band after the subtraction of the point sources, with the radio contours at 1.4 GHz overlaid.
The cluster X–ray surface brightness distribution is clearly complex and disturbed. The central part is elongated in the South–East/North–West direction. Two peaks of emission, labelled as P1 and P2, are separated by 2.5′ ( 700 kpc) along this axis. A bright compact clump is located in the northern region (clump N), at a projected distance of 1.2 Mpc from P1. A second sub–structure (clump S) is detected at 600 kpc South of P1.
Except for an overall agreement in the shape of the radio and of the X–ray emission, there is very little coincidence between the radio and the X–ray images: the S–E/N–W elongation of the inner X–ray brightness distribution, has no corresponding features in the radio halo emission, and the two peaks P1 and P2 have no association with discrete radio sources. Moreover, the superposition between the radio and the X–ray emission indicates that the two clumps N and S have no radio counterpart. The only possible hint of connection with clump N is given in Fig. 3, which shows that the radio halo emission at 240 MHz is characterized by a steep spectrum filament extending from source A towards clump N.
4.2 Spectral analysis
The spectral analysis was carried out using the version 12.2 of the X–Ray Spectral Fitting Package (XSPEC). After the detection and removal of the point sources within the cluster emission, we extracted the spectra from the selected regions of both the observation and the background. We then created the relative Redistribution Matrix File (RMF) and Auxiliary Response File (ARF). The spectra were grouped in order to have at least 20 counts per channel, and fitted using XSPEC with an absorbed single temperature thermal model (WABS*MEKAL). The fit was performed in the energy range keV.
We determined the global properties of the cluster by extracting the spectrum from a circular region with radius r=4′ (i.e. 1.1 Mpc) centered on the surface brightness centroid (RAJ2000= 20h 03m 29s, DECJ2000=23∘ 23′ 36′′). The fit was made by fixing the redshift to z=0.317 and the hydrogen absorption column to the galactic value ( cm-2) and letting the chemical abundance and the temperature free to vary. We found T=9.1 keV and Z=0.270.10. We also let free to vary and found that the fitted value of cm-2 is perfectly consistent with the galactic value. The temperature found for this cluster is consistent with the values known in the literature for clusters hosting giant radio halos (Cassano et al. cbs06 (2006)).
4.3 Hardness Ratio Image
Given the complex structure of the X–ray surface brightness distribution of the cluster (Fig. 5), we searched for possible substructures in the gas temperature distribution. We produced the hardness ratio image of the cluster using the two photon images in the 0.2–2.5 keV (soft) and 2.5–7.0 keV (hard) energy bands, both background subtracted and vignetting corrected. After removing the point sources, the soft and hard images were adaptively smoothed, using the same smoothing scale pattern (map). The smoothing scale map was obtained by applying the CIAO command csmooth to the soft image requesting a minimum and a maximum significance of the signal under the smoothing kernel of and , respectively. The resulting smoothed images were combined as (soft – hard)/(soft + hard) to obtain the hardness ratio image shown in Fig. 6. The contours are obtained from the smoothed soft image. Finally we converted the hardness ratio values in the corresponding gas temperatures by simulating a number of absorbed single temperature thermal models with XSPEC. The result of the conversion is reported on the color bar of Fig. 6.
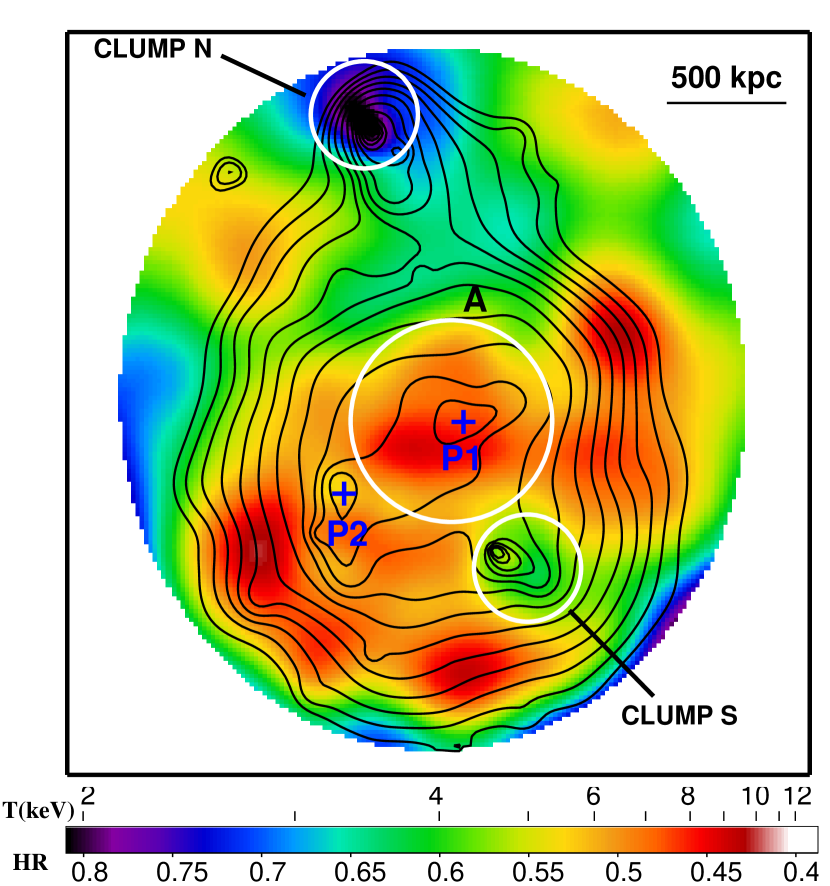

The hardness ratio map clearly shows that RXCJ 2003.5–2323 has a complex thermal structure: it lacks a central cool core, and presents a number of hot clumps. The brightest innermost cluster region is hot, with T 8–9 keV. The two X–ray peaks P1 and P2 have slightly different temperatures: the western peak P1 has while the eastern peak P2 has . Clump N, instead, is much colder ( 3 keV) than the average temperature of the cluster, while clump S has a temperature of keV. A number of other peaks are visible in Fig. 6, however due to the low number of counts they are less significant.
To test the significance of the substructure observed in the hardness ratio image, we also extracted the spectra from the white circles shown in Fig. 6. The results, summarized in Table 5 and shown in Fig. 7, clearly show that the detected thermal structures are highly significant, confirming the unrelaxed status of this cluster. We point out that the temperatures given for P1 and P2 should be considered as estimates, which we derived from the hardness ratio image, since the statistics here is too low to fit them as separate regions.
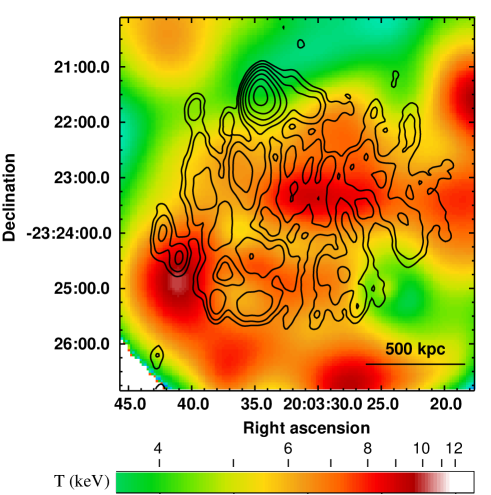
As a further comparison in our analysis, in Fig. 8 we overlaid the radio halo contours at 1.4 GHz to the hardness ratio image, and concluded that the two images are overall independent.
| Region | T | Null–hyp. | |
|---|---|---|---|
| (keV) | prob. | ||
| Clump N | 2.2 | 0.72 | 0.784 |
| Clump S | 5.1 | 0.69 | 0.747 |
| Region A | 10.2. | 0.99 | 0.544 |
5 Optical observations
We observed the cluster in the night of 06/04/2007 with the EMMI instrument of the New Technology Telescope (NTT) at the ESO La Silla Observatory (Chile). The exposure time was 300 seconds with the R Johnson-Cousin filter. The image was analysed with the standard bias subtraction and flat–fielding, and the SEXTRACTOR code (Bertin & Arnouts bertin96 (1996)) was used to extract a source catalogue. The magnitude calibration was done on the basis of the reference stars present in the field. We extracted 1059 objects with the SEXTRACTOR parameter ”classstar” 0.2 (to eliminate star contamination) and with (value at which the magnitude histogram starts to decrease).
We studied the substructure by means of the DEDICA algorithm (Bardelli et al. bardelli98 (1998); Pisani pisani96 (1996)), and restricted the analysis to the projected two dimensional distribution of the galaxies. The presence of background (i.e. non–cluster) galaxies is represented as a flat distribution within the image, therefore they do not influence the grouping algorithm and can be considered as an additional contribution to the noise. In order to increase the signal, we weighted all galaxies with their magnitude, if . This approach allows to emphasize the presence of the most likely cluster members (the brightest central objects) with respect to the fainter background ones. In practice, assuming an approximately constant mass–to–light ratio, our light weigthed procedure provides a better estimate of the mass distribution.
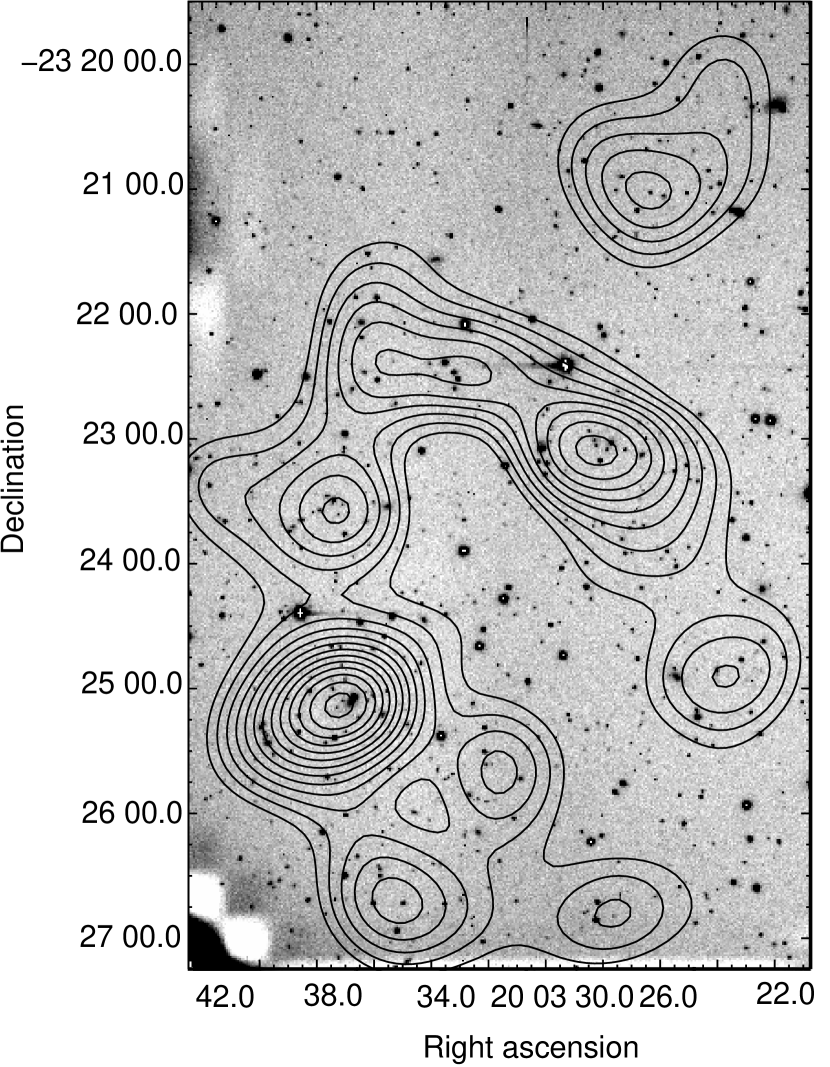
In Fig. 9 we show the luminosity weighted isodensity contours superimposed to our R image. All peaks defined by more than three isodensity contours are significant at the level. The richest condensation is located at RA= and DEC= and is centered on a galaxy, which could be considered the Brightest Cluster Galaxy. The second one is located at RA= and DEC=, at (corresponding to Mpc) from the main one. Considering a circle of 0.8 arcmin around the centres of these two condensations, the enclosed luminosty density of the Western group is % that of the Eastern one.
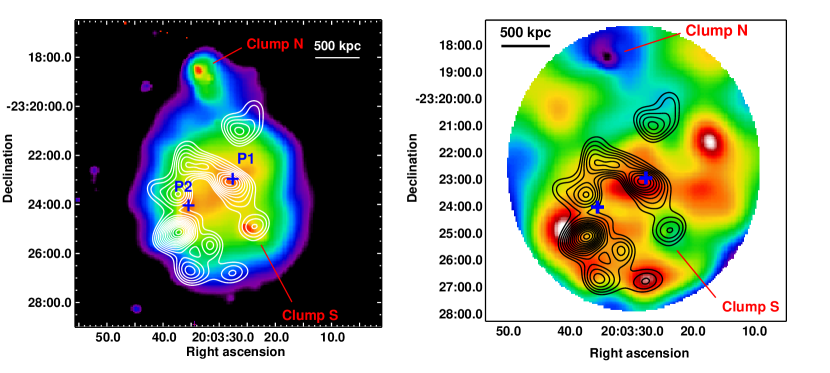
Inspection of the overlay between the X–ray surface brightness
distribution and the optical luminosity weighted contours, given in the left
panel of Fig. 10, is very insightful. The central
X–ray elongation and the two main optical condensations are aligned
along the same axis. The X–ray peak P1 is coincident with the Western optical
group, while there is an offset between P2 and the Eastern most massive
optical condensation.
An optical group is found in coincidence with clump S, while
no optical overdensity was found in coincidence with the X–ray clump N, as
clear from the left panel of Fig. 10.
The right panel of Fig. 10 shows the luminosity-weighted
isodensity contours overlaid on the hardness ratio image. The two main
optical condensations show an offset with respect to the peaks in the hardness
ratio.
The comparison between the optical image and the radio halo shows that no features in the radio halo are detected in coincidence with the main optical condensations.
The redshift of this cluster was estimated by Böhringer et al. (2004) on the basis of four galaxies and turned out to be z=0.3171. During our observing run, we obtained the spectra for 5 more cluster galaxies: the mean redshift of RXCJ 2003.5–2323 resulted to be , consistent with the published value assuming a similar error for the literature data.
6 Discussion
Our multifrequency study of the cluster of galaxies RXCJ 2003.5–2323 confirms that it is in a complex dynamical state, and provides important pieces of information for our understanding of the origin of its giant radio halo, whose discovery was reported in VGB07. The main observational results derived from our radio analysis can be summarized as follows:
-
(1)
the high sensitivity GMRT and VLA radio observations confirm that it is one of the largest, most powerful and most distant giant radio halos known so far;
-
(2)
the radio halo is characterized by a very irregular surface brightness distribution, with clumps and filaments;
-
(3)
the synchrotron radio spectrum is well fitted by a single power law with a spectral index , consistent with the typical values of the radio halos known in the literature;
-
(4)
it is unpolarized, with an upper limit of the order of 2–3 %.
In the following sections we will discuss the multiband properties of RXCJ 2003.5–2323 and the possible origin of its radio halo in the framework of the re–acceleration scenario.
6.1 Dynamical state of the cluster and the radio halo/cluster merger scenario
Radio halos are always found in merging galaxy clusters, and this observational evidence provides strong constraints to the theoretical models for the formation of such structures. The X–ray and optical analysis based on our observations suggests that also RXCJ 2003.5–2323 hosts a cluster merging event. In particular the main X–ray observational properties are:
-
–
the X–ray brightness distribution shows substructure, as typical in dynamically unrelaxed clusters. It is elongated in the NW–SE direction, with two peaks, P1 and P2, aligned in this direction, and separated by 0.8 Mpc. Two more clumps of emission, N and S, have been identified in the outer regions of X–ray emission, aligned in a direction almost orthogonal to that of P1 and P2;
-
–
the cluster X–ray temperature, T=9.1 keV, is consistent with what is found in clusters hosting giant radio halos;
-
–
temperature gradients were detected in the X–ray gas distribution. The central region, peaked in P1, has a temperature as high as 10.2 keV, while the temperature in the two clumps N and S drops to 2.2 and 5.1 keV respectively. This result is further strengthened by the complex thermal structure revealed by the hardness ratio analysis.
The optical analysis provides the following results:
-
–
our spectral data confirm that the cluster is located at a redshift ;
-
–
the galaxy luminosity weighted distribution shows two condensations, aligned along the NW–SE direction. The NW peak is located in coincidence with peak P1 in the X–ray surface brightness distribution, while the SE peak, which is also the most massive, is slighlty offset with respect to P2, though aligned along the same direction;
-
–
a filament of galaxies connects the two optical peaks. An optical condensation was found in concidence with clump S, while we did not find any optical overdensity associated with clump N, based on our single band image.
Comparison of the optical and X–ray properties is also suggestive of
dynamical activity. In particular, the shift between the location of the
X–ray peak P2 and the most massive optical condensation, clearly visible
in the left panel of Fig. 10, is intriguing, as well as the relative shifts
among P2, the optical clump and the peak in the hardness ratio image.
We thus conclude that the overall optical and X–ray properties of
RXCJ 2003.5–2323 lead to a plausible scenario where a major merging is
taking place in this cluster.
An optical/X–ray shift
has been observed in the bullet cluster (1E 0657–56, Markevitch et al.
markevitch04 (2004) and references therein) and in MACS J0025.4–1222
(Bradac̆ et al. bradac08 (2008)), and has been interpreted as the result
of a galaxy sub–cluster exiting the core of the main cluster, just ahead
of the gas. In the case of RXCJ 2003.5–2323 it is possible that
the main optical condensation is just emerging South–East after the
merger, leaving the gas behind.
6.2 Origin of the radio halo morphology
Giant radio halos typically exhibit a fairly regular and homogeneous morphology, with a flux density distribution usually peaked at the cluster centre, and smoothly decreasing towards the cluster periphery (e.g. A 2163; Feretti et al. feretti01 (2001)). The shape and extent of the radio halo in RXCJ 2003.5–2323 is in agreement with the X–ray surface brightness emission, however its radio flux density distribution shows clumps and filaments at all frequencies (Figs. 1, 2 and 3). This morphology poses the question of the connection with the ICM distribution.
In the framework of the re–acceleration model powerful giant radio halos at should be hosted by massive, highly turbulent and dynamically disturbed clusters (Cassano, Brunetti & Setti 2006).
The clumpy radio emission in RXCJ 2003.5–2323 may be driven both by the
distribution of the emitting relativistic particles, and by that of the
magnetic field intensity in the ICM.
RXCJ 2003.5–2323 is at relatively high redshift, where
Inverse Compton losses are strong and acceleration could produce
synchrotron emission preferentially in regions with ,
where is defined as G. As a matter of
fact, synchrotron emission from lower would require the
acceleration of electrons with significantly lower energy, while larger
would increase synchrotron losses making the acceleration process less
efficient.
At the same time, RXCJ 2003.5–2323 could be in an early merging phase and
both the magnetic field and turbulence may have a filamentary structure,
which are traced by the synchrotron radiation.
Another interpretation of the origin of the Mpc scale diffuse emission in RXCJ 2003.5–2323 is that it is a relic seen in face–on projection. However, this possibility seems very unlikely, due to the lack of polarization and to the overall spatial connection between the radio emission, the X–ray surface brightness and the galaxy distribution.
7 Summary and conclusions
In this paper we presented a multifrequency study of the galaxy cluster RXCJ 2003.5–2323, which hosts one of the most distant, largest and most powerful radio halos known to date, with the aim of testing the cluster merger–radio halo connection.
The radio halo was imaged and analysed at high sensitivity using the VLA at 1.4 GHz, in combination with new GMRT data at 240 MHz and previously published GMRT data at 610 MHz (VGB07). The halo extends on a scale of the order of 1.4 Mpc at all frequencies, and its overall radio morphology is very similar in all images. The most striking feature of this source is its complex and uncommon radio brightness distribution, with clumps and filaments of emission extending on scales of the order of hundreds of kpc, clearly visible at all radio frequencies. This radio morphology is very different from what is found in giant radio halos, whose radio flux density generally peaks at the cluster centre and smoothly decreases towards the outskirts.
Our X–ray and optical analysis suggest that the cluster is in a merging stage. In particular, our Chandra observations show that the cluster is very unrelaxed, with substructure in the X–ray surface brigthness distribution, in the temperature and hardness ratio. An optical analysis based on ESO–NTT observations shows that the galaxy distribution is characterized by two peaks connected by a filament of galaxies, the South–Eastern peak considerably more massive than the North–Western one. The galaxy distribution is in reasonable agreement with the substructure in the X–ray surface brightness emission and in the hardness ratio image. A misplacement between the X–ray peak P2 and the main optical condensation suggests that the latter might be emerging South–East after the merger event, leaving the gas behind.
The clumpy and filamentary morphology of the radio halo was discussed in the
framework of the re–acceleration model. Due to the relatively high redshift
of the cluster, which could be in an early merging phase, it is likely that
the observed clumps and filaments trace the peaks of the magnetic field
intensity and turbulence in the cluster.
Acknowledgements.
We thank the staff of the GMRT for their help during the observations.
The GMRT is run by the National Centre for Radio Astrophysics of the Tata
Institute of Fundamental Research. The optical data were obtained with the
European Southern Observatory NTT telescope, La Silla, Chile, program
079.A–0191(A). We acknowledge financial contribution
from the Italian Ministry of Foreign Affairs, from MIUR grants PRIN2004,
PRIN2005 and 2006, from PRIN–INAF2005 and from contract ASI–INAF I/023/05/01.
References
- (1) Bardelli, S., Pisani, A., Ramella, M., et al., 1998, MNRAS, 300, 589
- (2) Bertin, E., Arnouts, S., 1996, A&AS, 117, 393
- (3) Böhringer H., Schuecker P., Guzzo, L., et al., 2004, A&A, 425, 367
- (4) Bradac̆, M., Allen, S.W., Treu, T., et al., 2008, ApJ, 687, 959
- (5) Brunetti G., Setti G., & Comastri A., 1997, A&A, 325, 898
- (6) Brunetti G., Setti G., Feretti L., Giovannini G., 2001, MNRAS, 320, 365
- (7) Brunetti, G., Venturi, T., Dallacasa, D., et al., 2007, ApJ, 670L, 5
- (8) Brunetti, G., 2008, in Magnetic Fields in the Universe II, Rev. Mex. Astron. Astrof., Ed. A. Esquivel, in press (arXiv:0810.0692)
- (9) Buote, D.A., 2001, ApJ, 553, L15
- (10) Cassano R., Brunetti G. & Setti G., 2006, MNRAS, 369, 1577
- (11) Cassano, R., 2009, in The Low Frequency Radio Universe, ASP Conf. Ser., Eds. D.J. Saikia, D. Green, Y. Gupta & T. Venturi, in press (arXiv:0902.2971)
- (12) Feretti, L., Fusco–Femiano, R., Giovannini, G., et al., 2001, A&A, 373, 106
- (13) Feretti, L., 2003, in Texas in Tuscany. XXI Symposium on Relativistic Astrophysics, Eds. R. Bandiera, R. Maiolino, F. Mannucci, World Scientific Publishing, p. 209
- (14) Feretti, L., 2005, in X–ray and radio connnections, published electroncally by NRAO, Eds. L.O. Sjouwerman & K.K. Dyer
- (15) Ferrari, C., Govoni, F., Schindler, S., et al., 2008, Space Science Reviews, Vol. 134, p. 93
- (16) Giacintucci, S., Venturi, T., Brunetti, G., et al., 2005, A&A, 440, 867
- (17) Giacintucci S., Venturi T., Macario G., et al., 2008, A&A, 486, 347
- (18) Govoni, F., Ensslin, T.A., Feretti, L., et al., 2001, A&A, 369, 441
- (19) Govoni, F., Markevitch, M., Vikhlinin, A., et al., 2004, ApJ, 605, 695
- (20) Govoni F., Murgia M., Feretti L., et al.. 2005, A&A, 430, 5
- Markevitch et al. (2000) Markevitch, M., Ponman, T. J., Nulsen, P. E. J., et al., 2000, ApJ, 541, 542
- Markevitch et al. (2003) Markevitch, M., Bautz, M. W., Biller, B., et al., 2003, ApJ, 583, 70
- (23) Markevitch, M., Gonzalez, A. H., Clowe, D., et al., 2004, ApJ, 606, 819
- (24) Petrosian V., 2001, ApJ, 557, 560
- (25) Pisani, A., 1996, MNRAS, 278, 697
- (26) Venturi T., Giacintucci S., Brunetti G., et al., 2007, A&A, 463, 937 (VGB07)
- (27) Venturi T., Giacintucci S., Dallacasa D., et al., 2008, A&A, 484, 327 (VGD08)