Identifying the young low-mass stars within 25 pc. I. Spectroscopic Observations11affiliation: Based on
observations collected at the W. M. Keck Observatory and the Canada-France-Hawaii Telescope. The Keck Observatory is operated as a scientific partnership between the California Institute of
Technology, the University of California, and NASA, and was made possible by the generous
financial support of the W. M. Keck Foundation. The CFHT is operated by the National Research Council of Canada,
the Centre National de la Recherche Scientifique of France, and the University of Hawaii.
Abstract
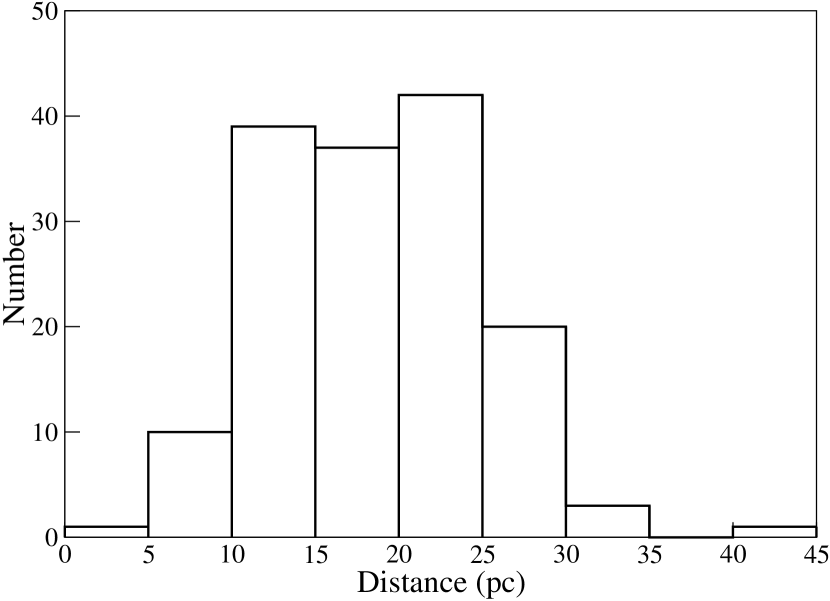
We have completed a high-resolution (R60,000) optical spectroscopic survey of 185 nearby M dwarfs identified using ROSAT data to select active, young objects with fractional X-ray luminosities comparable to or greater than Pleiades members. Our targets are drawn from the NStars 20-pc census and the Moving-M sample with distances determined from parallaxes or spectrophotometric relations. We limited our sample to 25 pc from the Sun, prior to correcting for pre-main sequence over-luminosity or binarity. Nearly half of the resulting M dwarfs are not present in the Gliese catalog and have no previously published spectral types. We identified 30 spectroscopic binaries (SBs) from the sample, which have strong X-ray emission due to tidal spin-up rather than youth. This is equivalent to a 16% spectroscopic binary fraction, with at most a handful of undiscovered SBs. We estimate upper limits on the age of the remaining M dwarfs using spectroscopic youth indicators such as surface gravity-sensitive indices (CaH and K I). We find that for a sample of field stars with no metallicity measurements, a single CaH gravity index may not be sufficient, as higher metallicities mimic lower gravity. This is demonstrated in a sub-sample of metal-rich RV standards, which appear to have low surface gravity as measured by the CaH index, yet show no other evidence of youth. We also use additional youth diagnostics such as lithium absorption and strong H emission to set more stringent age limits. Eleven M dwarfs with no H emission or absorption are likely old (400 Myr) and were caught during an X-ray flare. We estimate that our final sample of the 144 youngest and nearest low-mass objects in the field is less than 300 Myr old, with 30% of them being younger than 150 Myr and 4 very young (10 Myr), representing a generally untapped and well-characterized resource of M dwarfs for intensive planet and disk searches.
1 Introduction
Observational studies of planet formation have been energized by the discovery of young (100 Myr) solar-type stars close to Earth (e.g. Jeffries 1995; Webb et al. 1999; Montes et al. 2001), identified from multiple indicators of youth including chromospheric activity and strong X-ray. The combination of distances, proper motions, and radial velocities has allowed many of these stars to be kinematically linked to coeval moving groups (e.g., Zuckerman & Song 2004; Torres et al. 2008). These young moving groups (YMGs) are several times closer to Earth than the traditional well-studied star-forming regions such as Taurus and Orion (150–500 pc). More importantly, these groups have ages of 10–100 Myr, a time period in stellar evolution that has largely been underrepresented in previous studies. This is expected to be a key epoch for understanding planet formation, coinciding with the end of giant planet formation and the active phase of terrestrial planet formation (e.g. Mandell et al. 2007; Ida & Lin 2008).
While these YMGs have been a boon for observers, the current census has severe limitations — in particular, it is mostly restricted to the higher-mass (AFGK-type) stars and contains very few low-mass M dwarfs. This paucity is striking given that M dwarfs dominate the stellar mass function by number roughly 3 out of 4 stars in a volume-limited sample of the solar neighborhood are M dwarfs (Reid et al. 1995; Bochanski et al. 2008). For instance, in the 12-Myr old Pictoris moving group, 17 of the 44 identified members (Torres et al. 2006) are M dwarfs, whereas we would expect 75% based on the stellar mass function: 60 M dwarfs are missing from this group’s known members.
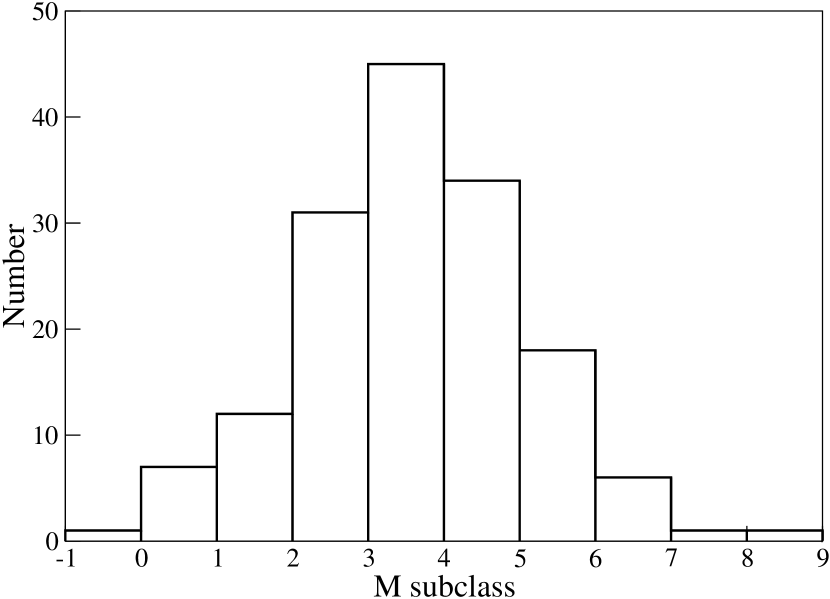
The incompleteness in the current young low-mass census arises from a combination of two factors: (1) Young star searches to date have relied on optical catalogs for distances and/or proper motions, e.g., the Hipparcos and Tycho catalogs (Perryman & ESA, 1997), the former limited to V 7 with parallaxes, while the latter limited to V 7 but without parallaxes. However, M dwarfs are optically faint and thus make a disproportionately small contribution to these catalogs. (2) Until very recently, the only all-sky surveys suited for finding X-ray active stars have been the ROSAT111The Röntgensatellit (ROSAT) was a joint German, US and British X-ray observatory operational from 1990 to 1999. catalogs (Voges et al. 1999, 2000), and since the X-ray luminosities of M dwarfs are 10–300 lower than solar-type stars, ROSAT detections are mostly limited to the nearest, earliest-M stars (Figure 1).
Previous searches for young, X-ray-active, late-type stars focused on a satellite’s detection limits rather than a volume-limited sample. E.g. Riaz et al. (2006) collected low-resolution spectra of 800 M dwarfs (M0 – M5) detected with ROSAT with photometric distances ranging from 3 to 750 pc. They determine their sample to be generally young since the measured coronal activity of most of the stars is higher than that of Hyades members (600 Myrs). Zickgraf et al. (2005) collected high-resolution spectra of 118 ROSAT-selected G, K and M stars extending out to 600 pc and from lithium measurements, estimate that 25% of their sample is near the age of the Pleiades (120 Myr). And more recently, Covey et al. (2008) published a catalog of 348 stars identified from correlating the Chandra X-ray Observatory’s archival data with the Sloan Digital Sky Survey (SDSS). Of these, 36 are newly identified M dwarfs with distances out to 1000 pc and a wide range of X-ray and H luminosities.
The goal of this program is to identify the best possible M dwarf targets for direct imaging searches of extrasolar planets and circumstellar disks. This requires a young, well-characterized, and nearby sample. The proximity is an essential benefit for studies requiring high sensitivity as large distances limit both the linear resolution and available flux with which we can image planets and detect disks. Also, M dwarfs in principle could represent the most common and nearest to Earth hosts of planetary systems, and provide a potentially much larger population of targets than has been studied to date.
It is imperative that we add youth as a criterion to our M dwarf sample as planets cool and fade significantly between 10 Myr and 1 Gyr. For example, the luminosity of a 5 MJup planet drops by 2 – 3 orders of magnitude in this time span, while its effective temperature decreases from 1300 to 400 K (Baraffe et al. 2003). Also, the fraction of debris disks around AFGK, and possibly M stars, decreases significantly by 150 Myr (Rieke et al., 2005; Hillenbrand et al., 2008).
The value of young low-mass stars is demonstrated by the 12 Myr-old star AU Mic, the first robustly identified M dwarf debris disk system (Song et al. 2002; Liu et al. 2004). The AU Mic disk has been the subject of intense scrutiny since its discovery. At a distance of only 10 pc, its disk is seen in scattered light as far as 20″ in radius (Kalas et al., 2004). Adaptive optics and HST imaging of the disk achieves a spatial resolution of 0.4 AU (e.g., Liu et al. 2004; Krist et al. 2005; Fitzgerald et al. 2007) and reveals a rich variety of substructure. The proximity and edge-on geometry of the disk allow for very sensitive studies of the circumstellar gas content (Roberge et al. 2006; France et al. 2007) and searches for transiting planets (Hebb et al. 2007). However, thus far this system remains the singular example of a resolved debris disk around a low-mass star. Thus, the scientific potential of young M dwarfs remains largely untapped due to the very limited current census.
2 Sample Selection
The Two Micron All Sky Survey (2MASS) is optimal for finding low-mass stars, since the SEDs of cool stars peak in the near-IR (e.g. Hawley et al. 2002). However, the infrared passbands provide less distinctive spectral classification of early- and mid-M dwarfs (i.e. M2–M7 dwarfs have () colors which span only 0.2 mag; Reid et al. 2007b) impeding the photometric distance determination. Thus, in order to fully characterize a volume-limited sample of young M dwarfs, a proper motion requirement of 0.18″ yr-1 was implemented, equivalent to a tangential velocity of 21 km s-1 at 25 pc.
We drew 800 targets from the NStars 20-pc census (Reid et al., 2003, 2004) constructed from the 2MASS catalogs (Skrutskie et al. 2006) along with the Lépine et al. (2002) and Lépine & Shara (2005) proper motion catalogs. In addition to these, we included 300 newly-catalogued M dwarfs that exhibit significant proper motion between the POSSI and 2MASS surveys (i.e. the Moving-M sample; Reid et al. 2007a). Reid et al. (2003, 2004, 2007a) used a combination of photometric (i.e. and to largely eliminate stars earlier than M0) and proper-motion methods to identify candidate cool objects, which were subsequently confirmed with follow-up moderate-resolution (R1800) optical spectroscopy. Distances are available either from parallaxes or spectrophotometric relations and are limited to 25 pc from the Sun, good to 15% assuming the stars are single and on the main-sequence (e.g., Reid & Cruz 2002; Cruz et al. 2003). Nearly half of the resulting M dwarfs are not present in the Gliese catalog and have no previously-published spectral types.
As stellar activity is a powerful indicator of youth (open clusters show a consistent and relatively rapid decline in activity with age at a given spectral type; Preibisch & Feigelson 2005), we cross-referenced our total sample of 1103 M dwarfs in the immediate solar neighborhood against the ROSAT All-Sky Survey Bright Source Catalog and Faint Source Catalog (Voges et al., 1999, 2000). Our query was limited to a search radius of 25″ around the 2MASS coordinates, the 2 positional error determined by Voges et al. (1999). This returned 364 sources.
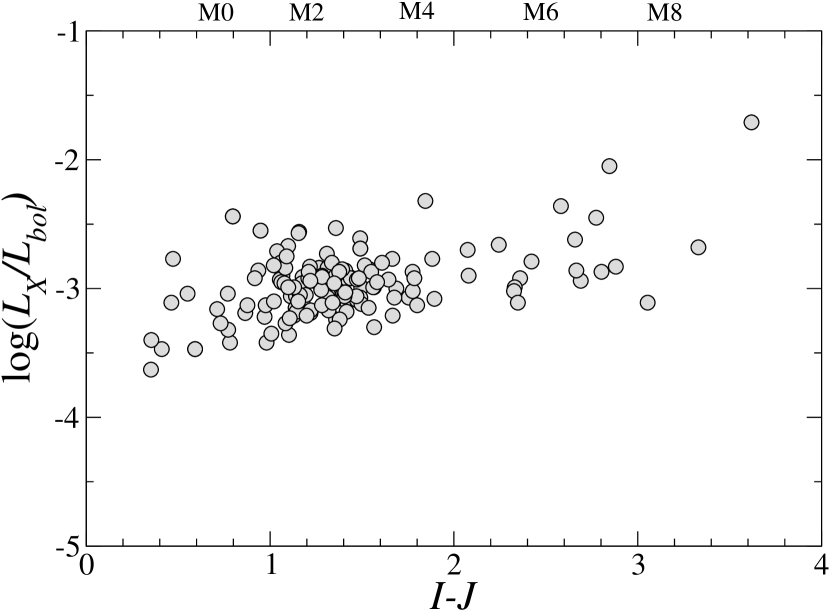
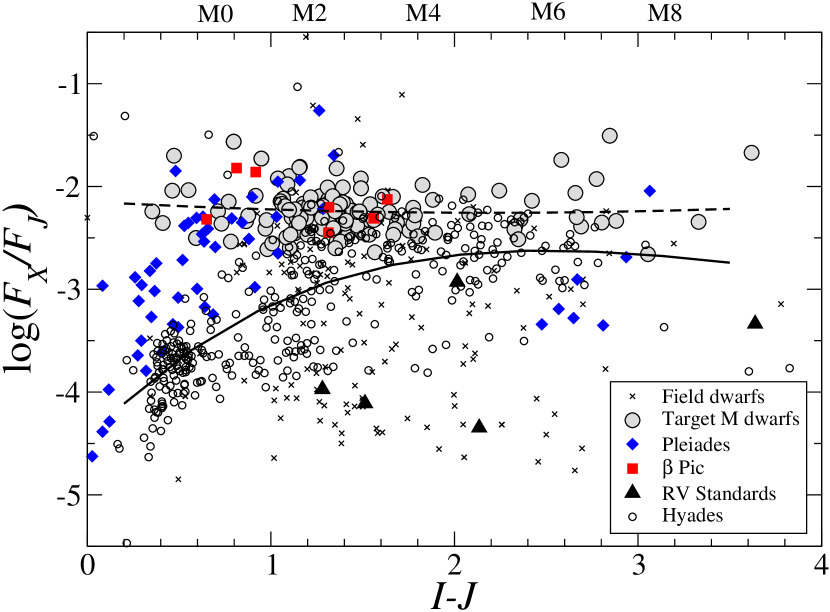
Of these, 196 (18% of the full sample and with a median offset between the ROSAT and 2MASS coordinates of 9″) are strong coronal X-ray emitters with fractional luminosities hovering near the “saturation” level (e.g. Riaz et al. 2006), ranging across all M dwarf subclasses (Figure 1 & 2). Mismatches with other sources would have been easily identified as the fractional X-ray luminosity of normal stars relative to optical magnitudes is always on the order of 0.1 or less, where as other X-ray sources, such as galaxies and quasars have fractional luminosities of 1 or greater (Stocke et al. 1991; Zickgraf et al. 2003). In Figure 3 we plot the fractional X-ray flux, as a function of (), where is the empirically calibrated X-ray flux using the count-rate conversion equation of Schmitt et al. (1995), and is the 2MASS -band flux. Target stars were chosen to have high X-ray emission () comparable to or greater than the fractional luminosities of Pleiades members (120 Myr, Micela et al. 1998) and Pic members (12 Myr, Torres et al. 2006). The 650-Myr-old Hyades stars emit two orders of magnitude less X-ray radiation for early-Ms than the younger samples (Stern et al., 1995). Though data at later spectral types are sparse and the X-ray fluxes of the samples plotted in Figure 3 appear to converge, our targets on average are still significantly stronger X-ray emitters than the late-Ms of the Hyades.
3 The Spectra
We acquired high-resolution échelle spectra of 185 low-mass stars222We were unable secure spectra of 11 of the 196 X-ray sources because they were either too far south to be observed from Mauna Kea and/or too faint, even with the Keck I telescope. over 4 nights with the High Resolution Échelle Spectrometer (HIRES; Vogt et al. 1994) on the Keck I 10-m telescope and over 6 nights with the Échelle SpectroPolarimetric Device for the Observation of Stars (ESPaDOnS; Donati et al. 2006) on the Canada-France-Hawaii 3.6-m telescope, both located on the summit of Mauna Kea.
The relevant properties of the targets confirmed to not be spectroscopic binaries (SB) are listed in Table 1. Three of these 155 M dwarfs do not have ROSAT detections but were nonetheless included in the sample due to previously identified youth indicators. (See Table 2 for details.)
We used the 0.861 slit with HIRES to give a spectral resolution of /58,000. The upgraded detector consists of a mosaic of three 2048 4096 15- pixel CCDs, corresponding to a blue, green and red chip spanning 4900 – 9300 Å. To maximize the throughput near the peak of a M dwarf spectral energy distribution, we used the GG475 filter with the red cross-disperser. The data product of each exposure is a multi-extension FITS file from which we reduce and extract the data from each chip separately.
ESPaDOnS is fiber fed from the Cassegrain to Coudé focus where the fiber image is projected onto a Bowen-Walraven slicer at the spectrograph entrance. With a 20484608-pixel CCD detector, ESPaDOnS’ ‘star+sky’ mode records the full spectrum over 40 grating orders covering 3700 to 10400 Å at a spectral resolution of /68,000. The data were reduced using Libre Esprit, a fully automated reduction package provided for the instrument and described in detail by Donati et al. (1997, 2007).
Each stellar exposure was bias-subtracted and flat-fielded for pixel-to-pixel sensitivity variations. After optimal extraction, the 1-D spectra were wavelength calibrated with a Th/Ar arc. Finally the spectra were divided by a flat-field response and corrected for the heliocentric velocity. The final spectra were of moderate S/N reaching 20 – 50 per pixel at 7000 Å. Each night, spectra were also taken of an A0V standard star for telluric line correction and an early-, mid-, and/or late-M radial velocity (RV) standard, which are listed in Table 3.
The high resolution of the data provides RV measurements to better than 1 km s-1 in almost all cases, which can be used in conjunction with a star’s distance and proper motion to measure its three-dimensional space velocity (UVW). This provides a promising way to determine stellar ages by linking stars kinematically to one of the several known YMGs or associations, which span ages between 8 and 300 Myr (e.g. Zuckerman & Song 2004). However, only 11% of our sample has the required distance precision (10%) from trigonometric parallaxes to unambiguously associate a star with a single YMG. The bulk of our targets have photometric distances (Reid et al. 2002b), which require an iterative analysis similar to the convergence method developed by Torres et al. (2006) to make meaningful conclusions about group membership. This UVW analysis of our ROSAT sample will be presented in a follow-up paper. Though it should be noted that kinematics alone should not be used to identify young M stars, as demonstrated by the lack of ROSAT detections in several of the proposed YMG members by López-Santiago et al. (2006), e.g. HD 233153, HIP 53020, GJ 466, and HIP 51317.
3.1 Culling of the Spectroscopic Binaries
High-resolution spectra are necessary to identify and remove spectroscopic binaries (SBs) from the sample, since tight binaries have enhanced activity which would erroneously suggests youth. To search for single-lined SBs (SB1), we observed two epochs of 65 targets, none of which showed a significant RV variation between visits. This implies that the single-lined binary fraction in our sample is very low, less than 1.5%, and that M dwarf binaries with low mass ratios () are rare. We had originally planned to observe all targets twice, but when it became clear that the SB1 fraction was so low, it was no longer good use of telescope time to continue multi-epoch observations of the entire list. These 65 targets are identified in the last column of Table 1.
To search for multi-lined binaries, we cross-correlated each order between 7000 and 9000 Å of each stellar spectrum with a RV standard of similar spectral type using IRAF’s333IRAF (Image Reduction and Analysis Facility) is distributed by the National Optical Astronomy Observatories, which is operated by the Association of Universities for Research in Astronomy, Inc. (AURA) under cooperative agreement with the National Science Foundation. fxcor routine (Fitzpatrick, 1993). We excluded the Ca II infrared triplet (IRT)444The target stars exhibit Ca II emission that is not present in the RV standards. and regions of strong telluric absorption in the cross-correlation.
We find a low-mass spectroscopic binary fraction, and therefore contamination rate, of 16%. These 30 SBs are composed of 28 SB2s, 1 SB3 and 1 SB4 (Shkolnik et al., 2008), effectively doubling the number of known low-mass SBs and proving that strong X- ray emission is an extremely efficient way to find multi-lined SBs.555These details pertaining to these SBs, i.e., orbital velocities, sin’s, mass ratios, etc., will be published in an upcoming paper. It is possible that up to 4%666This 4% limit is based on the time a close-in binary would spend near conjunction such that the RVs of the two components would not produce a resolved cross-correlation function. of the 90 stars with a single observation are indeed double-lined SBs if the systems were in conjunction at the times of the observation. Combining this with the 1.5% chance of observing an SB1, there are at most a handful of undiscovered SBs in Table 1.
4 Spectral Types
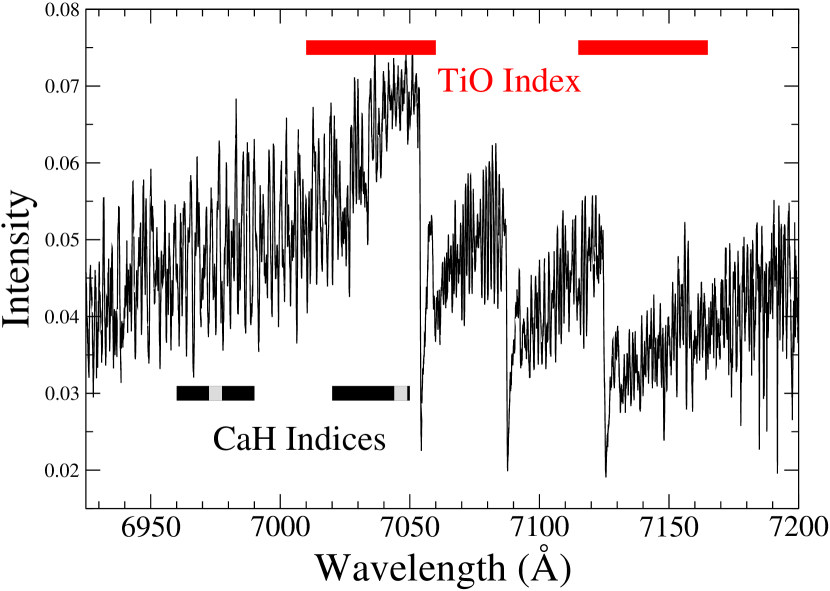
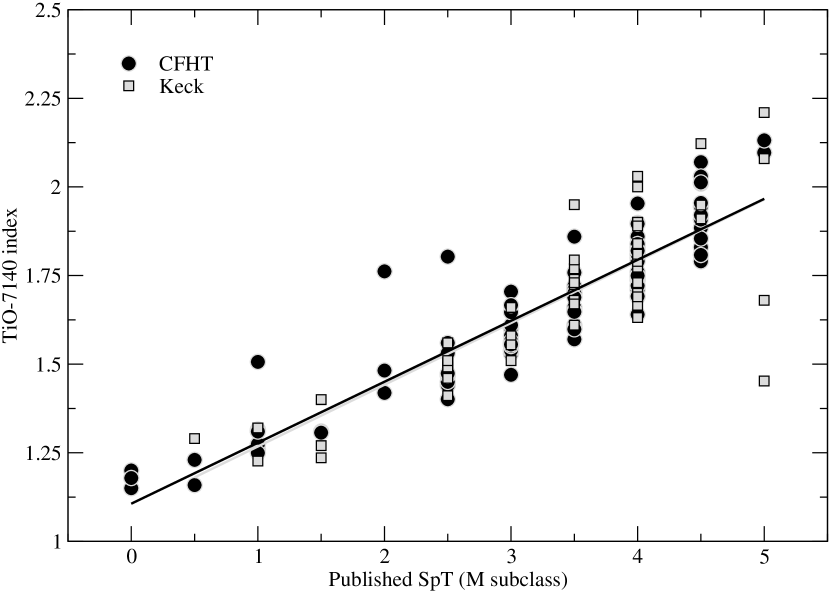
The spectra of M dwarfs are dominated by the strong TiO molecular bands (Figure 4), particularly diagnostic of the star’s temperature.777See Section 5.1.1 for a discussion on metallicity effects. Several TiO band indices have been used throughout the literature to determine the spectral types of M dwarfs, most commonly the TiO5 index of Reid et al. (1995). The more recent TiO-7140 index, defined by Wilking et al. (2005), is the ratio of the mean flux in two 50-Å bands: the ‘continuum’ band centered on 7035 Å and the TiO band on 7140 Å. We chose to use this latter index as our primary diagnostic of SpT because both of the TiO-7140 flux bands appear in a single order in all of our CFHT and Keck spectra.
We calibrated the TiO-7140 index for our data sets against previously measured (Reid et al. 1995) and published ( and references therein; Wenger et al. 2007) spectral types of 136 M dwarfs we had observed, including several RV standards and known members of the Pic moving group. Both the linear fits to the CFHT and Keck data sets for stars with SpT earlier than M6 derive spectral types which agree to better than 0.2 subclasses (Figure 5). We therefore combined the sets to get an average fit for the entire sample. The linear relationship used to convert the TiO-7140 index to SpT for M0 – M5 stars is:
SpT=(TiO, rms= 0.6 (1)
Here, M0 corresponds to SpT=0, M1 1, M2 2, etc. We used this calibration to determine the SpT of the 78 stars in our ROSAT sample which had no previously published spectral types, as well as refine the published values of the others.
We determine the errors of our measurements for the TiO index (and subsequent indices discussed below) by taking the average difference in values determined for the same stars observed on different nights. We have 25 Keck targets888Though we have an additional 19 Keck targets with repeat observations, the seeing on one of the two nights was too poor to measure the TiO and CaH indices. and 21 CFHT targets with repeat observations. The measurement errors of the TiO index are larger for the Keck data than for the CFHT data: 0.061 and 0.015, corresponding to 0.33 and 0.11 M subclasses using Eq. 1, respectively. The bulk of the discrepancy in these two errors is attributed to the fiber feed of ESPaDOnS, which illuminates the spectrograph slit uniformly and is thus less affected by variable seeing. Most of the data collected at Keck on 11 May 2006 are particularly plagued by poor seeing, degrading the spectrophotometry used in measuring the indices. If no repeat observation was made, we defer to the published SpT for this run. Although the errors of the TiO index are relatively small, the calibration is based on a sample with SpTs binned to half a subclass, imposing a 0.5 subclass uncertainty in the calculated SpTs listed in Table 1.
For stars of spectral type M6 or later, the TiO band begins to weaken due to saturation and condensation onto grains (Jones & Tsuji 1998) and additional absorption features which depress the “continuum” reference bandpass of the index. Similarly, the VO band at 7300 Å becomes stronger with spectral type and then weakens, but not until after M7, allowing us to unambiguously classify late-type M dwarfs at least until M7. Therefore, for the 17 targets in the sample that are M6 or later, we derived spectral types from visual classification by comparison of the TiO and VO bands with standard stars of known spectral types (Reid et al. 2002a, b, 2003). Again, due to the half-a-subclass binning of published spectral types, the error in the derived SpTs for these late Ms is also 0.5 subclasses.
5 Age-Dating the Sample
X-ray emission is ubiquitous amongst low-mass stars and is indicative of active stellar coronae throughout their lifetimes (e.g. 94% of all K and M dwarfs within 6 pc exhibited detectable X-ray emission as observed by ROSAT; Schmitt et al. 1995). Fractional X-ray luminosities have also been shown to be “saturated” across a wide range of spectral types, H equivalent widths, and ages at the value of log() , with the bulk of the dispersion in both field and cluster samples between log() of –2 and –4 due to variations in stellar rotation (Stauffer et al. 1997; Delfosse et al. 1998).999It has been well-established that the chromospheric activity and coronal emission of FGKM stars steadily decreases with age due to the reduced dynamo production of magnetic fields as the star spins down. Unlike the spin-down time-scale for higher-mass stars (1 Gyr; e.g. Skumanich 1972), the spin-down time-scales for field M dwarfs range from 1 to 10 Gyr, taking longer with decreasing stellar mass (Delfosse et al. 1998). As shown in Figures 2 and 3, we have selected our sample of M dwarfs with high fractional X-ray luminosities as compared with the Pleiades, all near the X-ray saturation level. And though data at later spectral types are sparse, our targets do not have X-ray fluxes as low as Hyades members.
X-ray emission of M dwarfs declines almost linearly in log-log space from 1 Myr to the about 650 Myr, the age of the Hyades, with a more rapid drop off after that (Preibisch & Feigelson 2005). Using the Preibisch & Feigelson (2005) relation of for X-ray luminosity decline, we determine that the bulk of our objects are less than 280 Myr old. We thus estimate an age of 300 Myr for our sample of 144 targets, with the early Ms ( 1.2, SpT M2.5), which have well above Hyades members, likely less than 150 Myr. This proportion of young stars (144 of 1103) is roughly consistent with expected number of young stars found in the Galactic disk assuming a uniform star-formation history.
We cannot however use X-ray activity to refine the stellar ages beyond this point, as the 150 Myr and 300 Myr limits discussed above are statistical in nature rather than applicable to individual stars.”. Additional age diagnostics are necessary to better characterize and date individual stars. The spectroscopic age indicators available to us such as surface gravity, lithium absorption, and H emission are discussed below, each with its implications and limitations.
5.1 Surface Gravity
A pre-main-sequence (PMS) star exhibits lower surface gravity as it has not yet fully contracted onto the main-sequence (MS). Even without measuring accurate values for surface gravities, the relative metric of a gravity index provides upper limits on the age of a low-g star using PMS stellar evolution models. Such models show that lower-mass stars take longer to contract to the MS, e.g. a 0.5 M⊙ star (SpT M1) will reach the main sequence within 100 Myr whereas a 0.1 M⊙ star (SpT M8.5) will do so in 1 Gyr (D’Antona & Mazzitelli, 1994).
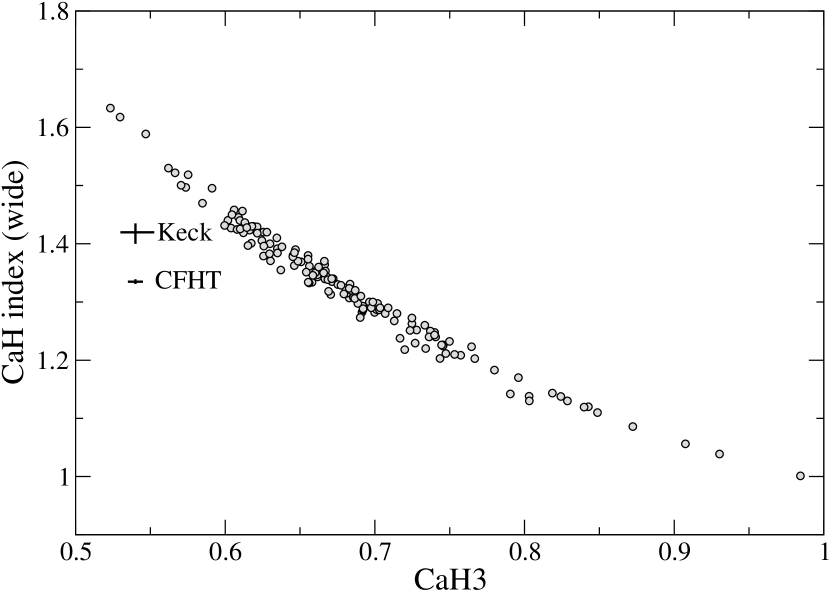
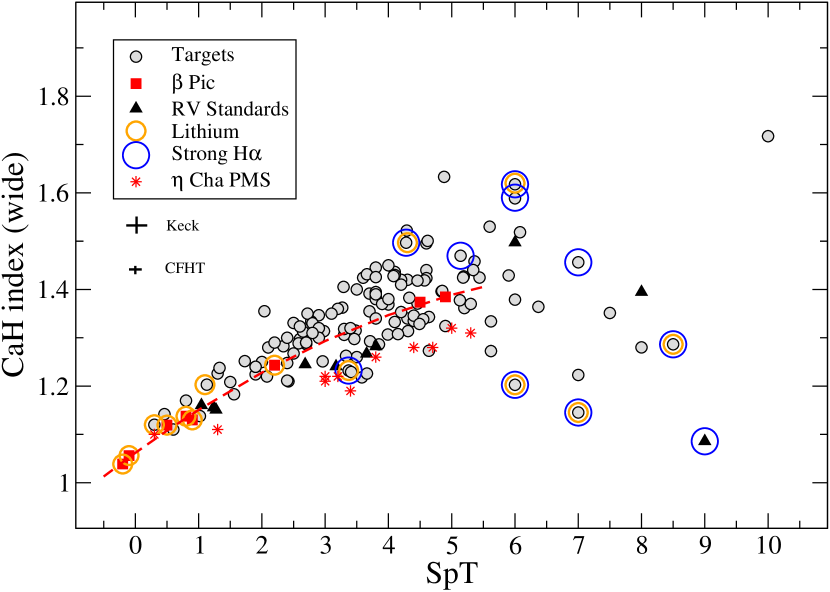
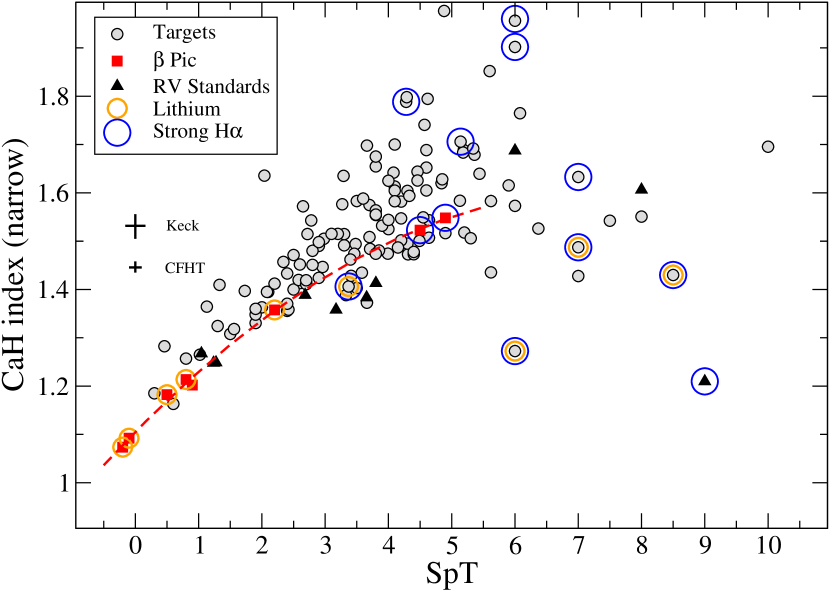
The prominent CaH molecular absorption bands (Figure 4) in M dwarf optical spectra are often used as gravity indicators. Typically, M dwarf spectra are collected with lower resolution due to their intrinsic faintness and as such require broad 30–50Å-wide indices. We measured two indices defined in the literature: (1) “Ratio A” from Kirkpatrick et al. (1991), which is defined as the ratio of the mean intensity in two passbands, a “continuum” band and a molecular absorption band of CaH 6975: [7020-7050Å]/[6960-6990Å], and (2) the “CaH3” ratio from Reid et al. (1995), [6960-6990Å]/[7042-7046Å]. Figure 6 shows how the two indices are strongly correlated. We focus the rest of our discussion using the first index for which the relative errors in our sample are slightly smaller. Since we have 15–20 times the resolution of previous M dwarf surveys, we also defined a narrower 5-Å CaH index [7044–7049]/[6972.5–6977.5] providing a more discriminating scale with which to identify low-gravity stars. Both indices are plotted as function of SpT in Figure 7.
5.1.1 The effects of higher metallicity
An important caveat to using the TiO and CaH molecules as temperature and gravity diagnostics is their dependence on metallicity. Higher metallicity will mimic later spectral types and lower surface gravities. Woolf & Wallerstein (2006) demonstrate this metallicity dependence for M dwarfs using the TiO5 and CaH2 indices defined in Reid et al. (1995). Though the data are quite limited, we can estimate from Figure 4 of Woolf & Wallerstein (2006) that in order to increase the calculated SpT by 0.5 subclasses or decrease the CaH-wide index by 0.1, an M dwarf would need to have a [Fe/H] enhancement of 0.5 dex relative to the population’s mean metallicity. Unfortunately, measuring metallicities directly from atomic lines in M dwarf spectra remains difficult and calibration errors usually range from 0.2–0.3 dex and are likely higher (e.g. Bonfils et al. 2005; Woolf & Wallerstein 2006; Bean et al. 2006). However, using the age-metallicity relation for FGK stars in the local Galactic disk as measured by Reid et al. (2007b) and assuming the same metallicity distribution for nearby Ms as for higher mass stars, our young targets should have a mean [Fe/H] of 0.11 with a dispersion of 0.18 dex, implying that very few, if any, of our targets will have high enough metallicities to falsely appear as low-g stars in Figure 7.
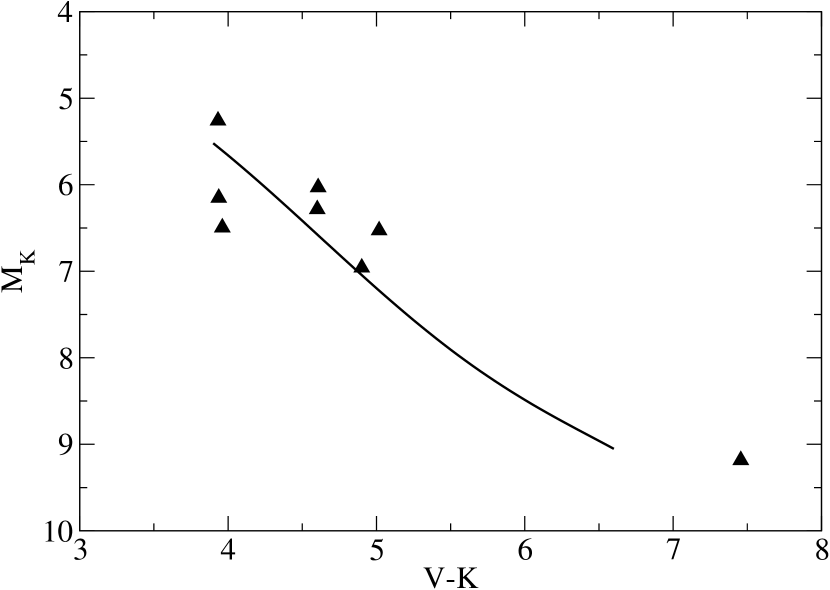
This metallicity effect is, however, apparent in the placement of the RV standards in the CaH-SpT distribution. They are near or below the locus of the Pic members and would therefore be flagged as low-g, when they should, in general, be old field stars. None of the standards appears to have low-g from its EWKI and only 5 of 10 have ROSAT detections, all lying well below the target sample in Figure 3. The RV standards exhibit no other evidence of youth, less LHS 2065 and GJ 406, which are both known to be flare stars (Schmitt & Liefke 2002; Schmitt et al. 2008). We attribute their apparent low surface gravity to our choice of the most stable RV standards from Nidever et al. (2002) and Marcy & Benitz (1989), likely due to their stronger absorption lines from higher metallicity. Published [Fe/H] values based on the Bonfils et al. (2005) calibration range from –0.16 to +0.15 (see Table 3), and do not agree with this conclusion. However, recently Johnson & Apps (2009) pointed out errors in the Bonfils calibration that underestimates M dwarf metallicities by 0.32 dex on average. Using the revised photometric calibration of Johnson & Apps, it is clear from Figure 8 that the bulk of our RV standards are indeed metal rich.
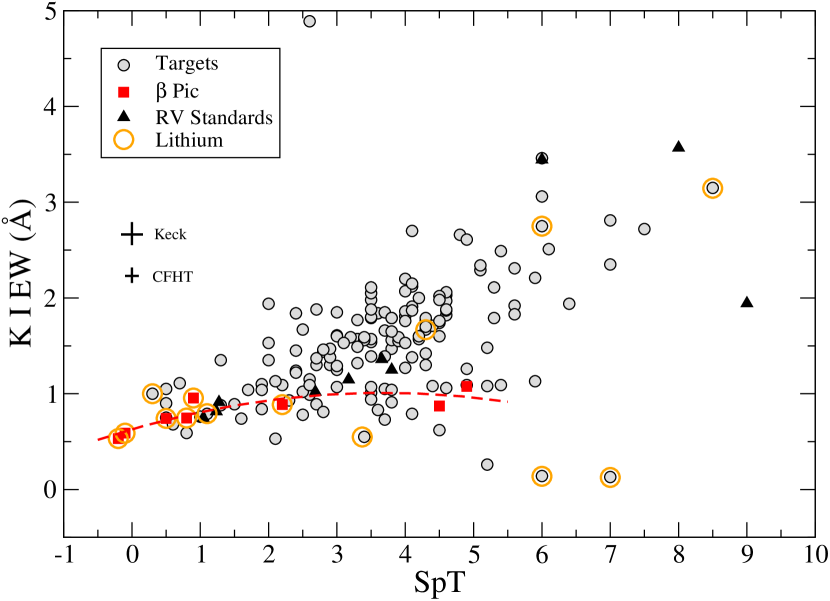
It is clear now that for a sample of field stars with no metallicity measurements, a single gravity index may not be sufficient. The atomic alkali lines of K I (7665 and 7699Å) and Na I ( 8183 and 8195Å) may also be used as gravity indicators (e.g. Slesnick et al. 2006). Yet, care is required with these lines as well as they are affected by stellar activity such that higher levels of chromospheric emission fill in the absorption cores and reduce the measured EWs. We settled on the K I line as this filling-in is stronger in the Na I (Reid & Hawley 1999).
Combining the effects of the chromosphere on K I with the uncertainties in metallicity on the TiO and CaH indices, we consider a target as having low-g only if both the CaH and K I measurements indicate that it is so. We flag a target as such in Table 2 if it falls on or below (within error bars) the best-fit curves to the observed Pic members in Figures 7 and 10. The equations for these curves are listed in the figure captions.
Though we do not have spectra of known young stars at SpTs later than M6.5 with which to calibrate the CaH indices, extrapolating the Pic curve might imply that all the late Ms in our sample lie in the low-g regime of Figure 7. This is reassuring since PMS evolutionary models (e.g. D’Antona & Mazzitelli 1994) predict a M6.5 (0.15 M⊙) star will reach the main-sequence in 500 Myr. Therefore, we would expect that for a sample of X-ray-selected targets with ages 300 Myr, all late Ms will have low surface gravities.101010Alternative models by Burrows et al. (1993) predict that the radius, and thus the gravity, of a 0.15M⊙star will reach its final size in 250 Myrs.
5.2 Lithium detection
PMS stars across all M subclasses are not hot enough to destroy their primordial Li abundance (T 2.5106 K) and are easily identified by their strong lithium absorption at 6708 Å (EW0.6Å).111111Kirkpatrick et al. (2008) recently pointed out that both theory and observations (albeit weakly) suggest a weakened Li absorption at very young ages of very-late-M and L dwarfs due to their extremely low gravity. As the pre-MS star contracts, it reaches a maximum observed Li strength at about 100 Myr before it begins to weaken again due to Li burning. Very young late-K and early-M dwarfs deplete their lithium by a factor of 2 in less than 10 Myr, providing a robust way to discriminate between 8-Myr old stars, such as TWA or Cha members, and 12-Myr old Pic members. This depletion is substantially slowed in lower mass stars, such that by M6 a lithium detection sets a 90-Myr upper limit on the star’s age (Chabrier et al. 1996; Stauffer et al. 1998).
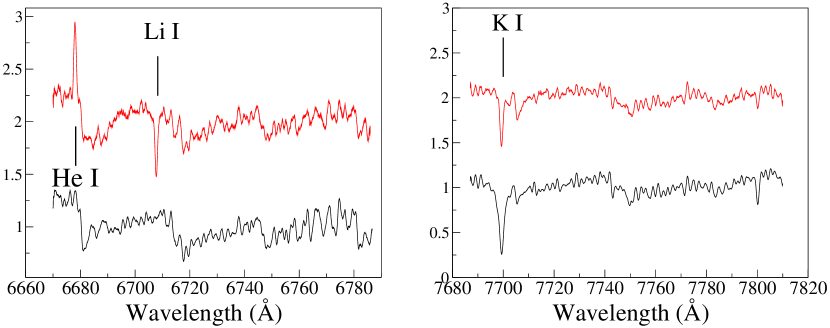
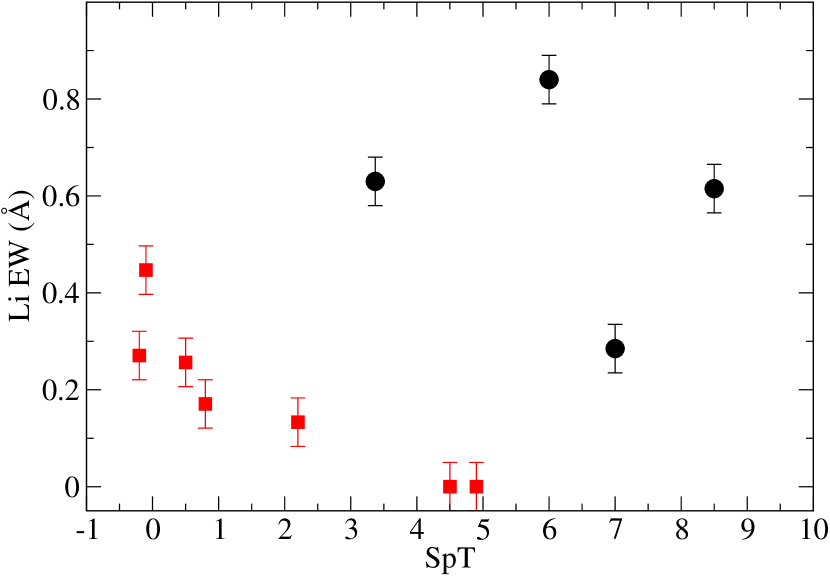
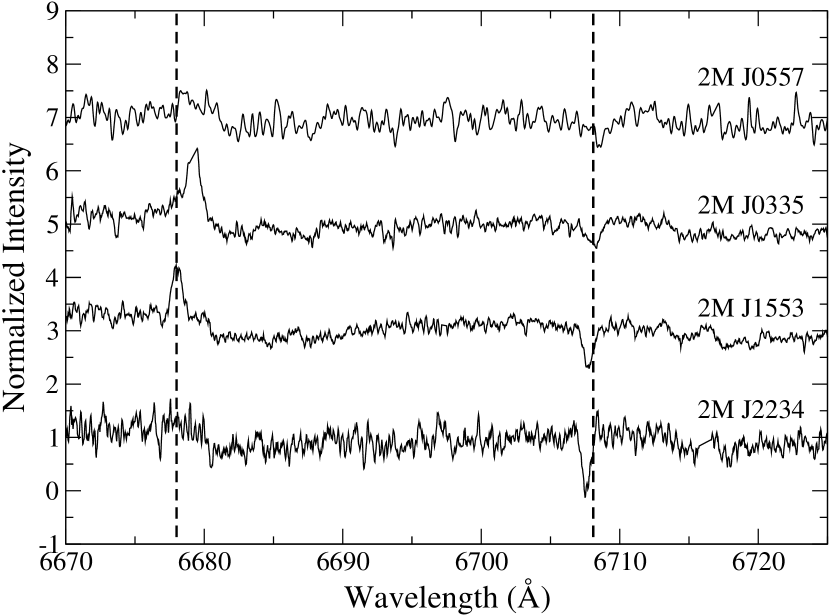
We have measured lithium EWs121212The lithium abundances have not been corrected for possible contamination with the Fe I line at 6707.44 Å. Uncertainties in the setting of continuum levels prior to measurement induce EW errors of about 10-20 mÅ with a dependence on the S/N in the region. We therefore consider our 2 detection limit to be 0.05 Å. in 8 of our targets, listed in Table 5 and plotted in Figure 11. The lithium in the two earliest of these, GJ 9809 (M0.3) and GJ 3305 (M1.1) sets a limit on their ages of 20–30 Myr, consistent with their known membership of the AB Dor (López-Santiago et al., 2006) and Pic (Torres et al., 2006) YMGs, respectively. The spectra of the four strongest lithium absorbers 2MASS J1553 (M3.5), 2MASS J2234 (M6), 2MASS J0557 (M7), and 2MASS J0335 (M8.5), are shown in Figures 12.1313132MASS J1553 appeared as a visual binary with the acquisition camera on Keck I and the observations presented in this paper are of the southern component. Allers et al. (in press) have observed 2MASS J2234 as a 0.16” binary with Keck’s laser guide star adaptive optics system, but as we were unable to resolve the system, our spectra are a composite of the two. According to stellar evolution models by Chabrier et al. (1996), a M3.5 star such as 2MASS J1553 with lithium absorption must be less than 40 Myr old. For the ages of other stars, the models can only place upper limits between 90 and 150 Myr. However, 3 of these 4 stars (2MASS J1553, 2MASS J2234, and 2MASS J0335) have EWLi 0.6 Å, implying that they are PMS stars and must be younger than 10 Myr (Zuckerman & Song, 2004), consistent with their accretion-level H emission discussed in the following section.
5.3 H from accretion
Accretion by PMS stars produces a strong emission-line spectrum, which in the visible includes the Balmer series, caused by accreting gas falling along magnetic field lines from the circumstellar disk onto the star. The near free-fall velocities result in accretion shocks producing both strong and extremely velocity-broadened ( hundreds of km s-1) H emission profiles. The equivalent width and/or velocity width of H is often used as an indicator of accretion and can set a very young upper limit of 10 Myr on the age of a given star (e.g. Barrado y Navascués & Martín 2003).
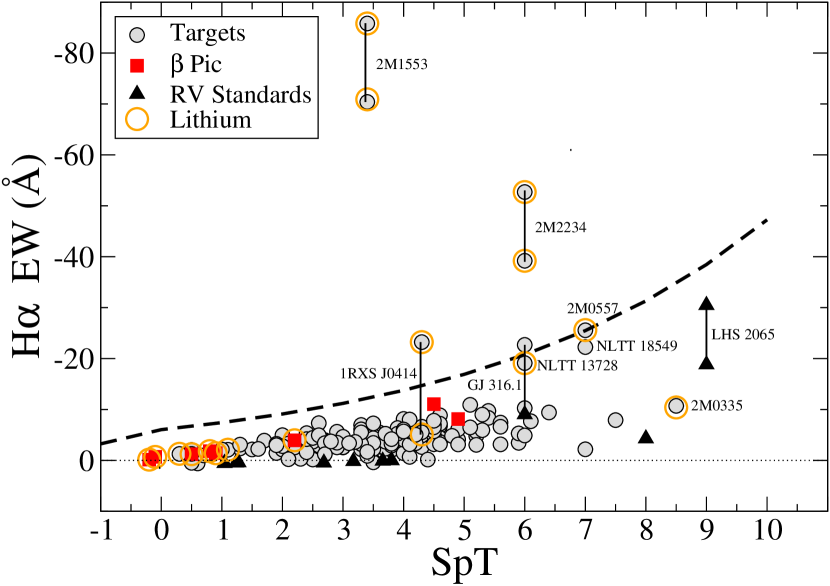
We measured the H EWs of all targets and plot them in Figure 13 as a function of SpT. Eleven of the targets have no significant emission (i.e. Å) and none has H in absorption. The bright X-ray emission detected by ROSAT from these chromospherically inactive stars was likely then the result of a stellar flare, rather than enhanced activity due to youth. The remaining 93% of the ROSAT-selected objects show H in emission with a clear trend towards higher emission with later spectral type. This is in general attributed to the “contrast effect” as the photospheric luminosity decreases in the -band with lower effective temperatures (Basri & Marcy 1995). However, comparisons within a narrow range of spectral types can be made to identify more chromospherically active and potentially accreting young objects.
Eight stars in Figure 13 have H emission near the empirical accretion/non-accretion boundary (Barrado y Navascués & Martín 2003) depicted by the dashed curve in the figure. Though the accretion curve is not thought to be very robust for objects of SpT later than M5.5, due to the few late-M cluster members used to calibrate the sequence, it does serve as an outer envelope of the chromospheric emission. Unfortunately, this “saturation” criterion is not robust enough to be used exclusively. This is demonstrated by the flaring stars 1RXS J0414, GJ 316.1 and LHS 2065 (Schmitt 1994; Schmitt & Liefke 2002). Though they are likely much younger than 300 Myr, none is accreting, as indicated by the lack of lithium in their spectra.
The empirical “10%-width” metric, which measures the full width at the 10% level of the H velocity profile peak, is a more promising diagnostic of accretion. White & Basri (2003) use a combination of EWHα Å and a velocity width of 200 km/s to identify accreting T Tauri stars. Mohanty et al. (2005) use He I 6678 emission as yet another accretion indicator, though several of the objects they determined to be accreting do not exhibit He I emission, while others with He I emission show no signs of accretion. This appears to be the case in our sample as well. Seventeen of our targets have detectable He I emission though the bulk of them are certainly not accretors.
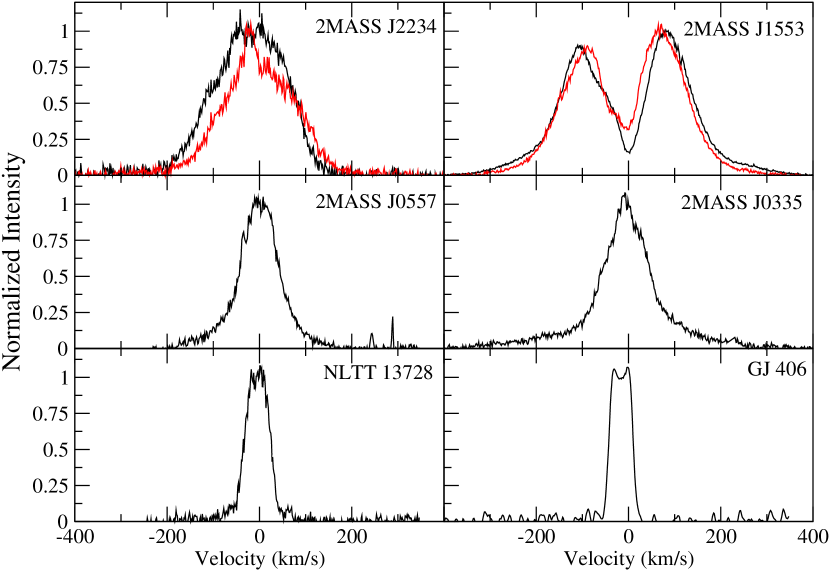
2MASS J2234, 2MASS J1553, 2MASS J0557, and 2MASS J0335 all have lithium absorption, indications of low-g from both the CaH and K I diagnostics, and broad H profiles, plotted in Figure 14 with average 10%-widths of 306, 446, 207, and 273 km s-1, respectively. Only two however exhibit He I emission. (See Table 5.) Though 2MASS J0335 does not have a strong enough EWHα to exceed the Barrado y Navascués & Martín (2003) accretion limit, its EWHα of –10.7 Å does qualify it as an accretor using the White & Basri (2003) criteria. We conclude that 2MASS J2234, 2MASS J1553 and 2MASS J0335 are accreting T Tauri stars while 2MASS J0557 is on the borderline, with upper limits on the ages of 5, 3, 10, and 10 Myr, respectively, based on the criteria devised by White & Basri (2003), Mohanty et al. (2005), and Barrado y Navascués & Martín (2003). Using gravity-sensitive spectral features in the near-IR, Allers et al. (in press) further refined the age of 2MASS J2234 to a very young 1 Myr.
6 Summary
We present our ground-based spectroscopic survey of 185 X-ray-bright low-mass stars, most of which are within 25 pc. Our high-resolution optical spectra allowed us to identify 30 SBs which are strong X-ray emitters, but not necessarily young. For the remainder of the sample, we measured youth indicators such as wide- and narrow-band gravity indices of the CaH molecular band as well as K I equivalent widths. We find that for a sample of field stars with no metallicity measurements, a single gravity index may not be sufficient, as high metallicities mimic low-g on a CaH-SpT plot. This is apparent in a metal-rich sub-sample of our RV standards, which appear to have low surface gravity as measured by the CaH index, yet show no other evidence of youth. Combining the effects of chromospheric activity on EWKI with the uncertainties in metallicity on the TiO and CaH indices, we require that both the CaH and K I measurements indicate low-g before classifying a star as such. We have also detected lithium absorption, a sure sign of youth, in 8 targets, 4 of which show evidence of accretion from their velocity-broadened H profiles.
We estimate that our final sample of the 144 youngest and nearest low-mass objects in the field is less than 300 Myr old, with 30% of them being younger than 150 Myr old and 4 very young (10 Myr old). This sample provides a rich set of well-characterized targets with the primary requirements of youth and proximity for intensive disk evolution and planet formation studies with ground-based (e.g. adaptive optics) and space-based observations. Two such programs are currently underway: (1) We are using the Multiband Imaging Photometer for the Spitzer Space Telescope (MIPS) to extend debris disk studies to low-mass stars with sufficient sensitivity for meaningful comparison with higher mass stars. Also, the newly discovered disks will be among the closest to Earth, making them prime targets for multiwavelength and high angular resolution follow−up. (2) The Gemini Planet-Finding Campaign (Liu et al. 2009), an extensive (500 hours) search for massive extrasolar planets using the high-contrast AO Near-Infrared Coronagraphic Imager (NICI), has observed many of our targets and will continue to do so over the next two years. This program will provide key constraints for the separation distributions of extrasolar planets at 5 – 10 AU, the dependence on planet frequency on stellar host mass, and the spectral properties of extrasolar giant planets.
References
- Allen & Reid (2008) Allen, P. R., & Reid, I. N. 2008, AJ, 135, 2024
- Allers et al. (2009) Allers, K. N., et al. 2009, ArXiv e-prints, 0902.4742
- Baraffe et al. (1998) Baraffe, I., Chabrier, G., Allard, F., & Hauschildt, P. H. 1998, A&A, 337, 403
- Baraffe et al. (2003) Baraffe, I., Chabrier, G., Barman, T. S., Allard, F., & Hauschildt, P. H. 2003, A&A, 402, 701
- Barrado y Navascués & Martín (2003) Barrado y Navascués, D., & Martín, E. L. 2003, AJ, 126, 2997
- Basri & Marcy (1995) Basri, G., & Marcy, G. W. 1995, AJ, 109, 762
- Bean et al. (2006) Bean, J. L., Sneden, C., Hauschildt, P. H., Johns-Krull, C. M., & Benedict, G. F. 2006, ApJ, 652, 1604
- Beuzit et al. (2004) Beuzit, J.-L., et al. 2004, A&A, 425, 997
- Bochanski et al. (2008) Bochanski, J. J., Hawley, S. L., Reid, I. N., Covey, K. R., West, A. A., Golimowski, D. A., & Ivezic, Z. 2008, ArXiv e-prints, 0810.2343
- Bonfils et al. (2005) Bonfils, X., Delfosse, X., Udry, S., Santos, N. C., Forveille, T., & Ségransan, D. 2005, A&A, 442, 635
- Burrows et al. (1993) Burrows, A., Hubbard, W. B., Saumon, D., & Lunine, J. I. 1993, ApJ, 406, 158
- Casagrande et al. (2008) Casagrande, L., Flynn, C., & Bessell, M. 2008, MNRAS, 389, 585
- Chabrier et al. (1996) Chabrier, G., Baraffe, I., & Plez, B. 1996, ApJ, 459, L91+
- Covey et al. (2008) Covey, K. R., et al. 2008, ApJS, 178, 339
- Cruz et al. (2007) Cruz, K. L., et al. 2007, AJ, 133, 439
- Cruz et al. (2003) Cruz, K. L., Reid, I. N., Liebert, J., Kirkpatrick, J. D., & Lowrance, P. J. 2003, AJ, 126, 2421
- Daemgen et al. (2007) Daemgen, S., Siegler, N., Reid, I. N., & Close, L. M. 2007, ApJ, 654, 558
- D’Antona & Mazzitelli (1994) D’Antona, F., & Mazzitelli, I. 1994, ApJS, 90, 467
- Delfosse et al. (1998) Delfosse, X., Forveille, T., Perrier, C., & Mayor, M. 1998, A&A, 331, 581
- Donati et al. (2006) Donati, J.-F., Catala, C., Landstreet, J. D., & Petit, P. 2006, in Astronomical Society of the Pacific Conference Series, Vol. 358, Astronomical Society of the Pacific Conference Series, ed. R. Casini & B. W. Lites, 362–+
- Donati et al. (2007) Donati, J.-F., et al. 2007, MNRAS, 380, 1297
- Donati et al. (1997) Donati, J.-F., Semel, M., Carter, B. D., Rees, D. E., & Collier Cameron, A. 1997, MNRAS, 291, 658
- Fitzgerald et al. (2007) Fitzgerald, M. P., Kalas, P. G., Duchêne, G., Pinte, C., & Graham, J. R. 2007, ApJ, 670, 536
- Fitzpatrick (1993) Fitzpatrick, M. J. 1993, in Astronomical Society of the Pacific Conference Series, Vol. 52, Astronomical Data Analysis Software and Systems II, ed. R. J. Hanisch, R. J. V. Brissenden, & J. Barnes, 472–+
- France et al. (2007) France, K., Roberge, A., Lupu, R. E., Redfield, S., & Feldman, P. D. 2007, ApJ, 668, 1174
- Gershberg et al. (1999) Gershberg, R. E., Katsova, M. M., Lovkaya, M. N., Terebizh, A. V., & Shakhovskaya, N. I. 1999, A&AS, 139, 555
- Hawley et al. (2002) Hawley, S. L., et al. 2002, AJ, 123, 3409
- Hebb et al. (2007) Hebb, L., Petro, L., Ford, H. C., Ardila, D. R., Toledo, I., Minniti, D., Golimowski, D. A., & Clampin, M. 2007, MNRAS, 379, 63
- Hillenbrand et al. (2008) Hillenbrand, L. A., et al. 2008, ApJ, 677, 630
- Hünsch et al. (1999) Hünsch, M., Schmitt, J. H. M. M., Sterzik, M. F., & Voges, W. 1999, A&AS, 135, 319
- Ida & Lin (2008) Ida, S., & Lin, D. N. C. 2008, ApJ, 673, 487
- Jeffries (1995) Jeffries, R. D. 1995, MNRAS, 273, 559
- Johnson & Apps (2009) Johnson, J. A., & Apps, K. 2009, ArXiv e-prints, 0904.3092
- Jones & Tsuji (1998) Jones, H. R. A., & Tsuji, T. 1998, in Astronomical Society of the Pacific Conference Series, Vol. 134, Brown Dwarfs and Extrasolar Planets, ed. R. Rebolo, E. L. Martin, & M. R. Zapatero Osorio, 423–+
- Kalas et al. (2004) Kalas, P., Liu, M. C., & Matthews, B. C. 2004, Science, 303, 1990
- Kirkpatrick et al. (2008) Kirkpatrick, J. D., et al. 2008, ApJ, 689, 1295
- Kirkpatrick et al. (1991) Kirkpatrick, J. D., Henry, T. J., & McCarthy, Jr., D. W. 1991, ApJS, 77, 417
- Krist et al. (2005) Krist, J. E., et al. 2005, AJ, 129, 1008
- Lépine & Shara (2005) Lépine, S., & Shara, M. M. 2005, AJ, 129, 1483
- Lépine et al. (2002) Lépine, S., Shara, M. M., & Rich, R. M. 2002, AJ, 124, 1190
- Li & Hu (1998) Li, J. Z., & Hu, J. Y. 1998, A&AS, 132, 173
- Liu et al. (2004) Liu, M. C., Matthews, B. C., Williams, J. P., & Kalas, P. G. 2004, ApJ, 608, 526
- Liu et al. (2009) Liu, M. C., et al. 2009, in American Institute of Physics Conference Series, Vol. 1094, American Institute of Physics Conference Series, ed. E. Stempels, 461–464
- López-Santiago et al. (2006) López-Santiago, J., Montes, D., Crespo-Chacón, I., & Fernández-Figueroa, M. J. 2006, ApJ, 643, 1160
- Lyo et al. (2004) Lyo, A.-R., Lawson, W. A., & Bessell, M. S. 2004, MNRAS, 355, 363
- Mandell et al. (2007) Mandell, A. M., Raymond, S. N., & Sigurdsson, S. 2007, ApJ, 660, 823
- Marcy & Benitz (1989) Marcy, G. W., & Benitz, K. J. 1989, ApJ, 344, 441
- McCarthy et al. (2001) McCarthy, C., Zuckerman, B., & Becklin, E. E. 2001, AJ, 121, 3259
- Micela et al. (1998) Micela, G., Sciortino, S., Harnden, Jr., F. R., & Rosner, R. 1998, Ap&SS, 261, 105
- Mohanty et al. (2005) Mohanty, S., Jayawardhana, R., & Basri, G. 2005, ApJ, 626, 498
- Montes et al. (2001) Montes, D., López-Santiago, J., Fernández-Figueroa, M. J., & Gálvez, M. C. 2001, A&A, 379, 976
- Nidever et al. (2002) Nidever, D. L., Marcy, G. W., Butler, R. P., Fischer, D. A., & Vogt, S. S. 2002, ApJS, 141, 503
- Norton et al. (2007) Norton, A. J., et al. 2007, A&A, 467, 785
- Perryman & ESA (1997) Perryman, M. A. C., & ESA, eds. 1997, ESA Special Publication, Vol. 1200, The HIPPARCOS and TYCHO catalogues. Astrometric and photometric star catalogues derived from the ESA HIPPARCOS Space Astrometry Mission
- Pettersen (1980) Pettersen, B. R. 1980, PASP, 92, 188
- Preibisch & Feigelson (2005) Preibisch, T., & Feigelson, E. D. 2005, ApJS, 160, 390
- Reid & Cruz (2002) Reid, I. N., & Cruz, K. L. 2002, AJ, 123, 2806
- Reid et al. (2003) Reid, I. N., et al. 2003, AJ, 126, 3007
- Reid et al. (2004) —. 2004, AJ, 128, 463
- Reid et al. (2007a) Reid, I. N., Cruz, K. L., & Allen, P. R. 2007a, AJ, 133, 2825
- Reid et al. (2002a) Reid, I. N., Gizis, J. E., & Hawley, S. L. 2002a, AJ, 124, 2721
- Reid & Hawley (1999) Reid, I. N., & Hawley, S. L. 1999, AJ, 117, 343
- Reid et al. (1995) Reid, I. N., Hawley, S. L., & Gizis, J. E. 1995, AJ, 110, 1838
- Reid et al. (2002b) Reid, I. N., Kirkpatrick, J. D., Liebert, J., Gizis, J. E., Dahn, C. C., & Monet, D. G. 2002b, AJ, 124, 519
- Reid et al. (2007b) Reid, I. N., Turner, E. L., Turnbull, M. C., Mountain, M., & Valenti, J. A. 2007b, ApJ, 665, 767
- Reid & Walkowicz (2006) Reid, I. N., & Walkowicz, L. M. 2006, PASP, 118, 671
- Riaz et al. (2006) Riaz, B., Gizis, J. E., & Harvin, J. 2006, AJ, 132, 866
- Rieke et al. (2005) Rieke, G. H., et al. 2005, ApJ, 620, 1010
- Roberge et al. (2006) Roberge, A., Feldman, P. D., Weinberger, A. J., Deleuil, M., & Bouret, J.-C. 2006, Nature, 441, 724
- Schmitt (1994) Schmitt, J. H. M. M. 1994, ApJS, 90, 735
- Schmitt et al. (1995) Schmitt, J. H. M. M., Fleming, T. A., & Giampapa, M. S. 1995, ApJ, 450, 392
- Schmitt & Liefke (2002) Schmitt, J. H. M. M., & Liefke, C. 2002, A&A, 382, L9
- Schmitt et al. (2008) Schmitt, J. H. M. M., Reale, F., Liefke, C., Wolter, U., Fuhrmeister, B., Reiners, A., & Peres, G. 2008, A&A, 481, 799
- Shkolnik et al. (2008) Shkolnik, E., Liu, M. C., Reid, I. N., Hebb, L., Cameron, A. C., Torres, C. A., & Wilson, D. M. 2008, ApJ, 682, 1248
- Skrutskie et al. (2006) Skrutskie, M. F., et al. 2006, AJ, 131, 1163
- Skumanich (1972) Skumanich, A. 1972, ApJ, 171, 565
- Slesnick et al. (2006) Slesnick, C. L., Carpenter, J. M., & Hillenbrand, L. A. 2006, AJ, 131, 3016
- Song et al. (2002) Song, I., Weinberger, A. J., Becklin, E. E., Zuckerman, B., & Chen, C. 2002, AJ, 124, 514
- Stauffer et al. (1991) Stauffer, J., Klemola, A., Prosser, C., & Probst, R. 1991, AJ, 101, 980
- Stauffer et al. (1997) Stauffer, J. R., Balachandran, S. C., Krishnamurthi, A., Pinsonneault, M., Terndrup, D. M., & Stern, R. A. 1997, ApJ, 475, 604
- Stauffer et al. (1998) Stauffer, J. R., Schultz, G., & Kirkpatrick, J. D. 1998, ApJ, 499, L199+
- Stern et al. (1995) Stern, R. A., Schmitt, J. H. M. M., & Kahabka, P. T. 1995, ApJ, 448, 683
- Stocke et al. (1991) Stocke, J. T., Morris, S. L., Gioia, I. M., Maccacaro, T., Schild, R., Wolter, A., Fleming, T. A., & Henry, J. P. 1991, ApJS, 76, 813
- Torres et al. (2006) Torres, C. A. O., Quast, G. R., da Silva, L., de La Reza, R., Melo, C. H. F., & Sterzik, M. 2006, A&A, 460, 695
- Torres et al. (2008) Torres, C. A. O., Quast, G. R., Melo, C. H. F., & Sterzik, M. F. 2008, Young Nearby Loose Associations (Handbook of Star Forming Regions, Volume II: The Southern Sky ASP Monograph Publications, Vol. 5. Edited by Bo Reipurth, p.757), 757–+
- Voges et al. (1999) Voges, W., et al. 1999, A&A, 349, 389
- Voges et al. (2000) —. 2000, VizieR Online Data Catalog, 9029, 0
- Vogt et al. (1994) Vogt, S. S., et al. 1994, in Society of Photo-Optical Instrumentation Engineers (SPIE) Conference Series, Vol. 2198, Society of Photo-Optical Instrumentation Engineers (SPIE) Conference Series, ed. D. L. Crawford & E. R. Craine, 362–+
- Webb et al. (1999) Webb, R. A., Zuckerman, B., Platais, I., Patience, J., White, R. J., Schwartz, M. J., & McCarthy, C. 1999, ApJ, 512, L63
- Wenger et al. (2007) Wenger, M., et al. 2007, in Astronomical Society of the Pacific Conference Series, Vol. 377, Library and Information Services in Astronomy V, ed. S. Ricketts, C. Birdie, & E. Isaksson, 197–+
- West et al. (2008) West, A. A., Hawley, S. L., Bochanski, J. J., Covey, K. R., Reid, I. N., Dhital, S., Hilton, E. J., & Masuda, M. 2008, AJ, 135, 785
- White & Basri (2003) White, R. J., & Basri, G. 2003, ApJ, 582, 1109
- Wilking et al. (2005) Wilking, B. A., Meyer, M. R., Robinson, J. G., & Greene, T. P. 2005, AJ, 130, 1733
- Woolf & Wallerstein (2005) Woolf, V. M., & Wallerstein, G. 2005, MNRAS, 356, 963
- Woolf & Wallerstein (2006) —. 2006, PASP, 118, 218
- Zickgraf et al. (2003) Zickgraf, F.-J., Engels, D., Hagen, H.-J., Reimers, D., & Voges, W. 2003, A&A, 406, 535
- Zickgraf et al. (2005) Zickgraf, F.-J., Krautter, J., Reffert, S., Alcalá, J. M., Mujica, R., Covino, E., & Sterzik, M. F. 2005, A&A, 433, 151
- Zuckerman & Song (2004) Zuckerman, B., & Song, I. 2004, ARA&A, 42, 685
- Zuckerman et al. (2004) Zuckerman, B., Song, I., & Bessell, M. S. 2004, ApJ, 613, L65
| NameaaThose target names with directions in parentheses were resolved as visual binaries (VB) and when possible, both components were observed. If a target was resolved as a VB by another group (see last column) but not resolved at the telescope, the resulting spectrum is a composite of the both components. Likewise, the published photometry is of the combined system. | RA & DEC | Tele- | SpT | Dist.ccPhotometric distances from Reid et al. (2002b, 2007a) unless otherwise noted. Daemgen et al. (2007) revised the distances to those VBs resolved by them. (See last column). Distances of those VBs resolved by us during acquisition have been corrected for their binarity assuming equal flux for each component. | logddFractional X-ray flux from the ROSAT All-Sky Survey. Three targets were not detected by ROSAT but have been included in the sample due to previously published indications of youth. (See column 7 of Table 2.) | BinarityiiVisual binaries are marked as “VB”. Stars observed during two epochs with no RV variation are marked as “SB1”. | ||
|---|---|---|---|---|---|---|---|---|
| J2000 (2MASS) | scopebbEach of the two spectrographs used, Keck+HIRES and CFHT+ESPaDOnS, produces a different measurement error for the TiO index and thus, the errors of the of the calculated SpTs are (SpT) = 0.33, 0.11, respectively. However, the calibration is based on a sample binned to 0.5 subclasses, limiting the true uncertainty to this value. | M–()bbEach of the two spectrographs used, Keck+HIRES and CFHT+ESPaDOnS, produces a different measurement error for the TiO index and thus, the errors of the of the calculated SpTs are (SpT) = 0.33, 0.11, respectively. However, the calibration is based on a sample binned to 0.5 subclasses, limiting the true uncertainty to this value. | (pc) | USNO | 2MASS | |||
| 2MASS J00034227–2822410 | 00 03 42.28 -28 22 41.0 | Keck | 7.0eeDue to either poor S/N or bad seeing, we were unable to measure reliable TiO indices for these targets and defer to the published SpT ( subclasses) based on low-resolution data (Reid et al. 2002b, 2007a). | 29.24.0 | 15.65 | 13.068 | -1.742 | – – |
| G 217-32 | 00 07 42.64 60 22 54.3 | CFHT | 3.8 | 12.21.7 | 10.32 | 8.911 | -2.391 | – – |
| LP 348-40 | 00 11 53.03 22 59 04.8 | CFHT | 3.5 | 16.02.7 | 10.22 | 8.862 | -1.824 | SB1 |
| NLTT 614 | 00 12 57.17 50 59 17.3 | Keck | 6.4 | 18.22.7 | 13.65 | 11.406 | -2.041 | – – |
| 1RXS J001557.5–163659 | 00 15 58.08 -16 36 57.9 jjRiaz et al. (2006) obtained low-resolution spectra of these targets. | CFHT | 4.1 | 7.31.2 | 10.49 | 8.736 | -2.430 | SB1 |
| GJ 1006 A | 00 16 14.56 19 51 38.6 | Keck | 3.6 | 12.32.7 | – | 7.875 | -2.446 | Pphot=4.7901 d (Norton et al., 2007)ffNorton et al. (2007) attribute the photometric period to an eclipsing binary of BY Dra-type, however we see no evidence that this target is a spectroscopic binary. |
| GJ 3030 | 00 21 57.81 49 12 38.0 | CFHT | 2.4 | 24.12.7 | 10.12 | 9.139 | -2.610 | – – |
| GJ 3036 | 00 28 53.92 50 22 33.0 | CFHT | 3.7 | 17.44.5 | 10.28 | 8.847 | -2.222 | 0.426” VB (Daemgen et al., 2007) |
| NLTT 1875 | 00 35 4.88 59 53 08.0 | Keck | 4.3 | 19.52.7 | 12.58 | 11.039 | -2.173 | – – |
| G 69-32 | 00 54 48.03 27 31 03.6 jjRiaz et al. (2006) obtained low-resolution spectra of these targets. | Keck | 4.6 | 17.84.5 | 11.59 | 10.34 | -2.179 | – – |
| G 132-51B (W) | 01 03 42.11 40 51 15.8 jjRiaz et al. (2006) obtained low-resolution spectra of these targets. | CFHT | 2.6 | 29.32.7 | 10.32 | 9.372 | -1.729 | VB (brighter) (this work), SB1 |
| G 132-51B (E) | 01 03 42.11 40 51 15.8 | CFHT | 3.8 | 29.32.7 | 10.32 | 9.372 | -1.729 | VB (fainter) (this work) |
| G 269-153 (NE) | 01 24 27.68 -33 55 08.6 jjRiaz et al. (2006) obtained low-resolution spectra of these targets. | CFHT | 4.3 | 12.62.3 | 10.47 | 9.203 | -2.096 | 2.065” VB (Daemgen et al., 2007), SB1 |
| G 269-153 (SW) | 01 24 27.68 -33 55 08.6 | CFHT | 4.6 | 12.62.3 | 10.47 | 9.203 | -2.096 | 2.065” VB (Daemgen et al., 2007), SB1 |
| G 172-56 | 01 29 12.57 48 19 35.5 | Keck | 5.4 | 44.07.4 | 12.07 | 10.912 | -1.809 | – – |
| 2MASS J01351393–0712517 | 01 35 13.93 -07 12 51.8 jjRiaz et al. (2006) obtained low-resolution spectra of these targets. | CFHT | 4.3 | 9.01.5 | 10.46 | 8.964 | -2.304 | – – |
| G 271-110 | 01 36 55.17 -06 47 37.9 | CFHT | 3.5 | 25.84.2 | 11.02 | 9.707 | -2.125 | SB1 |
| LHS 6032 (SW) | 01 45 18.2 46 32 07.8 | CFHT | 1.3 | 26.72.7 | 9.94 | 8.058 | -2.130 | VB (this work) |
| 1RXS J015027.1–185134 | 01 50 27.12 -18 51 36.0 | Keck | 5.4 | – | 13.31 | 11.484 | -1.985 | – – |
| NLTT 6549 | 01 58 13.61 48 44 19.7 | CFHT | 1.5 | 23.42.7 | 10.13 | 9.123 | -2.554 | – – |
| GJ 1041A (SW) | 01 59 12.39 03 31 09.2 | CFHT | 0.6 | 22.52.7 | 9.8 | 7.906 | -2.450 | – – |
| GJ 82 | 01 59 23.5 58 31 16.2 | CFHT | 4.2 | 9.12.7 | 11.12 | 7.79 | -2.344 | – – |
| GJ 3136 | 02 08 53.6 49 26 56.6 | CFHT | 2.9 | 13.71.4 | 9.6 | 8.423 | -2.167 | – – |
| 1RXS J021836.6+121902 | 02 18 36.55 12 18 58.0 jjRiaz et al. (2006) obtained low-resolution spectra of these targets. | CFHT | 1.9 | 20.12.7 | 9.9 | 8.797 | -2.597 | – – |
| GJ 3150 | 02 19 2.29 23 52 55.1 | CFHT | 3.6 | 18.42.7 | 10.89 | 9.777 | -2.302 | – – |
| 1RXS J022735.8+471021 | 02 27 37.26 47 10 04.5 | CFHT | 4.6 | 14.52.7 | 11.47 | 10.306 | -2.418 | – – |
| 1RXS J023138.7+445640 | 02 31 39.27 44 56 38.8 | CFHT | 4.4 | 12.92.4 | 11.1 | 9.97 | -2.456 | – – |
| G 36-26 | 02 36 44.13 22 40 26.5 | CFHT | 5.9 | 12.81.1 | 11.39 | 10.081 | -2.009 | – – |
| GJ 3174 | 02 39 17.35 07 28 17.0 | CFHT | 3.7 | 19.72.7 | 11.02 | 9.881 | -2.392 | – – |
| LP 247-13 | 03 15 37.83 37 24 14.3 | CFHT | 2.7 | 25.44.0 | 10.49 | 9.317 | -2.204 | – – |
| G 246-33 | 03 19 28.73 61 56 04.6 | CFHT | 4.1 | 10.92.7 | 10.92 | 9.511 | -2.169 | – – |
| 1RXS J032230.7+285852 | 03 22 31.66 28 58 29.2 | Keck | 4.0 | 18.02.7 | 11.89 | 10.823 | -2.119 | – – |
| 2MASS J03350208+2342356 | 03 35 2.09 23 42 35.6 | Keck | 8.5 | 59kkThe photometric distances have been corrected here for overluminosity due the very young stellar ages listed in Table 2 using evolutionary models of Baraffe et al. (1998). The binarity of 2M1553 as also taken into account. | – | 12.25 | – | – – |
| 1RXS J034231.8+121622 | 03 42 31.8 12 16 22.6 jjRiaz et al. (2006) obtained low-resolution spectra of these targets. | Keck | 5.2 | 17.92.7 | 11.21 | 10.157 | -2.144 | SB1 |
| G 80-21 | 03 47 23.33 -01 58 19.5 jjRiaz et al. (2006) obtained low-resolution spectra of these targets. | Keck | 2.8 | 16.30.8 | 13.02 | 7.804 | -2.346 | – – |
| II Tau | 03 49 43.25 24 19 04.7 | Keck | 4.6 | 20.43.8 | 10.67 | 9.805 | -2.338 | – – |
| 1RXS J041325.8–013919 | 04 13 25.76 -01 39 41.7 jjRiaz et al. (2006) obtained low-resolution spectra of these targets. | Keck | 5.3 | 9.41.5 | 10.94 | 9.375 | -2.312 | 0.79” VB (McCarthy et al., 2001) |
| 1RXS J041417.0–090650 | 04 14 17.3 -09 06 54.4 jjRiaz et al. (2006) obtained low-resolution spectra of these targets. | Keck | 4.3 | 10.61.7 | 11.12 | 9.63 | -1.922 | SB1 |
| GJ 3287 | 04 27 41.3 59 35 16.7 | CFHT | 3.8 | 20.12.7 | 11.32 | 9.975 | -2.402 | – – |
| GJ 3305 | 04 37 37.46 -02 29 28.3 jjRiaz et al. (2006) obtained low-resolution spectra of these targets. | Keck | 1.1 | 15.81.6 | 4.94 | 7.299 | -1.866 | – – |
| GJ 3304 | 04 38 12.56 28 13 00.1 | Keck | 4.6 | 14.53.8 | 9.86 | 8.173 | -2.350 | 0.783” VB (Beuzit et al., 2004; Daemgen et al., 2007) |
| NLTT 13728 | 04 40 23.25 -05 30 08.3 | Keck | 6.0 | 10.30.9 | 13.08 | 10.658 | -2.139 | – – |
| NLTT 13837 | 04 44 8.15 14 01 22.9 | Keck | 4.3 | 28.84.4 | 11.02 | 9.843 | -2.360 | – – |
| NLTT 13844 | 04 45 5.62 43 24 34.2 | Keck | 4.6 | 22.52.7 | 13.2 | 10.84 | -2.320 | – – |
| 2MASS J04465175–1116476 | 04 46 51.75 -11 16 47.6 | Keck | 4.9 | 13.42.2 | 9.56 | 8.144 | -2.486 | VB (this work) |
| 2MASS J04472312–2750358 | 04 47 23.13 -27 50 35.8 | Keck | 0.5 | 10.91.8 | 8.43 | 7.66 | -2.148 | – – |
| G 81-34 | 04 49 29.47 48 28 45.9 | CFHT | 4.0 | 13.62.7 | 10.55 | 9.059 | -2.379 | – – |
| 1RXS J045101.0+312734 | 04 51 1.38 31 27 23.9 | Keck | 3.7 | 22.22.7 | 10.25 | 9.011 | -2.209 | – – |
| NLTT 14116 | 04 52 24.41 -16 49 21.9 jjRiaz et al. (2006) obtained low-resolution spectra of these targets. | Keck | 3.3 | 17.41.2 | 10.43 | 7.74 | -2.389 | 1.48” G. Anglada-Escudé (priv. comm.) |
| GJ 3335 | 05 09 9.97 15 27 32.5 | Keck | 3.5 | 18.32.7 | 10.16 | 8.77 | -2.324 | – – |
| NLTT 15049 | 05 25 41.67 -09 09 12.3 jjRiaz et al. (2006) obtained low-resolution spectra of these targets. | Keck | 3.8 | 20.24.7 | 10.13 | 8.454 | -2.416 | 0.537” VB (Daemgen et al., 2007) |
| GJ 207.1 | 05 33 44.81 01 56 43.4 | Keck | 2.0 | 16.81.2ggDistances from the Hipparcos & Tycho Catalogues (Perryman & ESA 1997) using trigonometric parallaxes. | 10.43 | 7.764 | -2.298 | – – |
| 1RXS J055446.0+105559 | 05 54 45.74 10 55 57.1 | CFHT | 2.1 | 20.32.7 | 10.23 | 8.832 | -2.337 | – – |
| 2MASS J05575096–1359503 | 05 57 50.97 -13 59 50.3 | Keck | 7.0 | 60kkThe photometric distances have been corrected here for overluminosity due the very young stellar ages listed in Table 2 using evolutionary models of Baraffe et al. (1998). The binarity of 2M1553 as also taken into account. | 16.49 | 12.871 | -1.672 | – – |
| GJ 3372 B | 05 59 55.69 58 34 15.6 | CFHT | 4.2 | 12.72.7 | 10.5 | 9.028 | -2.403 | – – |
| G 249-36 | 06 05 29.36 60 49 23.2 | CFHT | 4.9 | 10.62.7 | 10.74 | 9.096 | -2.247 | – – |
| GJ 3395 | 06 31 1.16 50 02 48.6 | CFHT | 0.8 | 19.62.7 | 9.37 | 7.873 | -2.448 | – – |
| G 108-36 | 06 51 59.02 03 12 55.3 | CFHT | 2.5 | 23.42.7 | 10.28 | 9.139 | -2.306 | – – |
| GJ 3417 (NE) | 06 57 57.04 62 19 19.7 | CFHT | 5.2 | 9.52.7 | 10.25 | 8.585 | -2.100 | VB (this work) |
| GJ 2060 | 07 28 51.38 -30 14 49.1 | Keck | 1.3 | 15.82.3ggDistances from the Hipparcos & Tycho Catalogues (Perryman & ESA 1997) using trigonometric parallaxes. | 8.39 | 6.615 | -2.207 | VB - quadruple system (Allen & Reid, 2008), SB1 |
| GJ 277B | 07 31 57.35 36 13 47.8 | Keck | 3.3 | 11.50.7ggDistances from the Hipparcos & Tycho Catalogues (Perryman & ESA 1997) using trigonometric parallaxes. | – | 7.571 | -2.081 | – – |
| 1RXS J073829.3+240014 | 07 38 29.52 24 00 08.8 | Keck | 2.7 | – | 10.32 | 8.928 | -2.008 | – – |
| NLTT 18549 | 07 52 23.9 16 12 15.7 | Keck | 10.50.5 | – | 10.879 | – | SB1 | |
| 2MASS J07572716+1201273 | 07 57 27.16 12 01 27.3 | Keck | 2.3 | 23.03.7 | 10.03 | 9.06 | -2.411 | SB1 |
| 2MASS J08031018+2022154 | 08 03 10.18 20 22 15.5 jjRiaz et al. (2006) obtained low-resolution spectra of these targets. | Keck | 3.3 | 23.43.8 | 10.34 | 9.242 | -1.899 | SB1 |
| GJ 316.1 | 08 40 29.75 18 24 09.2 | Keck | 6.0 | 14.10.2 | – | 11.053 | -1.033 | SB1 |
| NLTT 20303 | 08 48 36.45 -13 53 08.4 | Keck | 2.6 | 16.41.7 | 9.22 | 8.748 | -1.701 | SB1 |
| 1RXS J091744.5+461229 | 09 17 44.73 46 12 24.7 | Keck | 1.7 | 18.93.0 | – | 8.126 | -2.009 | SB1 |
| G 43-2 | 09 48 50.2 15 38 44.9 | Keck | hhThese targets were plagued with poor seeing and/or low S/N and no previously published SpT. Therefore, we did a by-eye comparison of the TiO bands with spectra of known SpT. The error for these is 1 subclass. | 24.32.7 | – | 9.303 | -2.419 | – – |
| NLTT 22741 | 09 51 4.6 35 58 09.8 | Keck | 4.5 | 23.02.7 | 11.89 | 10.577 | -2.349 | M4.5/L6 wide VB (Reid & Walkowicz, 2006) |
| GJ 3577 A (W) | 09 59 18.8 43 50 25.6 | Keck | 3.5eeDue to either poor S/N or bad seeing, we were unable to measure reliable TiO indices for these targets and defer to the published SpT ( subclasses) based on low-resolution data (Reid et al. 2002b, 2007a). | 26.22.7 | 10.72 | 9.682 | -1.922 | VB (this work) |
| G 196-3A | 10 04 21.49 50 23 13.6 | Keck | 3.0eeDue to either poor S/N or bad seeing, we were unable to measure reliable TiO indices for these targets and defer to the published SpT ( subclasses) based on low-resolution data (Reid et al. 2002b, 2007a). | 14.92.7 | 10.74 | 8.081 | -2.063 | – – |
| GJ 2079 | 10 14 19.19 21 04 29.8 | Keck | 0.7 | 20.40.7ggDistances from the Hipparcos & Tycho Catalogues (Perryman & ESA 1997) using trigonometric parallaxes. | 8.64 | 7.074 | -2.640 | – – |
| 1RXS J101432.0+060649 | 10 14 31.95 06 06 41.0 | Keck | 4.1 | 17.72.7 | 9.94 | 8.879 | -2.169 | VB ( 0.7”) (this work) |
| GJ 388 | 10 19 36.35 19 52 12.2 | Keck | 3.5eeDue to either poor S/N or bad seeing, we were unable to measure reliable TiO indices for these targets and defer to the published SpT ( subclasses) based on low-resolution data (Reid et al. 2002b, 2007a). | 4.90.1ggDistances from the Hipparcos & Tycho Catalogues (Perryman & ESA 1997) using trigonometric parallaxes. | 7.78 | 5.449 | -2.389 | – – |
| G 44-9 | 10 20 44.07 08 14 23.4 | Keck | 5.9 | 20.22.7 | 12.13 | 10.354 | -2.365 | – – |
| 2MASS J10364483+1521394 | 10 36 44.84 15 21 39.5 | Keck | 4.0eeDue to either poor S/N or bad seeing, we were unable to measure reliable TiO indices for these targets and defer to the published SpT ( subclasses) based on low-resolution data (Reid et al. 2002b, 2007a). | 19.64.6 | 10.03 | 8.748 | -2.186 | 1.061” VB (Daemgen et al., 2007) |
| GJ 3629 | 10 51 20.6 36 07 25.6 | Keck | 3.0eeDue to either poor S/N or bad seeing, we were unable to measure reliable TiO indices for these targets and defer to the published SpT ( subclasses) based on low-resolution data (Reid et al. 2002b, 2007a). | 16.72.7 | 10.63 | 9.422 | -2.187 | – – |
| GJ 3639 | 11 03 10 36 39 08.5 | Keck | 3.5eeDue to either poor S/N or bad seeing, we were unable to measure reliable TiO indices for these targets and defer to the published SpT ( subclasses) based on low-resolution data (Reid et al. 2002b, 2007a). | 18.62.7 | 10.44 | 9.464 | -2.327 | – – |
| NLTT 26114 | 11 03 21.25 13 37 57.1 | Keck | hhThese targets were plagued with poor seeing and/or low S/N and no previously published SpT. Therefore, we did a by-eye comparison of the TiO bands with spectra of known SpT. The error for these is 1 subclass. | 14.11.5 | – | 8.759 | -2.287 | – – |
| G 119-62 | 11 11 51.76 33 32 11.2 | Keck | 3.5eeDue to either poor S/N or bad seeing, we were unable to measure reliable TiO indices for these targets and defer to the published SpT ( subclasses) based on low-resolution data (Reid et al. 2002b, 2007a). | 13.61.3 | 9.71 | 8.297 | -2.234 | – – |
| 1RXS J111300.1+102518 | 11 13 0.6 10 25 05.9 | Keck | hhThese targets were plagued with poor seeing and/or low S/N and no previously published SpT. Therefore, we did a by-eye comparison of the TiO bands with spectra of known SpT. The error for these is 1 subclass. | 20.22.7 | 11.39 | 10.032 | -2.201 | – – |
| GJ 3653 | 11 15 54.04 55 19 50.6 | Keck | 0.5eeDue to either poor S/N or bad seeing, we were unable to measure reliable TiO indices for these targets and defer to the published SpT ( subclasses) based on low-resolution data (Reid et al. 2002b, 2007a). | 22.32.7 | 9.56 | 8.09 | -2.381 | – – |
| 2MASS J11240434+3808108 | 11 24 4.35 38 08 10.9 | Keck | hhThese targets were plagued with poor seeing and/or low S/N and no previously published SpT. Therefore, we did a by-eye comparison of the TiO bands with spectra of known SpT. The error for these is 1 subclass. | 19.23.1 | 10.64 | 9.928 | -2.241 | – – |
| G 10-52 | 11 48 35.49 07 41 40.4 | Keck | hhThese targets were plagued with poor seeing and/or low S/N and no previously published SpT. Therefore, we did a by-eye comparison of the TiO bands with spectra of known SpT. The error for these is 1 subclass. | 16.02.7 | 10.62 | 9.476 | -2.423 | – – |
| 2MASS J12065663+7007514 (E) | 12 06 56.63 70 07 51.4 jjRiaz et al. (2006) obtained low-resolution spectra of these targets. | CFHT | 4.4 | 16.81.9 | 9.1 | 9.251 | -1.758 | VB (this work) |
| G 122-74 | 12 12 11.36 48 49 03.2 | Keck | hhThese targets were plagued with poor seeing and/or low S/N and no previously published SpT. Therefore, we did a by-eye comparison of the TiO bands with spectra of known SpT. The error for these is 1 subclass. | 23.32.7 | 10.04 | 9.258 | -2.536 | VB (this work) |
| GJ 3729 | 12 29 2.9 41 43 49.7 | Keck | 3.5eeDue to either poor S/N or bad seeing, we were unable to measure reliable TiO indices for these targets and defer to the published SpT ( subclasses) based on low-resolution data (Reid et al. 2002b, 2007a). | 15.22.7 | 9.87 | 8.786 | -2.496 | – – |
| GJ 3730 | 12 29 27.13 22 59 46.7 | Keck | 4.0eeDue to either poor S/N or bad seeing, we were unable to measure reliable TiO indices for these targets and defer to the published SpT ( subclasses) based on low-resolution data (Reid et al. 2002b, 2007a). | 16.72.7 | 11.04 | 9.823 | -2.105 | – – |
| 1RXS J124147.5+564506 | 12 41 47.37 56 45 13.8 jjRiaz et al. (2006) obtained low-resolution spectra of these targets. | Keck | 2.5eeDue to either poor S/N or bad seeing, we were unable to measure reliable TiO indices for these targets and defer to the published SpT ( subclasses) based on low-resolution data (Reid et al. 2002b, 2007a). | 26.24.2 | 10.4 | 9.483 | -2.091 | – – |
| GJ 490 B | 12 57 39.35 35 13 19.5 | Keck | 4.0eeDue to either poor S/N or bad seeing, we were unable to measure reliable TiO indices for these targets and defer to the published SpT ( subclasses) based on low-resolution data (Reid et al. 2002b, 2007a). | 18.01.1ggDistances from the Hipparcos & Tycho Catalogues (Perryman & ESA 1997) using trigonometric parallaxes. | 14.78 | 8.872 | -1.648 | – – |
| GJ 490 A | 12 57 40.3 35 13 30.6 | Keck | 0.5eeDue to either poor S/N or bad seeing, we were unable to measure reliable TiO indices for these targets and defer to the published SpT ( subclasses) based on low-resolution data (Reid et al. 2002b, 2007a). | 18.01.1ggDistances from the Hipparcos & Tycho Catalogues (Perryman & ESA 1997) using trigonometric parallaxes. | 8.84 | 7.401 | -2.236 | Pphot=3.17 d (Pettersen, 1980; Norton et al., 2007)ffNorton et al. (2007) attribute the photometric period to an eclipsing binary of BY Dra-type, however we see no evidence that this target is a spectroscopic binary. |
| NLTT 32659 (E) | 13 02 5.87 12 22 21.6 | Keck | 3.7 | 28.42.7 | 9.96 | 9.089 | -2.337 | VB (this work) |
| NLTT 32659 (W) | 13 02 5.87 12 22 21.6 | Keck | 1.6 | 28.42.7 | 9.96 | 9.089 | -2.337 | VB (this work), SB1 |
| GJ 1167 A | 13 09 34.95 28 59 06.6 jjRiaz et al. (2006) obtained low-resolution spectra of these targets. | Keck | 4.8 | 11.52.4ggDistances from the Hipparcos & Tycho Catalogues (Perryman & ESA 1997) using trigonometric parallaxes. | 10.67 | 9.476 | -2.308 | SB1 |
| GJ 3786 | 13 27 19.67 -31 10 39.4 jjRiaz et al. (2006) obtained low-resolution spectra of these targets. | Keck | 3.5eeDue to either poor S/N or bad seeing, we were unable to measure reliable TiO indices for these targets and defer to the published SpT ( subclasses) based on low-resolution data (Reid et al. 2002b, 2007a). | 19.64.6 | 10.89 | 9.329 | -2.327 | 0.544” VB (Daemgen et al., 2007), SB1 |
| 2MASS J13292408–1422122 | 13 29 24.08 -14 22 12.3 jjRiaz et al. (2006) obtained low-resolution spectra of these targets. | CFHT | 2.8 | 22.63.6 | 10.42 | 9.061 | -2.531 | – – |
| 2MASS J14215503–3125537 | 14 21 55.04 -31 25 53.7 | Keck | 3.9 | – | 10.98 | 9.66 | -2.151 | SB1 |
| 2MASS J1442809–0424078 | 14 44 28.1 -04 24 07.8 jjRiaz et al. (2006) obtained low-resolution spectra of these targets. | Keck | 3.0 | 27.54.4 | 11.01 | 9.728 | -2.411 | SB1 |
| 1RXS J150907.2+590422 | 15 09 6.96 59 04 28.2 jjRiaz et al. (2006) obtained low-resolution spectra of these targets. | CFHT | 2.2 | 25.84.2 | 9.66 | 9.249 | -2.356 | – – |
| GJ 9520 | 15 21 52.92 20 58 39.5 | Keck | 1.0 | 11.40.3 | 8.41 | 6.61 | -2.485 | SB1 |
| NLTT 40561 | 15 33 50.62 25 10 10.6 | Keck | 3.5 | 23.22.7 | 11.31 | 10.433 | -2.282 | SB1 |
| G 167-54 | 15 43 48.48 25 52 37.7 | Keck | 4.1 | 21.12.7 | 11.3 | 10.022 | -2.305 | SB1 |
| 2MASS J15534211–2049282 (S) | 15 53 42.12 -20 49 28.2 | Keck | 3.4 | 145kkThe photometric distances have been corrected here for overluminosity due the very young stellar ages listed in Table 2 using evolutionary models of Baraffe et al. (1998). The binarity of 2M1553 as also taken into account. | 13.44 | 11.256 | – | VB (this work), SB1 |
| GJ 3928 | 15 55 31.78 35 12 02.9 jjRiaz et al. (2006) obtained low-resolution spectra of these targets. | CFHT | 5.3 | 12.63.6 | 10.51 | 8.928 | -2.274 | 1.571” VB (Daemgen et al., 2007) |
| NLTT 43695 (E) | 16 51 9.95 35 55 07.1 jjRiaz et al. (2006) obtained low-resolution spectra of these targets. | Keck | 4.6 | 34.53.9 | 11.67 | 10.334 | -2.094 | VB (this work), SB1 |
| LP 331-57 | 17 03 52.83 32 11 45.6 jjRiaz et al. (2006) obtained low-resolution spectra of these targets. | CFHT | 2.4 | 18.01.2 | 10.94 | 7.886 | -2.659 | Pphot=15.4221 d, 1.13” VB (Norton et al., 2007; Daemgen et al., 2007)ffNorton et al. (2007) attribute the photometric period to an eclipsing binary of BY Dra-type, however we see no evidence that this target is a spectroscopic binary. |
| GJ 616.2 | 17 19 52.98 26 30 02.6 | Keck | 5.6 | 10.80.2ggDistances from the Hipparcos & Tycho Catalogues (Perryman & ESA 1997) using trigonometric parallaxes. | 8.78 | 8.229 | -2.036 | SB1 |
| GJ 669A | 17 19 54.22 26 30 03.0 | Keck | 3.4 | 12.00.9ggDistances from the Hipparcos & Tycho Catalogues (Perryman & ESA 1997) using trigonometric parallaxes. | 9.6 | 7.273 | -2.418 | SB1 |
| 1RXS J173130.9+272134 | 17 31 29.75 27 21 23.3 | Keck | 2.6 | 16.12.7 | 14.94 | 12.094 | -1.507 | SB1 |
| G 227-22 | 18 02 16.6 64 15 44.6 jjRiaz et al. (2006) obtained low-resolution spectra of these targets. | Keck | 6.1 | 7.10.6 | 9.92 | 8.541 | -2.536 | SB1 |
| GJ 4044 | 18 13 6.57 26 01 51.9 | Keck | 4.5 | 12.12.7 | 10.39 | 8.899 | -2.018 | VB of LP 390-16, Pphot=2.2838 d (this work) SB1 |
| LP 390-16 | 18 13 6.57 26 01 51.9 | CFHT | 3.8 | 13.21.5 | 10.39 | 8.899 | -2.018 | VB of GJ 4044 (this work) |
| 1RXS J183203.0+203050 (N) | 18 32 2.91 20 30 58.1 | Keck | 4.9 | 21.62.7 | 11.45 | 10.653 | -1.565 | VB (this work), SB1 |
| 1RXS J183203.0+203050 (S) | 18 32 2.91 20 30 58.1 | Keck | 5.1 | 21.62.7 | 11.45 | 10.653 | -1.565 | VB (this work), SB1 |
| 1RXS J184410.0+712909 (E) | 18 44 10.2 71 29 17.6 | CFHT | 3.9 | 22.22.7 | 10.73 | 10.138 | -2.502 | VB (this work) |
| 1RXS J184410.0+712909 (W) | 18 44 10.2 71 29 17.6 | CFHT | 4.1 | 22.22.7 | 10.73 | 10.138 | -2.502 | VB (this work) |
| GJ 9652 A | 19 14 39.26 19 19 02.6 | Keck | 4.5 | 19.11.1ggDistances from the Hipparcos & Tycho Catalogues (Perryman & ESA 1997) using trigonometric parallaxes. | 10.46 | 7.579 | -2.335 | SB1 |
| 2MASS J19303829–1335083 | 19 30 38.3 -13 35 08.4 | Keck | 6.0 | 25.04.0 | 13.61 | 11.53 | -2.269 | SB1 |
| 1RXS J193124.2–213422 | 19 31 24.34 -21 34 22.6 jjRiaz et al. (2006) obtained low-resolution spectra of these targets. | Keck | 2.4 | 19.03.1 | 10.23 | 8.694 | -2.469 | SB1 |
| 1RXS J193528.9+374605 | 19 35 29.23 37 46 08.2 | Keck | 3.0 | 9.42.7 | 9.91 | 7.562 | -2.514 | SB1 |
| 1RXS J194213.0–204547 | 19 42 12.82 -20 45 47.8 jjRiaz et al. (2006) obtained low-resolution spectra of these targets. | Keck | 5.1 | 10.81.7 | 11.07 | 9.598 | -2.249 | SB1 |
| G 125-36 | 19 50 15.93 31 46 59.9 | Keck | 2.1 | 24.22.7 | 10.34 | 9.178 | -2.306 | SB1 |
| 2MASS J20003177+5921289 | 20 00 31.77 59 21 29.0 | Keck | 4.1 | 20.93.4 | 9.99 | 9.636 | -2.243 | SB1 |
| 1RXS J204340.6–243410 (NE) | 20 43 41.15 -24 33 53.5 jjRiaz et al. (2006) obtained low-resolution spectra of these targets. | Keck | 3.7 | 24.72.8 | 10.08 | 8.597 | -2.243 | VB (this work), SB1 |
| 1RXS J204340.6–243410 (SW) | 20 43 41.15 -24 33 53.5 | Keck | 4.1 | 24.72.8 | 10.08 | 8.597 | -2.243 | VB (this work), SB1 |
| NLTT 49856 | 20 46 43.61 -11 48 13.2 jjRiaz et al. (2006) obtained low-resolution spectra of these targets. | Keck | 4.5 | 14.62.2 | 10.48 | 9.349 | -2.222 | SB1 |
| 2MASS J20530910–0133039 | 20 53 9.1 -01 33 04.0 jjRiaz et al. (2006) obtained low-resolution spectra of these targets. | CFHT | 5.6 | 16.51.5 | 11.39 | 10.659 | -2.362 | SB1 |
| NLTT 50066 | 20 53 14.65 -02 21 21.9 jjRiaz et al. (2006) obtained low-resolution spectra of these targets. | CFHT | 2.9 | 23.73.8 | 10.68 | 9.329 | -2.601 | – – |
| GJ 4185B | 21 16 3.79 29 51 46.0 | Keck | 3.3 | 16.12.7 | 10.45 | 9.295 | -1.816 | SB1 |
| GJ 4185 A | 21 16 5.77 29 51 51.1 | Keck | 3.3 | 8.42.7 | 9.84 | 8.448 | -2.155 | SB1 |
| GJ 4231 | 21 52 10.4 05 37 35.7 | Keck | 2.4 | 14.62.7 | 13.62 | 8.248 | -2.359 | SB1 |
| 1RXS J221419.3+253411 | 22 14 17.66 25 34 06.6 | Keck | 4.3 | 23.92.7 | 11.33 | 10.177 | -2.355 | SB1 |
| GJ 4282 (E) | 22 33 22.65 -09 36 53.8 jjRiaz et al. (2006) obtained low-resolution spectra of these targets. | CFHT | 2.5 | 26.74.1 | 9.91 | 8.534 | -2.173 | 1.571” VB (Daemgen et al., 2007) |
| GJ 4282 (W) | 22 33 22.65 -09 36 53.8 | CFHT | 2.6 | 26.74.1 | 9.91 | 8.534 | -2.173 | 1.571” VB (Daemgen et al., 2007) |
| 2MASS J22344161+4041387 | 22 34 41.62 40 41 38.8 | Keck | 6.0 | 325llDistance from Allers et al. (2009). | 14.24 | 12.573 | -2.470 | 0.16” VB (Allers et al., 2009) SB1 |
| LP 984-91 | 22 44 57.94 -33 15 01.6 jjRiaz et al. (2006) obtained low-resolution spectra of these targets. | Keck | 4.5 | 23.72.0 | 13.51 | 7.786 | -1.988 | SB1 |
| GJ 873 | 22 46 49.81 44 20 03.1 | CFHT | 3.2 | 5.10.0 | 8.88 | 6.106 | -1.928 | SB1 |
| NLTT 54873 | 22 47 37.64 40 41 25.4 jjRiaz et al. (2006) obtained low-resolution spectra of these targets. | CFHT | 3.8 | 21.72.7 | 11.44 | 10.35 | -1.980 | SB1 |
| GJ 875.1 | 22 51 53.49 31 45 15.3 jjRiaz et al. (2006) obtained low-resolution spectra of these targets. | CFHT | 2.7 | 14.30.6 | 10.5 | 7.697 | -2.351 | SB1 |
| 2MASS J22581643–1104170 | 22 58 16.43 -11 04 17.1 | CFHT | 2.7 | 23.03.7 | 10.27 | 9.071 | -2.469 | – – |
| GJ 9809 | 23 06 4.83 63 55 34.0 | CFHT | 0.3 | 24.91.0ggDistances from the Hipparcos & Tycho Catalogues (Perryman & ESA 1997) using trigonometric parallaxes. | 9.6 | 7.815 | -2.281 | SB1 |
| NLTT 56194 | 23 13 47.28 21 17 29.4 | Keck | 7.5 | 20.22.7 | 13.03 | 11.421 | -2.097 | SB1 |
| NLTT 56566 | 23 20 57.66 -01 47 37.3 jjRiaz et al. (2006) obtained low-resolution spectra of these targets. | CFHT | 3.8 | 22.66.7 | 10.76 | 9.355 | -2.362 | 0.099” VB (Daemgen et al., 2007) |
| GJ 4338 B | 23 29 22.58 41 27 52.2 | CFHT | 4.2 | 14.80.4ggDistances from the Hipparcos & Tycho Catalogues (Perryman & ESA 1997) using trigonometric parallaxes. | 8.48 | 8.017 | -2.041 | SB1 |
| GJ 4337 A | 23 29 23.46 41 28 06.9 | CFHT | 2.9 | 14.80.4ggDistances from the Hipparcos & Tycho Catalogues (Perryman & ESA 1997) using trigonometric parallaxes. | 10 | 7.925 | -2.077 | SB1 |
| GJ 1290 | 23 44 20.84 21 36 05.0 | CFHT | 3.4 | 22.02.2ggDistances from the Hipparcos & Tycho Catalogues (Perryman & ESA 1997) using trigonometric parallaxes. | 10.41 | 9.07 | -2.406 | SB1 |
| 1RXS J235005.6+265942 | 23 50 6.39 26 59 51.9 jjRiaz et al. (2006) obtained low-resolution spectra of these targets. | CFHT | 4.0 | 26.54.3 | 11.22 | 10.142 | -2.192 | SB1 |
| G 68-46 | 23 51 22.28 23 44 20.8 jjRiaz et al. (2006) obtained low-resolution spectra of these targets. | CFHT | 4.0 | 18.13.3 | 10.79 | 9.683 | -2.469 | SB1 |
| 1RXS J235133.3+312720 | 23 51 33.67 31 27 23.0 | CFHT | 2.0 | 35.05.6 | 10.92 | 9.821 | -2.228 | SB1 |
| 1RXS J235452.2+383129 | 23 54 51.47 38 31 36.3 | CFHT | 3.1 | 13.22.1 | 10.22 | 8.937 | -2.189 | SB1 |
| GJ 4381 | 23 57 49.9 38 37 46.9 | CFHT | 2.8 | 8.92.7 | 9.91 | 8.691 | -2.206 | SB1 |
| G 273-191 (N) | 23 58 13.66 -17 24 33.8 jjRiaz et al. (2006) obtained low-resolution spectra of these targets. | CFHT | 1.9 | 26.12.0 | 9.72 | 8.311 | -2.332 | 1.904” VB (Daemgen et al., 2007), SB1 |
| G 273-191 (S) | 23 58 13.66 -17 24 33.8 | CFHT | 1.9 | 26.12.0 | 9.72 | 8.311 | -2.332 | 1.904” VB (Daemgen et al., 2007), SB1 |
| G 130-31 | 23 59 19.86 32 41 24.5 | Keck | 5.6 | 23.92.7 | 11.8 | 10.451 | -2.241 | SB1 |
| Name | SpT | CaHaaEach of the two spectrographs used, Keck+HIRES and CFHT+ESPaDOnS, produces different error bars for measured values. As discussed in Section 4, the smaller errors for the CFHT data are due to the more stable fiber-fed instrumental set-up of ESPaDOnS. (See Table 1.) The measurement errors for Keck and CFHT respectively are: (CaH-wide) = 0.035, 0.008, (CaH-narr) = 0.051, 0.013, (K I EW) = 0.24, 0.16, (H EW) = 0.45, 0.21. Negative H EWs indicate the line is in emission. | CaHaaEach of the two spectrographs used, Keck+HIRES and CFHT+ESPaDOnS, produces different error bars for measured values. As discussed in Section 4, the smaller errors for the CFHT data are due to the more stable fiber-fed instrumental set-up of ESPaDOnS. (See Table 1.) The measurement errors for Keck and CFHT respectively are: (CaH-wide) = 0.035, 0.008, (CaH-narr) = 0.051, 0.013, (K I EW) = 0.24, 0.16, (H EW) = 0.45, 0.21. Negative H EWs indicate the line is in emission. | K I EWaaEach of the two spectrographs used, Keck+HIRES and CFHT+ESPaDOnS, produces different error bars for measured values. As discussed in Section 4, the smaller errors for the CFHT data are due to the more stable fiber-fed instrumental set-up of ESPaDOnS. (See Table 1.) The measurement errors for Keck and CFHT respectively are: (CaH-wide) = 0.035, 0.008, (CaH-narr) = 0.051, 0.013, (K I EW) = 0.24, 0.16, (H EW) = 0.45, 0.21. Negative H EWs indicate the line is in emission. | H EWaaEach of the two spectrographs used, Keck+HIRES and CFHT+ESPaDOnS, produces different error bars for measured values. As discussed in Section 4, the smaller errors for the CFHT data are due to the more stable fiber-fed instrumental set-up of ESPaDOnS. (See Table 1.) The measurement errors for Keck and CFHT respectively are: (CaH-wide) = 0.035, 0.008, (CaH-narr) = 0.051, 0.013, (K I EW) = 0.24, 0.16, (H EW) = 0.45, 0.21. Negative H EWs indicate the line is in emission. | YouthbbYouth index in binary format in order of least to most restrictive age indicator: low-g from CaH, low-g from K I, He I emission, Li detection, strong H emission (EW Å). Note that determining low-g targets of SpT M6 from the CaH and KI indicators is difficult unless extremely young. See Section 5.1 for more details. Also, due to either poor S/N or bad seeing, we were unable to measure reliable CaH indices from those spectra (denoted by a ‘?’). | Youth Indicator | AgeccAge limits are based on youth diagnostics discussed in Section 5, unless a target has been previously published to be a member of known young moving group, in which case the age of the group is adopted. For stars with no additional indications of youth, the lower limit is based on the lack of lithium in the spectra and the upper limit is the statistical age determined from their SpT and X-ray emission, i.e. A star of SpT earlier than M2.5 has an upper age limit of 150 Myr and one of later SpT 300 Myr. For the 11 stars with no significant H emission (i.e. Å), we list their activity lifetimes (400 Myr) as determined by West et al. (2008). These ages have large error bars on the order of 500 Myr. |
|---|---|---|---|---|---|---|---|---|
| M– () | wide | narr | (Å) | (Å) | Index | from literature | (Myr) | |
| 2MASS J00034227–2822410 | 7.0 | – | – | 2.35 | -2.19 | ?0000 | – – | 100-300 |
| G 217-32 | 3.8 | 1.45 | 1.65 | 0.91 | -3.42 | 01000 | – – | 35-300 |
| LP 348-40 | 3.5 | 1.26 | 1.40 | 1.01 | 0.13 | 11000 | – – | 2000 |
| NLTT 614 | 6.4 | 1.36 | 1.53 | 1.94 | -9.42 | 10100 | – – | 90-300 |
| 1RXS J001557.5–163659 | 4.1 | 1.43 | 1.61 | 1.91 | -4.36 | 00100 | – – | 35-300 |
| GJ 1006 A | 3.6 | 1.22 | 1.43 | 0.83 | -2.70 | 11000 | – – | 35-300 |
| GJ 3030 | 2.4 | 1.25 | 1.36 | 1.84 | -2.00 | 10000 | – – | 20-150 |
| GJ 3036 | 3.7 | 1.39 | 1.57 | 1.05 | -4.56 | 01000 | – – | 35-300 |
| NLTT 1875 | 4.3 | 1.31 | 1.47 | 1.42 | -2.63 | 10000 | – – | 40-300 |
| G 69-32 | 4.6 | 1.34 | 1.54 | 1.06 | -5.48 | 11000 | – – | 60-300 |
| G 132-51B (W) | 2.6 | 1.30 | 1.41 | 0.99 | -2.46 | 11000 | – – | 20-150 |
| G 132-51B (E) | 3.8 | 1.39 | 1.56 | 1.04 | -4.78 | 01000 | – – | 35-300 |
| G 269-153 (NE) | 4.3 | 1.42 | 1.60 | 1.76 | -6.62 | 01000 | – – | 40-300 |
| G 269-153 (SW) | 4.6 | 1.44 | 1.61 | 1.82 | -6.77 | 00000 | – – | 60-300 |
| G 172-56 | 5.4 | 1.46 | 1.68 | 1.09 | -9.72 | 00000 | – – | 60-300 |
| 2MASS J01351393–0712517 | 4.3 | 1.34 | 1.50 | 1.30 | -5.36 | 10000 | – – | 40-300 |
| G 271-110 | 3.5 | 1.40 | 1.58 | 1.79 | -5.03 | 00000 | – – | 25-300 |
| LHS 6032 (SW) | 1.3 | 1.23 | 1.32 | 1.35 | -2.35 | 00000 | – – | 15-150 |
| 1RXS J015027.1–185134 | 5.4 | 1.42 | 1.64 | 2.49 | -8.35 | 00000 | – – | 60-300 |
| NLTT 6549 | 1.5 | 1.21 | 1.31 | 0.89 | -2.16 | 11000 | – – | 15-150 |
| GJ 1041A (SW) | 0.6 | 1.11 | 1.16 | 0.68 | 0.59 | 11000 | – – | 15-150ddLP 348-40, GJ 1041A (SW) and G 108-36 appear to have low surface gravity using both the CaH and K I diagnostics but do not have any H emission. According to West et al. (2008), the lack of H implies an age 2000, 400 and 1200 (400) Myr, respectively. |
| GJ 82 | 4.2 | 1.35 | 1.50 | 1.57 | -4.37 | 10000 | – – | 35-300 |
| GJ 3136 | 2.9 | 1.35 | 1.49 | 1.30 | -5.63 | 00000 | flare star (Gershberg et al., 1999) | 20-300 |
| 1RXS J021836.6+121902 | 1.9 | 1.22 | 1.33 | 0.84 | -1.45 | 11000 | – – | 20-150 |
| GJ 3150 | 3.6 | 1.42 | 1.59 | 1.84 | -5.48 | 00000 | – – | 35-300 |
| 1RXS J022735.8+471021 | 4.6 | 1.50 | 1.65 | 2.03 | -8.85 | 00000 | – – | 60-300 |
| 1RXS J023138.7+445640 | 4.4 | 1.33 | 1.47 | 1.08 | -5.11 | 11000 | – – | 40-300 |
| G 36-26 | 5.9 | 1.43 | 1.62 | 2.21 | -3.45 | 10000 | – – | 90-300 |
| GJ 3174 | 3.7 | 1.35 | 1.51 | 1.85 | -2.40 | 10000 | – – | 35-300 |
| LP 247-13 | 2.7 | 1.29 | 1.41 | 0.89 | -3.99 | 11000 | weak-line T Tau? (Li & Hu, 1998) | 20-100 |
| G 246-33 | 4.1 | 1.44 | 1.60 | 2.12 | -4.65 | 00000 | – – | 35-300 |
| 1RXS J032230.7+285852 | 4.0 | 1.31 | 1.47 | 1.81 | -8.14 | 10000 | – – | 35-300 |
| 2MASS J03350208+2342356 | 8.5 | 1.29 | 1.43 | 3.15 | -10.72 | 11111 | Li detection (Reid et al., 2002b) | 10 |
| 1RXS J034231.8+121622 | 5.2 | 1.42 | 1.68 | 1.48 | -5.66 | 00000 | – – | 60-300 |
| G 80-21 | 2.8 | 1.33 | 1.54 | 0.81 | -2.76 | 01000 | AB Dor member (Zuckerman et al., 2004) | 30–50 |
| II Tau | 4.6 | 1.42 | 1.69 | 1.87 | -7.22 | 00000 | Pleiades member (Stauffer et al., 1991) | 120 |
| 1RXS J041325.8–013919 | 5.3 | 1.44 | 1.69 | 1.79 | -9.00 | 00000 | – – | 60-300 |
| 1RXS J041417.0–090650 | 4.3 | 1.50 | 1.79 | 1.67 | -14.15 | 00110 | – – | 40 |
| GJ 3287 | 3.8 | 1.38 | 1.55 | 1.47 | -2.04 | 00000 | flare star (Gershberg et al., 1999) | 35-300 |
| GJ 3305 | 1.1 | 1.20 | 1.36 | 0.79 | -2.10 | 01010 | Pic member (Torres et al., 2006) | 12 |
| GJ 3304 | 4.6 | 1.50 | 1.79 | 1.97 | -4.40 | 00000 | – – | 60-300 |
| NLTT 13728 | 6.0 | 1.62 | 1.90 | 2.75 | -19.11 | 00111 | – – | 90 |
| NLTT 13837 | 4.3 | 1.52 | 1.80 | 1.79 | -4.90 | 00000 | – – | 40-300 |
| NLTT 13844 | 4.6 | 1.42 | 1.74 | 2.06 | -3.63 | 00000 | – – | 60-300 |
| 2MASS J04465175–1116476 | 4.9 | 1.63 | 1.98 | 1.09 | -4.11 | 01000 | – – | 60-300 |
| 2MASS J04472312–2750358 | 0.5 | 1.14 | 1.28 | 0.75 | 0.47 | 01000 | – – | 400 |
| G 81-34 | 4.0 | 1.37 | 1.52 | 1.86 | -3.30 | 10000 | – – | 35-300 |
| 1RXS J045101.0+312734 | 3.7 | 1.43 | 1.70 | 1.39 | -2.31 | 00000 | – – | 35-300 |
| NLTT 14116 | 3.3 | 1.36 | 1.58 | 1.32 | -6.96 | 00000 | AB Dor member (Torres et al., 2008) | 30–50 |
| GJ 3335 | 3.5 | 1.31 | 1.49 | 1.07 | -3.08 | 11000 | – – | 25-300 |
| NLTT 15049 | 3.8 | 1.43 | 1.68 | 1.56 | -2.91 | 00000 | – – | 35-300 |
| GJ 207.1 | 2.0 | 1.35 | 1.64 | 1.53 | -4.96 | 00000 | flare star (Gershberg et al., 1999) | 20-150 |
| 1RXS J055446.0+105559 | 2.1 | 1.28 | 1.39 | 0.53 | -3.31 | 11000 | – – | 20-150 |
| 2MASS J05575096–1359503 | 7.0 | 1.15 | 1.49 | 0.13 | -25.56 | 11011 | mis-classified as giant (Cruz et al., 2007) | 10 |
| GJ 3372 B | 4.2 | 1.42 | 1.58 | 1.60 | -3.38 | 00000 | – – | 40-300 |
| G 249-36 | 4.9 | 1.32 | 1.52 | 1.26 | -6.11 | 10100 | – – | 60-300 |
| GJ 3395 | 0.8 | 1.17 | 1.26 | 0.59 | -1.46 | 01000 | – – | 20-150 |
| G 108-36 | 2.5 | 1.27 | 1.40 | 0.78 | -0.18 | 11000 | – – | 20-150ddLP 348-40, GJ 1041A (SW) and G 108-36 appear to have low surface gravity using both the CaH and K I diagnostics but do not have any H emission. According to West et al. (2008), the lack of H implies an age 2000, 400 and 1200 (400) Myr, respectively. |
| GJ 3417 (NE) | 5.2 | 1.36 | 1.52 | 0.26 | -3.06 | 11000 | – – | 60-300 |
| GJ 2060 | 1.3 | 1.24 | 1.41 | 0.88 | -3.10 | 01000 | AB Dor member (Zuckerman et al., 2004) | 30–50 |
| GJ 277B | 3.3 | 1.26 | 1.39 | 1.57 | -2.20 | 10000 | – – | 25-300 |
| 1RXS J073829.3+240014 | 2.7 | 1.35 | 1.51 | 1.88 | -3.78 | 00000 | – – | 20-300 |
| NLTT 18549 | 7.0 | 1.46 | 1.63 | 2.81 | -22.26 | 10101 | strong H emission (Cruz et al., 2003) | 100 |
| 2MASS J07572716+1201273 | 2.3 | 1.28 | 1.46 | 0.93 | -0.32 | 01000 | – – | 1200 |
| 2MASS J08031018+2022154 | 3.3 | 1.41 | 1.64 | 1.57 | -6.10 | 00000 | – – | 25-300 |
| GJ 316.1 | 6.0 | 1.59 | 1.96 | 3.46 | -22.68 | 00101 | – – | 100 |
| NLTT 20303 | 2.6 | 1.31 | 1.57 | 1.15 | -2.93 | 00000 | – – | 20-300 |
| 1RXS J091744.5+461229 | 1.7 | 1.25 | 1.40 | 1.04 | -3.89 | 01000 | – – | 20-150 |
| G 43-2 | 2.0 | – | – | 1.94 | -2.13 | ?0000 | – – | 20-150 |
| NLTT 22741 | 4.5 | – | – | 2.02 | -4.98 | ?0100 | 100–200 Myr (Reid & Walkowicz, 2006) | 40-300 |
| GJ 3577 A (W) | 3.5 | – | – | 1.98 | -6.07 | ?0000 | – – | 25-300 |
| G 196-3A | 3.0 | – | – | 1.07 | -3.77 | ?0000 | – – | 25-300 |
| GJ 2079 | 0.7 | – | – | 1.11 | -0.99 | ?1000 | – – | 400 |
| 1RXS J101432.0+060649 | 4.1 | – | – | 1.38 | -4.09 | ?0000 | – – | 35-300 |
| GJ 388 | 3.5 | – | – | 1.39 | -2.99 | ?0000 | – – | 25-300 |
| G 44-9 | 5.9 | – | – | 1.13 | -5.30 | ?0000 | – – | 90-300 |
| 2MASS J10364483+1521394 | 4.0 | – | – | 2.07 | -4.99 | ?0000 | – – | 35-300 |
| GJ 3629 | 3.0 | – | – | 1.25 | -3.07 | ?0000 | – – | 25-300 |
| GJ 3639 | 3.5 | – | – | 2.05 | -4.80 | ?0000 | – – | 25-300 |
| NLTT 26114 | 3.0 | – | – | 1.85 | -2.56 | ?0000 | – – | 25-300 |
| G 119-62 | 3.5 | – | – | 1.80 | -3.79 | ?0000 | – – | 25-300 |
| 1RXS J111300.1+102518 | 3.0 | – | – | 1.61 | -3.11 | ?0000 | – – | 25-300 |
| GJ 3653 | 0.5 | – | – | 0.90 | -2.06 | ?1000 | – – | 15-150 |
| 2MASS J11240434+3808108 | 4.5 | – | – | 1.74 | -3.19 | ?0000 | – – | 40-300 |
| G 10-52 | 3.5 | – | – | 1.54 | -4.36 | ?0000 | – – | 25-300 |
| 2MASS J12065663+7007514 (E) | 4.4 | 1.35 | 1.48 | 1.71 | -0.17 | 10000 | – – | 4500 |
| G 122-74 | 3.5 | – | – | 0.94 | 0.37 | ?0000 | – – | 2000 |
| GJ 3729 | 3.5 | – | – | 1.88 | -2.23 | ?0000 | – – | 25-300 |
| GJ 3730 | 4.0 | – | – | 1.27 | -1.42 | ?0000 | – – | 35-300 |
| 1RXS J124147.5+564506 | 2.5 | – | – | 1.67 | -3.67 | ?0000 | – – | 20-150 |
| GJ 490 B | 4.0 | – | – | 2.20 | -4.06 | ?0000 | – – | 35-300 |
| GJ 490 A | 0.5 | – | – | 1.05 | -1.29 | ?1000 | – – | 15-150 |
| NLTT 32659 (E) | 3.7 | 1.29 | 1.48 | 1.66 | -3.69 | 10000 | – – | 35-300 |
| NLTT 32659 (W) | 1.6 | 1.18 | 1.32 | 0.74 | -2.26 | 11000 | – – | 20-150 |
| GJ 1167 A | 4.8 | 1.40 | 1.62 | 2.66 | -4.82 | 00000 | flare star (Gershberg et al., 1999) | 60-300 |
| GJ 3786 | 3.5 | – | – | 2.11 | -3.43 | ?0000 | – – | 25-300 |
| 2MASS J13292408–1422122 | 2.8 | 1.33 | 1.48 | 1.44 | -3.08 | 00000 | – – | 20-150 |
| 2MASS J14215503–3125537 | 3.9 | 1.29 | 1.48 | 1.55 | -6.36 | 10100 | – – | 35-300 |
| 2MASS J1442809–0424078 | 3.0 | 1.31 | 1.50 | 1.29 | -4.63 | 00000 | – – | 20-150 |
| 1RXS J150907.2+590422 | 2.2 | 1.29 | 1.41 | 1.09 | -2.55 | 01000 | – – | 20-150 |
| GJ 9520 | 1.0 | 1.14 | 1.27 | 0.76 | -2.14 | 01000 | – – | 15-150 |
| NLTT 40561 | 3.5 | 1.30 | 1.47 | 1.57 | -7.27 | 10100 | – – | 25-300 |
| G 167-54 | 4.1 | 1.33 | 1.58 | 2.70 | -0.70 | 10000 | – – | 4500 |
| 2MASS J15534211–2049282 (S) | 3.4 | 1.23 | 1.41 | 0.55 | -78.35 | 11111 | low g (I.N. Reid, priv. comm.) | 3 |
| GJ 3928 | 5.3 | 1.37 | 1.51 | 2.11 | -5.94 | 10100 | – – | 60-300 |
| NLTT 43695 (E) | 4.6 | 1.27 | 1.51 | 1.88 | -3.19 | 10000 | – – | 60-300 |
| LP 331-57 | 2.4 | 1.30 | 1.43 | 1.45 | -1.62 | 00000 | – – | 20-150 |
| GJ 616.2 | 5.6 | 1.33 | 1.58 | 2.31 | -7.43 | 10000 | – – | 90-300 |
| GJ 669A | 3.4 | 1.23 | 1.43 | 1.56 | -0.90 | 10000 | – – | 2000 |
| 1RXS J173130.9+272134 | 2.6 | – | – | 4.89 | -7.31 | ?0000 | – – | 20-300 |
| G 227-22 | 6.1 | 1.52 | 1.76 | 2.51 | -7.70 | 00000 | – – | 90-300 |
| GJ 4044 | 4.5 | 1.42 | 1.64 | 1.98 | -6.99 | 00000 | flare star (Gershberg et al., 1999) | 40-300 |
| LP 390-16 | 3.8 | 1.38 | 1.55 | 1.79 | -4.34 | 00000 | – – | 35-300 |
| 1RXS J183203.0+203050 (N) | 4.9 | 1.40 | 1.63 | 2.61 | -3.14 | 00000 | – – | 60-300 |
| 1RXS J183203.0+203050 (S) | 5.1 | 1.47 | 1.71 | 2.29 | -10.92 | 00000 | – – | 60-300 |
| 1RXS J184410.0+712909 (E) | 3.9 | 1.37 | 1.53 | 1.59 | -5.24 | 00100 | – – | 35-300 |
| 1RXS J184410.0+712909 (W) | 4.1 | 1.43 | 1.70 | 2.15 | -3.17 | 00000 | – – | 35-300 |
| GJ 9652 A | 4.5 | 1.34 | 1.55 | 1.60 | -5.71 | 10000 | – – | 60-300 |
| 2MASS J19303829–1335083 | 6.0 | 1.38 | 1.57 | 3.06 | -4.90 | 10000 | – – | 90-300 |
| 1RXS J193124.2–213422 | 2.4 | 1.21 | 1.36 | 1.24 | -5.36 | 10000 | – – | 20-150 |
| 1RXS J193528.9+374605 | 3.0 | 1.25 | 1.45 | 1.60 | -2.58 | 10000 | – – | 20-300 |
| 1RXS J194213.0–204547 | 5.1 | 1.38 | 1.58 | 2.34 | -6.49 | 10000 | – – | 60-300 |
| G 125-36 | 2.1 | 1.22 | 1.39 | 1.13 | -0.24 | 00000 | – – | 1200 |
| 2MASS J20003177+5921289 | 4.1 | 1.43 | 1.64 | 1.87 | -5.67 | 00000 | – – | 35-300 |
| 1RXS J204340.6–243410 (NE) | 3.7 | 1.23 | 1.37 | 0.73 | -5.24 | 11000 | – – | 35-300 |
| 1RXS J204340.6–243410 (SW) | 4.1 | 1.31 | 1.49 | 0.79 | -8.03 | 11000 | – – | 35-300 |
| NLTT 49856 | 4.5 | 1.37 | 1.63 | 1.76 | -6.50 | 00100 | – – | 40-300 |
| 2MASS J20530910–0133039 | 5.6 | 1.53 | 1.85 | 1.92 | -3.15 | 00000 | – – | 90-300 |
| NLTT 50066 | 2.9 | 1.32 | 1.50 | 1.38 | -2.57 | 00000 | – – | 20-300 |
| GJ 4185B | 3.3 | 1.31 | 1.49 | 1.49 | -3.21 | 00000 | – – | 25-300 |
| GJ 4185 A | 3.3 | 1.32 | 1.51 | 1.77 | -5.50 | 00100 | – – | 25-300 |
| GJ 4231 | 2.4 | 1.21 | 1.37 | 1.22 | -4.19 | 10000 | – – | 20-150 |
| 1RXS J221419.3+253411 | 4.3 | 1.38 | 1.59 | 1.70 | -5.53 | 00000 | – – | 40-300 |
| GJ 4282 (E) | 2.5 | 1.33 | 1.47 | 1.02 | -4.41 | 01000 | – – | 20-150 |
| GJ 4282 (W) | 2.6 | 1.32 | 1.45 | 1.09 | -4.94 | 01000 | – – | 20-150 |
| 2MASS J22344161+4041387 | 6.0 | 1.20 | 1.27 | 0.14 | -46.00 | 11011 | low g, strong H (Cruz et al. 2003, Allers et al. 2009) | 1 |
| LP 984-91 | 4.5 | 1.33 | 1.50 | 0.62 | -7.80 | 11000 | Pic member (Torres et al., 2006) | 12 |
| GJ 873 | 3.2 | 1.36 | 1.52 | 1.59 | -3.63 | 00000 | flare star (Gershberg et al., 1999) | 25-300 |
| NLTT 54873 | 3.8 | 1.39 | 1.55 | 1.79 | -3.27 | 00100 | – – | 35-300 |
| GJ 875.1 | 2.7 | 1.29 | 1.41 | 1.30 | -3.38 | 10000 | – – | 20-300 |
| 2MASS J22581643–1104170 | 2.7 | 1.29 | 1.42 | 1.37 | -1.22 | 10000 | – – | 20-300 |
| GJ 9809 | 0.3 | 1.12 | 1.18 | 1.00 | -1.27 | 01010 | AB Dor member, Li detection (Zuckerman et al., 2004) | 30–50 |
| NLTT 56194 | 7.5 | 1.35 | 1.54 | 2.72 | -7.92 | 10000 | – – | 100-300 |
| NLTT 56566 | 3.8 | 1.34 | 1.47 | 1.65 | -4.18 | 10000 | – – | 35-300 |
| GJ 4338 B | 4.2 | 1.41 | 1.55 | 2.00 | -5.05 | 00000 | flare star (Gershberg et al., 1999) | 40-300 |
| GJ 4337 A | 2.9 | 1.30 | 1.42 | 1.47 | -3.48 | 10000 | – – | 20-300 |
| GJ 1290 | 3.4 | 1.32 | 1.46 | 1.59 | -1.69 | 10000 | – – | 25-300 |
| 1RXS J235005.6+265942 | 4.0 | 1.45 | 1.62 | 1.76 | -6.07 | 00000 | – – | 35-300 |
| G 68-46 | 4.0 | 1.38 | 1.54 | 1.53 | -5.69 | 00000 | – – | 35-300 |
| 1RXS J235133.3+312720 | 2.0 | 1.25 | 1.36 | 1.35 | -2.82 | 10000 | – – | 20-150 |
| 1RXS J235452.2+383129 | 3.1 | 1.35 | 1.51 | 1.53 | -3.39 | 00000 | – – | 25-300 |
| GJ 4381 | 2.8 | 1.31 | 1.45 | 1.46 | -3.73 | 00000 | – – | 20-300 |
| G 273-191 (N) | 1.9 | 1.24 | 1.35 | 1.10 | -3.26 | 11000 | – – | 20-150 |
| G 273-191 (S) | 1.9 | 1.24 | 1.36 | 1.04 | -2.98 | 01000 | – – | 20-150 |
| G 130-31 | 5.6 | 1.27 | 1.44 | 1.83 | -6.61 | 10000 | – – | 90-300 |
| Name | Tele- | SpT | log() | CaHaaEach of the two spectrographs used, Keck+HIRES and CFHT+ESPaDOnS, produces different error bars for the CaH indices and K I and H EWs. (See Table 1.) The errors for Keck and CFHT respectively are: (CaH-wide) = 0.035, 0.008, (CaH-narr) = 0.051, 0.013, (K I EW) = 0.24, 0.16, (H EW) = 0.45, 0.21). | CaHaaEach of the two spectrographs used, Keck+HIRES and CFHT+ESPaDOnS, produces different error bars for the CaH indices and K I and H EWs. (See Table 1.) The errors for Keck and CFHT respectively are: (CaH-wide) = 0.035, 0.008, (CaH-narr) = 0.051, 0.013, (K I EW) = 0.24, 0.16, (H EW) = 0.45, 0.21). | K IaaEach of the two spectrographs used, Keck+HIRES and CFHT+ESPaDOnS, produces different error bars for the CaH indices and K I and H EWs. (See Table 1.) The errors for Keck and CFHT respectively are: (CaH-wide) = 0.035, 0.008, (CaH-narr) = 0.051, 0.013, (K I EW) = 0.24, 0.16, (H EW) = 0.45, 0.21). | HaaEach of the two spectrographs used, Keck+HIRES and CFHT+ESPaDOnS, produces different error bars for the CaH indices and K I and H EWs. (See Table 1.) The errors for Keck and CFHT respectively are: (CaH-wide) = 0.035, 0.008, (CaH-narr) = 0.051, 0.013, (K I EW) = 0.24, 0.16, (H EW) = 0.45, 0.21). | [Fe/H]bbReferences: [1] Bonfils et al. (2005), [2] Casagrande et al. (2008), [3] Woolf & Wallerstein (2005), [4] Nidever et al. (2002), [5] Reid et al. (2002b), [6] Marcy & Benitz (1989). | [Fe/H] | RV | |
|---|---|---|---|---|---|---|---|---|---|---|---|
| scopeaaEach of the two spectrographs used, Keck+HIRES and CFHT+ESPaDOnS, produces different error bars for the CaH indices and K I and H EWs. (See Table 1.) The errors for Keck and CFHT respectively are: (CaH-wide) = 0.035, 0.008, (CaH-narr) = 0.051, 0.013, (K I EW) = 0.24, 0.16, (H EW) = 0.45, 0.21). | M– | 2MASS | wide | narr | Å | Å | publ. | J&AccAs discussed in the text, Johnson & Apps (2009) have shown that [Fe/H] determinations using the Bonfils et al. (2005), and thus the Casagrande et al. (2008), calibration are strongly underestimated. Here we have indicated whether the RV standard has higher or lower than solar metallicity using the new Johnson & Apps photometric calibration (Figure 8). Those that are left blank have colors beyond the limits of the new calibration, which is valid for 3.9 (V–K) 6.6. | SourcebbReferences: [1] Bonfils et al. (2005), [2] Casagrande et al. (2008), [3] Woolf & Wallerstein (2005), [4] Nidever et al. (2002), [5] Reid et al. (2002b), [6] Marcy & Benitz (1989). | ||
| GJ 406 | Keck | 6.0 | 7.085 | -2.928 | 1.50 | 1.69 | 3.45 | -9.03 | – | high | [4] |
| LHS 2065 | Keck | 9.0 | 11.212 | -3.336 | 1.09 | 1.21 | 1.94 | -30.49 | – | – | [5] |
| GJ 436 | Keck | 2.7 | 6.900 | – | 1.25 | 1.39 | 1.02 | 0.46 | +0.020.20 [1] | high | [4] |
| GJ 179 | CFHT | 3.7 | 7.814 | – | 1.27 | 1.38 | 1.36 | 0.09 | +0.020.30 [2] | high | [6] |
| GJ 908 | CFHT | 1.3 | 5.827 | -4.110 | 1.15 | 1.25 | 0.91 | 0.40 | –0.520.20 [1] | low | [4] |
| VB 10 | Keck | 8.0 | 9.908 | – | 1.39 | 1.61 | 3.57 | -4.29 | –0.050.20ccAs discussed in the text, Johnson & Apps (2009) have shown that [Fe/H] determinations using the Bonfils et al. (2005), and thus the Casagrande et al. (2008), calibration are strongly underestimated. Here we have indicated whether the RV standard has higher or lower than solar metallicity using the new Johnson & Apps photometric calibration (Figure 8). Those that are left blank have colors beyond the limits of the new calibration, which is valid for 3.9 (V–K) 6.6. [1] | – | [7] |
| GJ 205 | CFHT | 1.2 | 4.999 | -3.972 | 1.16 | 1.25 | 0.81 | 0.46 | +0.210.13 [3] | high | [6] |
| GJ 687 | CFHT | 3.2 | 5.335 | -4.347 | 1.24 | 1.36 | 1.15 | 0.16 | +0.150.09 [3] | high | [4] |
| GJ 821 | CFHT | 1.0 | 7.688 | – | 1.16 | 1.27 | 0.75 | 0.54 | –0.650.30 [2] | low | [4] |
| GJ 273 | CFHT | 3.8 | 5.714 | – | 1.28 | 1.41 | 1.25 | 0.00 | –0.160.20 [1] | solar | [4] |
| Name | RA & DEC | M subclass | log() | CaH | CaH | K I EW | H EW | Li EWaaThe lithium abundances have not been corrected for possible contamination with the Fe I line at 6707.44 Å. Uncertainties in the setting of continuum levels prior to measurement induce EW errors of about 10–20 mÅ (Zuckerman & Song, 2004) with a strong dependence on the S/N in the region. We therefore conservatively consider our detection limit to be 0.05 Å. | YouthbbYouth index in binary format in the following order: low-g from CaH, low-g from K I, He I emission, Li detection, strong H emission (EW Å). | |
|---|---|---|---|---|---|---|---|---|---|---|
| 0.5 | 2MASS | wide, | narr, | 0.16 Å | 0.21 Å | 0.025 Å | Index | |||
| AU Mic | 20 45 9.5 –31 20 27 | 0.9 | 5.436 | -2.125 | 1.13 | 1.20 | 0.96 | -1.41 | 0.074 | 11010 |
| AT Mic (N) | 20 41 51.1 –32 26 7 | 4.5 | 5.807 | -2.195 | 1.37 | 1.52 | 0.87 | -11.04 | – | 11101 |
| AT Mic (S) | 20 41 51.1 –32 26 10 | 4.9 | 5.807 | -2.195 | 1.38 | 1.55 | 1.08 | -8.13 | – | 11101 |
| HIP 11437 B | 2 27 28.1 +30 58 41 | 2.2 | 8.817 | -1.821 | 1.24 | 1.36 | 0.89 | -3.95 | 0.133 | 11010 |
| BD-13 6424 | 23 32 30.9 –12 15 52 | 0.8 | 7.45 | -2.311 | 1.14 | 1.21 | 0.75 | -1.83 | 0.171 | 11010 |
| GJ 182 | 4 59 34.8 +1 47 2 | 0.5 | 7.117 | -2.450 | 1.12 | 1.18 | 0.74 | -1.23 | 0.296 | 11010 |
| HIP 11437 A | 2 27 28.1 +30 58 41 | -0.2 | 7.87 | -1.821 | 1.04 | 1.07 | 0.53 | -0.16 | 0.271 | 11010 |
| HIP 12545 | 2 41 25.8 +5 59 19 | -0.1 | 7.904 | -2.203 | 1.06 | 1.09 | 0.59 | -0.69 | 0.447 | 11010 |
| Name | SpT | Li EWaaThe lithium abundances have not been corrected for possible contamination with the Fe I line at 6707.44 Å. Uncertainties in the setting of continuum levels prior to measurement induce EW errors of about 10–20 mÅ (Zuckerman & Song, 2004) with a strong dependence on the S/N in the region. We therefore consider our detection limit to be 0.05 Å. | He I EW | H EW | H 10%-width | Accretor?bbAccreting or not, based on criteria discussed in text and devised by Mohanty et al. (2005) and White & Basri (2003). |
|---|---|---|---|---|---|---|
| M– () | 0.025 Å | 0.05 Å | 0.45 Å | 4 km/s | ||
| 2MASS J03350208+2342356 | 8.5 | 0.615 | –2.89 | –10.7 | 273 | yes |
| 2MASS J05575096–1359503 | 7.0 | 0.285 | – | –25.6 | 208 | possible |
| 2MASS J15534211–2049282 (S) | 3.4 | 0.630 | –0.81 | –70.9, –85.8 | 421, 470 | yes |
| 2MASS J22344161+4041387 | 6.0 | 0.825 | – | –52.7,–39.2 | 314, 298 | yes |
| 1RXS J041417.0–090650 | 4.3 | 0.078 | –0.54 | –5.1, –23.2 | 86, 242 | no |
| GJ 3305 | 1.1 | 0.086 | – | –2.1 | 113 | no |
| GJ 9809 | 0.3 | 0.087 | – | –1.3 | 105 | no |
| NLTT 13728 | 6.0 | 0.126 | –0.28 | –19.1 | 89 | no |