Frontiers of the physics of dense plasmas and planetary interiors: experiments, theory, applications
Abstract
Recent developments of dynamic x-ray characterization experiments of dense matter are reviewed, with particular emphasis on conditions relevant to interiors of terrestrial and gas giant planets. These studies include characterization of compressed states of matter in light elements by x-ray scattering and imaging of shocked iron by radiography. Several applications of this work are examined. These include the structure of massive “Super Earth” terrestrial planets around other stars, the 40 known extrasolar gas giants with measured masses and radii, and Jupiter itself, which serves as the benchmark for giant planets.
I I. Introduction
We are now in an era of dramatic improvement in our knowledge of the physics of materials at high density. For light elements, this theoretical and experimental work has many applications, including internal confinement fusion as well as the interiors of gas giant planets. For heavy elements, experiments on silicates and iron at high pressure are helping to better understand the Earth, as well as terrestrial planets as a class of objects. In particular, the discovery of rocky and gaseous planets in other planetary systems has opened our imaginations to planets not found in our own solar system (Charbonneau et al., 2007).
While the fields of experiments of matter at high densities, first principles calculations of equations of state (EOS), planetary science, and astronomy do progress independently of each other, it is important for there to be communication between fields. For instance, in the realm of planets, physicists can learn of key problems that exist in the area of planetary structure, and how advances in our understanding of input physics could shed new light in this area. Astronomers and planetary scientists can learn where breakthroughs in physics of materials under extreme conditions are occurring, and be ready to apply these findings within their fields.
This brief review focuses on work presented at the joint American Physical Society (APS), High Energy Density Laboratory Astrophysics (HEDLA), and High Energy Density Physics (HEDP) meeting in April, 2008. We first discuss some experimental and theoretical work on light elements, including some applications to gas giant planets, which are predominantly composed of hydrogen and helium. We discuss new models of the interior structure of Jupiter and review the observed mass-radius relationship of extrasolar giant planets (EGPs). We then focus on terrestrial planets and investigate new experimental work on iron. We then discuss the predicted structure of “Super Earth” planets, predominantly solid planets made up of iron, rock, and water, from 1-10 Earth masses ().
II II. Light Elements and Giant Planets
II.1 A. Pulsed x-ray probing of light elements
For accurate measurements of densities and temperatures in dense and compressed matter, novel x-ray Thomson scattering techniques(Landen et al., 2001a) have been developed. These experiments employ powerful laser-produced x-ray sources that penetrate through dense and compressed materials with densities of solid and above. Both thermal Ly- and He- radiation from nanosecond laser plasmas(Landen et al., 2001b) or ultra short pulse laser-produced K- inner-shell emission(Kritcher et al., 2007) have been shown to fulfill the stringent requirements on photon numbers and bandwidth for spectrally resolved x-ray scattering measurements in single shot experiments. Experiments have been performed in the non-collective (backscatter) regime, where the scattering spectrum yields the Compton feature(Glenzer et al., 2003). On the other hand, collective scattering on plasmons, i.e., electron density (Langmuir) oscillations, have been observed in forward scatter geometry(Glenzer et al., 2007).
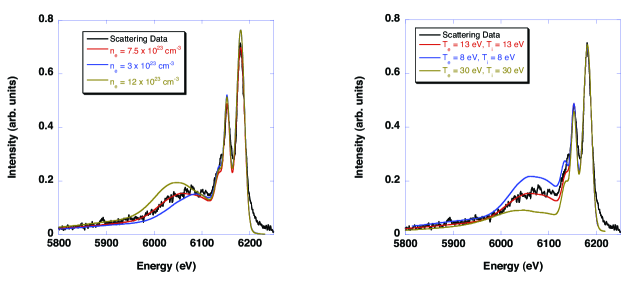
These techniques have recently been applied to shock-compressed beryllium (H. J. Lee et al., in prep). In experiments at the Omega laser facility(Sawada et al., 2007) twelve laser beams (500 J each) directly illuminate the foil with laser intensities of W cm-2 producing pressures in the range of 20-60 Mbar and compressing the foil by a factor of 3. The Compton scattering spectrum of the 6.18 keV Mn He- and 6.15 keV intercombination x-ray probe lines measured at = 90o scattering angle shows a parabolic spectrum downshifted in energy from the incident radiation by the Compton effect; the shift is determined by the Compton energy eV, with , and the energy of the incident x-rays. The Compton scattering spectrum directly reflects the electron distribution function; for a Fermi-degenerate system the width of the Compton spectrum provides the Fermi energy, . Unlike for plasmas with a Maxwell-Boltzmann distribution, the width is sensitive to the electron density. In addition, the intensity ratio of the elastic to inelastic scattering feature from Fermi-degenerate plasmas is sensitive to the ion temperature because elastic scattering is dependent on the ion-ion structure factor.
Figure (1) shows the scattering data along with calculated scattering spectra for which the electron density (left) and the temperature (right) has been varied. For the analysis we assume = and = 2 consistent with calculations and with the measurements from isochorically heated Be. Density and temperature obtained in this way are cm-3 and = 13 eV for representing a Fermi temperature of = 30 eV and scattering parameter = . The error bar for the measurement is of order %, dominated by noise. This error estimate is not affected by uncertainties of because the shape of the Compton scattering profile provides an additional constraints. The parameters inferred from the theoretical fit match radiation hydrodynamic simulations of this experiment to 10% and also agree with the results of forward scattering measurements that have independently measured and from the plasmon spectrum.
The experiments have directly measured the conditions and dynamic structure factors of shocked matter, thus going beyond characterization of shock wave experiments with particle and shock velocities. These novel experiments have only now become possible with the advent of penetrating powerful x-ray probes produced on high-energy density physics facilities. This feature further allows testing of radiation-hydrodynamic calculations with different EOS models for shock-compressed matter. Future experiments will apply Compton scattering to measure the compressibility and adiabat of compressed matter, including hydrogen (Höll, 2007).
II.2 B. Experiment and Theory of H/He
Experiments on deuterium and helium provide vital EOS data to model the interior of giant planets (Fig. 2). Recent work include explosively driven shocks in hydrogen and deuterium (Fortov et al., 2007) that provided experimental evidence of pressure-driven dissociation transition in dense hydrogen that is associated with a rapid increase in conductivity (Weir et al., 1996; Fortov et al., 2007). The results in Fortov et al. (2007) were interpreted as signs of a plasma phase transition of first-order. However, within experimental error bars, an interpretation in terms of a gradual dissociation transition as predicted from first-principles simulations (Militzer et al., 2008) is also possible.
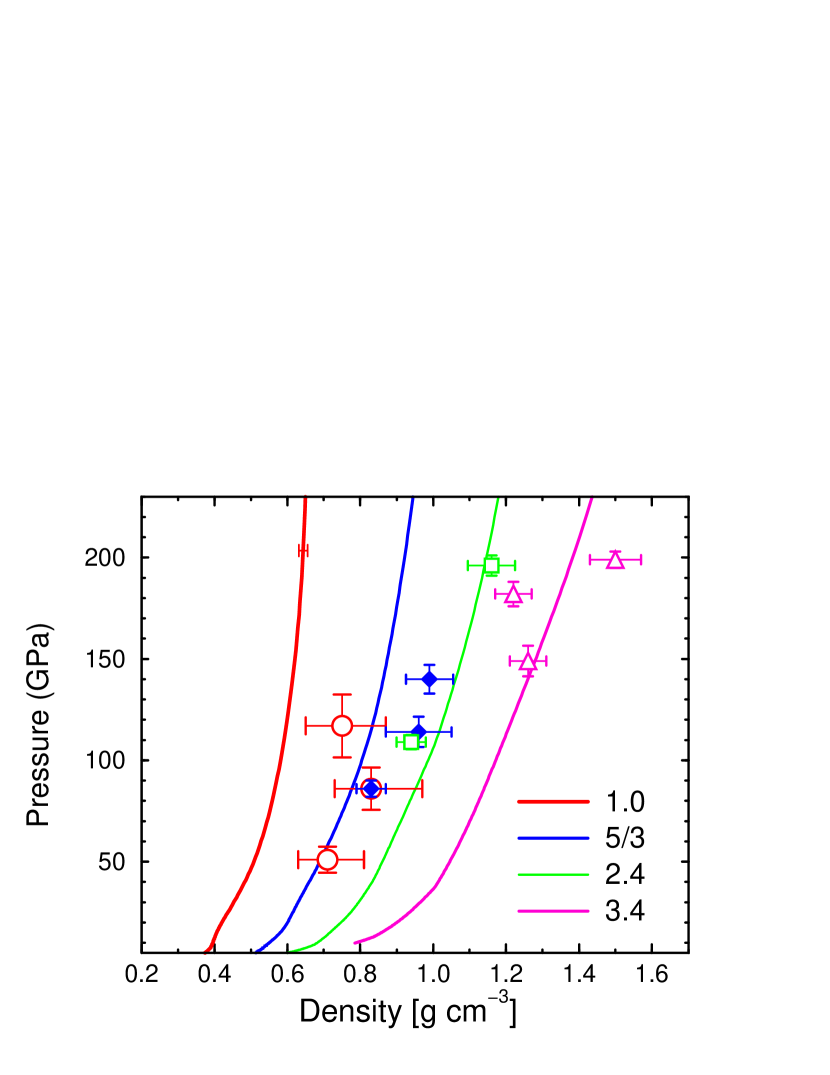
While standard shock wave experiments can reach very high temperatures and megabar pressures, they increase the sample density only 4 to 5 fold Militzer and Hubbard (2007). There is consequently very little data taken directly under the conditions found inside Jupiter and Saturn. In addition to existing isentropic and off-hugoniot shock compression techniques, this issue is addressed with a new experimental method that combines static and dynamic compression techniques. By precompressing the sample statically in a modified diamond anvil cell (Eggert et al., 2008), a higher final shock density is reached, and one can therefore probe deeper in the planetary interiors. In Figure (3) we show a comparison of the Eggert et al. (2008) precompressed data (the hashed region in Fig. 2) to first principles simulations of Militzer (2008). The agreement is particularly good at high compression but deviations are observed for the measurements without precompressions. Further experimental and theoretical work will be needed to resolve this discrepancy.
II.3 C. Jupiter and Extrasolar Giant Planets
An important requirement of theories of planet formation is to account for the present day structure of Jupiter and Saturn, which are relatively well observed. The history of their formation is imprinted primarily in the amount and distribution of heavy elements in their interior. Heavy elements are supplied as solid bodies while the massive H/He envelopes of giant planets accumulate through gas accretion. The relative importance of the two accretion processes during the formation of the planet is closely tied to the formation process and the surrounding environment. As noted by Saumon and Guillot (2004), uncertainties in H/He EOS dominate all uncertainties when trying to understand the interior structure of Jupiter. It is then essential that accurate EOS measurements can be made for light elements under giant planet conditions.
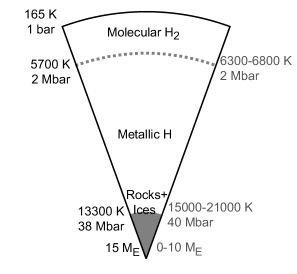
Interestingly, the first two modeling efforts based on first principles EOS computed independently but with essentially the same method give very different results for the amount and distribution of heavy elements in Jupiter (Nettelmann et al., 2007; Militzer et al., 2008). The reasons for this discrepancy are discussed in Militzer and Hubbard (2008) and stem primarily from different assumptions for the interior structure of Jupiter. Nettelmann et al. (2007) assumed a different concentration of heavy elements and helium for the molecular and the metallic regime that could for example be introduced by a first order phase transition in hydrogen. Militzer et al. (2008) found no evidence of such sharp transition in their first-principle simulation and concluded the mantle must be isentropic, fully convective, and of constant composition. Jupiter’s interior structure, as derived by Militzer et al. (2008), is shown in Figure (4). We may be at the threshold where the EOS of H/He mixtures is understood well-enough to force qualitative changes in our picture of the basic structure of Jupiter. The implications for the interior of Saturn and, by extension, for the planet formation process remain to be explored.
New observational data on Jupiter is hard to come by, given that space probes are necessary to measure deep atmospheric abundances and map the gravitational and magnetic fields. In 2011 NASA will launch the JUNO orbiter, which will reach Jupiter in 2016 (Bolton, 2006). This orbiter has several important goals relating to the structure of the planet. The deep abundance of oxygen will be measured, which is potentially Jupiter’s third most abundant element, after H and He. The detailed mapping of Jupiter’s gravity field will give us unparalleled access into the internal structure of the planet (Hubbard, 1999).
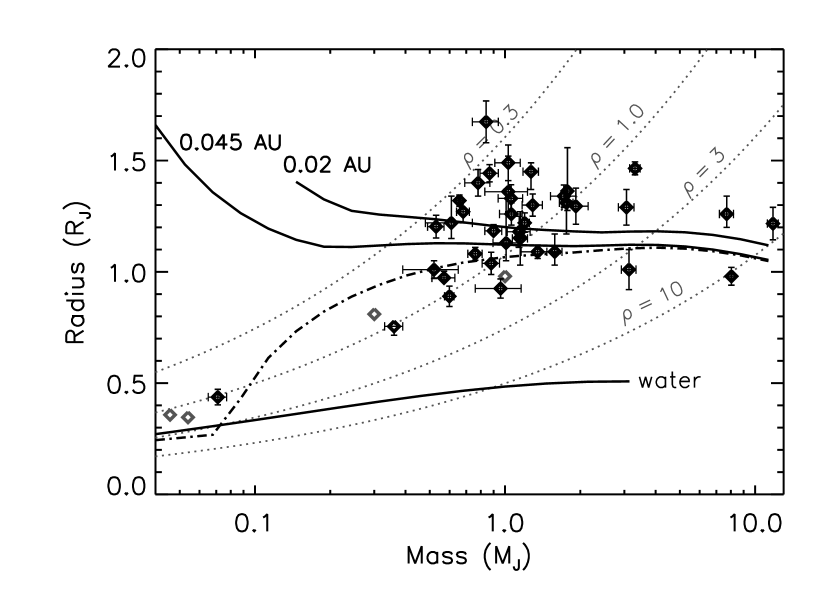
The available data set on transiting EGPs continues to expand. These planets periodically pass in front of their parent stars, allowing for a determination of planetary radii. Planetary masses are determined from the Doppler shift of the parent star’s spectral lines. Forty such planets, most in very close-in orbits, are now known around other stars. The doubling time for the number of detected planets is now less than one year (Charbonneau, 2008). Dedicated space missions such as CoRoT (Bordé et al., 2003; Barge et al., 2008) and Kepler (Basri et al., 2005) will detect dozens to hundreds of additional Neptune-like to Jupiter-like planets, in additional to smaller terrestrial planets, discussed below. In Figure (5) we show the measured masses and radii of known planets, compared to the solar system’s giant planets, and predictions from theoretical models at two different irradiation levels(Fortney et al., 2007).
It is the extreme diversity shown in Figure (5) that is most surprising. Irradiated giant planets were expected to be inflated relative to Jupiter(Guillot et al., 1996), but the range of radii for planets of similar masses does not yet have a satisfactory solution. To explain the relatively smaller radii of some of the Jovian planets, heavy element abundances of 100-200 (0.31-0.62 ) are needed. However, we are ignorant of whether these heavy elements are predominantly mixed into the H/He envelope or within a distinct core. This issue is actually even more complicated, due to several additional factors(Baraffe et al., 2008): (i) the differences between the various equations of state used to characterize the heavy material (water, rock, iron), (ii) the chemical composition of the heavy elements (predominantly water or rock?), and (iii) their thermal contribution to the planet evolution (which is often ignored altogether). Deriving heavy element abundances based on a given planet’s mass and radius will be uncertain, given these issues. As we discuss in §III, similar issues are also important for massive terrestrial planets.
To explain the large radii of many of the planets, either an additional internal energy source must be invoked,(Bodenheimer et al., 2001; Guillot and Showman, 2002) or that the cooling and contraction of these planets has been stalled.(Burrows et al., 2007; Chabrier and Baraffe, 2007) The only clear trend to date is that planets around metal-rich parent stars tend to possess larger amounts of heavy elements.(Guillot et al., 2006)
III III. Heavy Elements and Terrestrial Planets
III.1 A. Experiments on Iron
With current technology, diamond cell experiments (static), do not allow one to obtain meaningful data at temperatures of several thousands of K once the pressure exceeds 200 GPa. Although measurements can be achieved with good precision below 200 Gpa (Boehler, 1993), the melting curve of iron or iron alloys at the inner core boundary (330 GPa, about 5000 K) is thus beyond the capabilities of these experiments. On the other hand, dynamic experiments can easily reach inner core pressures but the corresponding temperatures, which are large and are fixed by the Hugoniot curve, do not allow one to explore the relevant P-T space. As a result, the iron phase diagram at conditions corresponding to the Earth’s inner core has never been directly measured and large uncertainties remain regarding its equation of state (EOS). These unknowns severely limit current Earth modelling as the iron EOS is of utmost importance to constrain the chemical composition and energy balance of the Earth’s core. The discovery of low-mass planets outside the solar system renders the exploration of iron at GPa (5 Mbar) pressures and 1 eV temperatures even more pertinent.
The French National Research Agency (ANR) recently funded a several-year program focused on the development of new diagnostics to study the physical properties of iron, the development of methods to explore broader regions of the EOS diagram, and the combined use of experimental and theoretical methods to characterize the high pressure phases of this element.
The first part of this project is to develop adequate x-ray sources both to radiograph and/or perform diffraction measurements on shock compressed iron. Results at lower energies have already been obtained for aluminum (Ravasio et al., 2008). To this aim, experiments were performed on the 100 TW laser system at LULI, France, which delivers 20 J in 0.3-10 ps at a wavelength of 1057 nm and 6J when frequency-doubled. The latter was used to look at the effects of preformed plasma due to the laser ‘pedestal’ which is 500 ps wide with a contrast of . Different target materials and geometries, as well as the effects of laser parameters and filtering/shielding of the detector were studied. At very high laser intensities, x-rays are generated by energetic electrons produced by the laser-plasma interaction which penetrates the target and produces K- radiation. The x-ray emission stops a few ps after the end of the laser pulse, as the electrons lose their energy due to classical charged-particle stopping processes. For laser pulses of 10 ps, a temporal resolution of less than 20 ps can then be achieved. This duration is short enough to resolve shockwaves for density measurements in EOS studies, as the shock velocities are of the order of a few tens m ns-1.
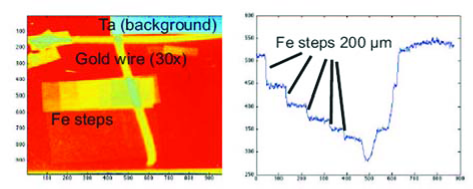
The backlighter target was made of W, (producing K energy of 60 keV). To produce a small source size, required for high 2D spatial resolution, we used thin (18 m diameter) W wires (Park et al., 2006). The spatial resolution of the x-ray source was measured using a crossed pair of 100 m diameter gold wires. The latter was used for these high energy x-rays, as the absorption of a standard gold grid was too low (5%). The magnification of this point-projection system was 30, with a source-detector (imaging plate filtered with Tm) distance of 30 cm; an additional 2.5 cm plastic layer was used to stop energetic charged particles emerging from the target. To characterize the spectral distribution of the x-rays, a transmission crystal spectrometer (DCS) (Seely et al., 2006), was implemented in order to measure the contribution of high-energy x-ray background to the radiograph image. The experiment reliably delivered high quality radiographs of static targets with best results obtained at intensities of W cm-2. Figure (6) shows a radiograph at 60 keV of a test target (100 m thick gold wire at 30 magnification) obtained from a 18 m diameter W-wire target. Analyzing the absorption profile of the wire on the detectors shows a spatial resolution of better than 20 m. The contrast on iron steps (right part of Figure 6) shows the resolved density gradients that allows for the deduction of the density of shocked iron with error bars lower than 10 %.
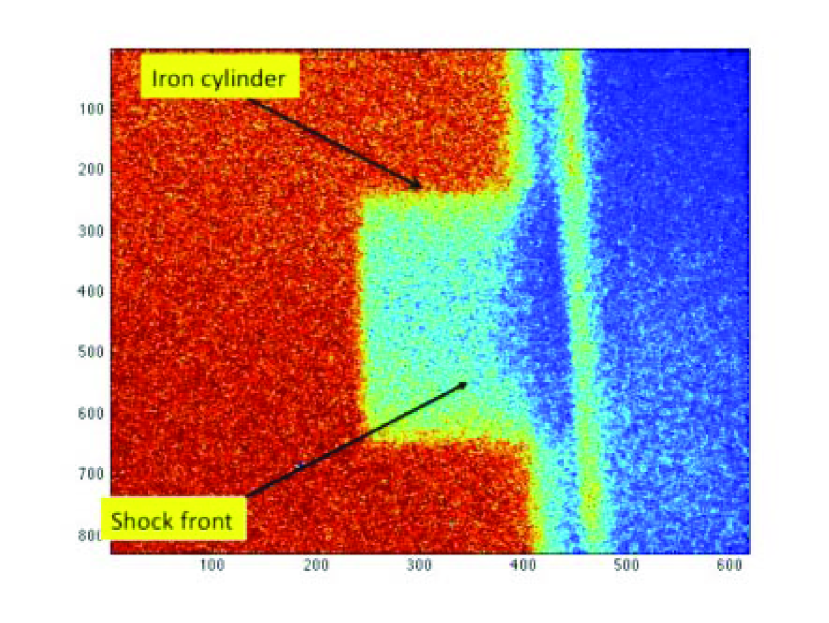
This technique has then been applied to radiograph a shock-compressed target made of a ablator pusher and a 500 m diameter iron disk, 250 m thick. For this experiment, besides the short pulse beam, a high energy long pulse beam was needed to drive a uniform planar shock. Therefore we used the new LULI2000 facility which has this capability and obtained the first radiograph of a laser shock compressed iron target (Figure 7). Due to a lower contrast on the LULI2000 facility than the 100 TW, the signal/noise ratio is not optimum but the shock front is clearly observable. Detailed analysis is still underway.
III.2 B. Application: Super Earths—Massive Terrestrial Planets
Super-Earths are the newest class of discovered extra-solar planets. These 1-10 earth-mass () planets are likely to consist of solids and liquids rather than of gases. With their relatively large masses, they experience very large internal pressures. Pressure constrains the power law relationship between mass () and radius () of solid planets. The value for the exponent in is as constrained by the different internal structure models for super-Earths, while it is for planets between 5-50% the mass of Earth (Valencia et al., 2006, 2007). is the radius of a planet with reference mass , usually Earth’s, that may be rocky or have large amounts of H2O with a correspondingly larger . The central pressure of rocky super-Earths (up to 60 Mbar) scales proportionately with mass, reaching values that challenge the understanding of rock behavior under such extreme conditions. Despite the different treatments in the models (Fortney et al., 2007; Seager et al., 2007; Sotin et al., 2007) and intrinsic uncertainties in the equation of state (EOS), composition and temperature structure, the mass-radius relationship is robust, and thus, useful for inferring the expected signal in searches for transiting super Earths.
However, information on the structure, such as the size and state of the core, crucially depends on the exact behavior of super-Earth materials (silicates, iron, iron alloy and ices) at high pressures and temperatures. In order to accurately describe the physical properties of super-Earths, such as their ability to have a magnetic field by having a molten core, or to extract information to constrain formation models such as from the existence of a metallic core, we need a very detailed description of super-Earths’ interior, that can not be done without improvements in the EOS of silicates, iron alloys and ices.
A few questions that, if addressed, will considerably improve the internal structure models and thus, our interpretation of the data are: (1) What is the stability field of post-perovksite and are there other higher pressure silicate phases? Our lack of knowledge of other existing phases means that the radius in models is an upper value. (2) At the pressure range of super-Earths (up to 60 Mbars), which existing EOS is more accurate? A few high pressure experiments can illuminate the extrapolation qualities and deficiencies of the different EOS used by the models (Vinet, Birch-Murnaghan, ANEOS, Thomas-Fermi-Dirac, etc). However significant process has been made with first-principles computer simulation (Umemoto et al., 2006). How much iron can post-perovskite accommodate? If this high-pressure silicate phase accommodates a large amount of iron (as suggested by Mao et al (Mao et al., 2004)), it could affect the size of the core and to a smaller extent the total radius of the planet. (4) What are the thermodynamic properties of all mantle materials, especially the Gruneisen parameter? Post-perovskite has a more sensitive Gruneisen parameter to volume than perovskite, such that the temperature profile of a mantle made mostly of post-perovskite would be cooler than that of perovskite.
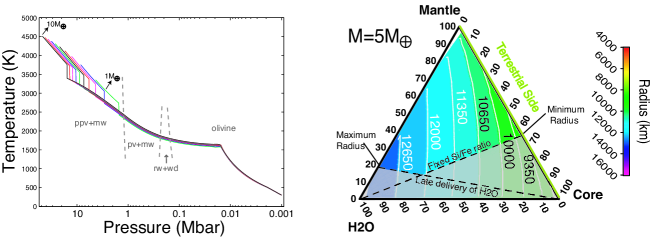
In addition, to infer planetary composition from the and data that will be available in the next few years, we need accurate EOSs. Even without errors in the data and structure models, a large number of compositions can fit the same average density (see Figure 8b). The uncertainty in radius from EOS is 2-3%, which will be comparable to the precision that powerful space telescopes will yield in follow-up observations (i.e. the James Webb Space Telescope, JWST). By reducing the uncertainty in the EOS we make the structure models more accurate and useful. Thus, there is a need for accurate equations of state of solid planetary materials to pressures up to 60 Mbar, the central pressure of the densest and largest (10-) super-Earth.
IV IV. Conclusions
New experiments are now probing states of dense matter that were previously beyond our grasp. In particular x-ray techniques are allowing us a view into materials that previously had been hidden. At the same time first principles techniques are allowing accurate determination of EOSs for planetary interest. Off-Hugoniot experiments of H and He will test these EOS and lead to more accurate models for Jupiter and Saturn. In addition, new planets are being discovered at an accelerating rate, which will continue to expand the limits of P-T space that are of “planetary” interest. Our current era is one of dramatic improving knowledge of, and exciting applications of, the physics of materials at high density.
The authors would like to thank their numerous collaborators on these projects. Please see the references in the text for a fuller account of the science described in this paper. This work performed under the auspices of the U.S. Department of Energy by Lawrence Livermore National Laboratory under Contract DE-AC52-07NA27344 and at the Los Alamos National Laboratory under Contract DE-AC52-06NA25396. This work is also supported by LDRDs 08-ERI-002, 08-LW-004, and the National Laboratory User Facility program. JJF and BM acknowledge support from NASA and NSF.
References
- Charbonneau et al. (2007) D. Charbonneau, T. M. Brown, A. Burrows, and G. Laughlin, in Protostars and Planets V, edited by B. Reipurth, D. Jewitt, and K. Keil (2007), University of Arizona Press, Tucson, pp. 701–716.
- Landen et al. (2001a) O. L. Landen, S. H. Glenzer, M. J. Edwards, R. W. Lee, G. W. Collins, R. C. Cauble, W. W. Hsing, and B. A. Hammel, Journal of Quantitative Spectroscopy and Radiative Transfer 71, 465 (2001a).
- Landen et al. (2001b) O. L. Landen, D. R. Farley, S. G. Glendinning, L. M. Logory, P. M. Bell, J. A. Koch, F. D. Lee, D. K. Bradley, D. H. Kalantar, C. A. Back, et al., Review of Scientific Instruments 72, 627 (2001b).
- Kritcher et al. (2007) A. L. Kritcher, P. Neumayer, and M. K. Urry, High Energy Density Physics 3, 156 (2007).
- Glenzer et al. (2003) S. H. Glenzer, G. Gregori, R. W. Lee, F. J. Rogers, S. W. Pollaine, and O. L. Landen, Physical Review Letters 90, 175002 (2003).
- Glenzer et al. (2007) S. H. Glenzer, O. L. Landen, P. Neumayer, R. W. Lee, K. Widmann, S. W. Pollaine, R. J. Wallace, G. Gregori, A. Höll, T. Bornath, et al., Physical Review Letters 98, 065002 (2007).
- Sawada et al. (2007) H. Sawada, S. P. Regan, D. D. Meyerhofer, I. V. Igumenshchev, V. N. Goncharov, T. R. Boehly, R. Epstein, T. C. Sangster, V. A. Smalyuk, B. Yaakobi, et al., Physics of Plasmas 14, 122703 (2007).
- Höll (2007) A. e. Höll, High Energy Density Physics 3, 120 (2007).
- Fortov et al. (2007) V. E. Fortov, R. I. Ilkaev, V. A. Arinin, V. V. Burtzev, V. A. Golubev, I. L. Iosilevskiy, V. V. Khrustalev, A. L. Mikhailov, M. A. Mochalov, V. Y. Ternovoi, et al., Physical Review Letters 99, 185001 (2007).
- Weir et al. (1996) S. T. Weir, A. C. Mitchell, and W. J. Nellis, Physical Review Letters 76, 1860 (1996).
- Militzer et al. (2008) B. Militzer, W. B. Hubbard, J. Vorberger, I. Tamblyn, and S. A. Bonev, Astrophys. J. 688, L45 (2008).
- Militzer and Hubbard (2007) B. Militzer and W. B. Hubbard, in Shock Compression of Condensed Matter, edited by M. Elert, M. D. Furnish, R. Chau, N. Holmes, and J. Nguyen (2007), vol. 955 of American Institute of Physics Conference Series, pp. 1395–1398.
- Eggert et al. (2008) J. Eggert, S. Brygoo, P. Loubeyre, R. S. McWilliams, P. M. Celliers, D. G. Hicks, T. R. Boehly, R. Jeanloz, and G. W. Collins, Physical Review Letters 100, 124503 (2008).
- Militzer (2008) B. Militzer, “Path Integral Monte Carlo and Density Functional Molecular Dynamics Simulations of Hot, Dense Helium,” astro-ph/0805.0317 (2008), eprint Phys Rev B, submitted.
- Saumon and Guillot (2004) D. Saumon and T. Guillot, Astrophys. J. 609, 1170 (2004).
- Nettelmann et al. (2007) N. Nettelmann, B. Holst, A. Kietzmann, M. French, R. Redmer, and D. Blaschke, Astrophys. J. 683, 1217 (2008).
- Militzer and Hubbard (2008) B. Militzer and W. B. Hubbard, “Comparison of Jupiter Interior Models Derived from First-Principles Simulations,” HEDLA 8, submitted (2008), eprint astro-ph/0807.4266.
- Bolton (2006) S. Bolton, in 36th COSPAR Scientific Assembly (2006), vol. 36 of COSPAR, Plenary Meeting, pp. 3775.
- Hubbard (1999) W. B. Hubbard, Icarus 137, 357 (1999).
- Charbonneau (2008) D. Charbonneau, “The Rise of the Vulcans,” Submitted to IAU Symposium 253, “Transiting Planets” (2008), eprint astro-ph/0808.3007
- Bordé et al. (2003) P. Bordé, D. Rouan, and A. Léger, Astron. Astrophys. 405, 1137 (2003).
- Barge et al. (2008) P. Barge, A. Baglin, M. Auvergne, H. Rauer, A. Léger, J. Schneider, F. Pont, S. Aigrain, J.-M. Almenara, R. Alonso, et al., Astron. Astrophys. 482, L17 (2008).
- Basri et al. (2005) G. Basri, W. J. Borucki, and D. Koch, New Astronomy Review 49, 478 (2005).
- Fortney et al. (2007) J. J. Fortney, M. S. Marley, and J. W. Barnes, Astrophys. J. 659, 1661 (2007).
- Guillot et al. (1996) T. Guillot, A. Burrows, W. B. Hubbard, J. I. Lunine, and D. Saumon, ApJ 459, L35 (1996).
- Baraffe et al. (2008) I. Baraffe, G. Chabrier, and T. Barman, Astron. Astrophys. 482, 315 (2008).
- Bodenheimer et al. (2001) P. Bodenheimer, D. N. C. Lin, and R. A. Mardling, Astrophys. J. 548, 466 (2001).
- Guillot and Showman (2002) T. Guillot and A. P. Showman, Astron. Astrophys. 385, 156 (2002).
- Burrows et al. (2007) A. Burrows, I. Hubeny, J. Budaj, and W. B. Hubbard, Astrophys. J. 661, 502 (2007).
- Chabrier and Baraffe (2007) G. Chabrier and I. Baraffe, ApJ 661, L81 (2007).
- Guillot et al. (2006) T. Guillot, N. C. Santos, F. Pont, N. Iro, C. Melo, and I. Ribas, Astron. Astrophys. 453, L21 (2006).
- Boehler (1993) R. Boehler, Nature (London) 363, 534 (1993).
- Ravasio et al. (2008) A. Ravasio, M. Koenig, S. Le Pape, A. Benuzzi-Mounaix, H. S. Park, C. Cecchetti, P. Patel, A. Schiavi, N. Ozaki, A. MacKinnon, et al., Physics of Plasmas 15, 060701 (2008).
- Park et al. (2006) H.-S. Park, D. M. Chambers, H.-K. Chung, R. J. Clarke, R. Eagleton, E. Giraldez, T. Goldsack, R. Heathcote, N. Izumi, M. H. Key, et al., Physics of Plasmas 13, 056309 (2006).
- Seely et al. (2006) J. F. Seely, C. A. Back, C. Constantin, R. W. Lee, H.-K. Chung, L. T. Hudson, C. I. Szabo, A. Henins, G. E. Holland, R. Atkin, et al., Journal of Quantitative Spectroscopy and Radiative Transfer 99, 572 (2006).
- Valencia et al. (2006) D. Valencia, R. J. O’Connell, and D. Sasselov, Icarus 181, 545 (2006).
- Valencia et al. (2007) D. Valencia, D. D. Sasselov, and R. J. O’Connell, Astrophys. J. 665, 1413 (2007).
- Seager et al. (2007) S. Seager, M. Kuchner, C. A. Hier-Majumder, and B. Militzer, Astrophys. J. 669, 1279 (2007).
- Sotin et al. (2007) C. Sotin, O. Grasset, and A. Mocquet, Icarus 191, 337 (2007).
- Umemoto et al. (2006) K. Umemoto, R. M. Wentzcovitch, and P. B. Allen, Science 311, 983 (2006).
- Mao et al. (2004) W. L. Mao, G. Shen, V. B. Prakapenka, Y. Meng, A. J. Campbell, D. L. Heinz, J. Shu, R. J. Hemley, and H.-K. Mao, Proceedings of the National Academy of Science 101, 15867 (2004).
- Nellis et al. (1984) W. J. Nellis, N. C. Holmes, A. C. Mitchell, G. K. Governo, M. Ross, D. A. Young, and R. J. Trainor, Physical Review Letters 53, 1248 (1984).
- Guillot (2005) T. Guillot, Annual Review of Earth and Planetary Sciences 33, 493 (2005).