An X-ray/optical study of the complex dynamics of the core of the massive intermediate-redshift cluster MACSJ0717.5+3745
Abstract
Using CHANDRA, we investigate the spatial temperature distribution of the intracluster medium (ICM) within 700 kpc of the center of the massive merging cluster MACSJ0717.5+3745 at . Combining the X-ray evidence with information about the distribution and velocities of the cluster galaxies near the core provides us with a snapshot of the three-dimensional geometry and dynamics of one of the most complex cluster studied to date. We find MACSJ0717.5+3745 to be an active triple merger with ICM temperatures exceeding 20 keV. Although radial velocity information and X-ray/optical offsets indicate that all three mergers proceed along distinctly different directions, the partial alignment of the merger axes points to a common origin in the large-scale filament south-east of the cluster core. Clear decrements in the ICM temperature observed near two of these subclusters identify the respective X-ray surface brightness peaks as remnants of cool cores; the compactness and low temperature of 5.7 keV of one of these features suggest that the respective merger, a high-velocity collision at 3,000 km s-1, is still in its very early stages. Looking beyond the triple merger, we find the large-scale filament to not only provide a spatial as well as temporal arrow for the interpretation of the dynamics of the merger events near the cluster core; we also find tantalizing, if circumstantial, evidence for direct, large-scale heating of the ICM by contiguous infall of low-density gas from the filament.
Subject headings:
galaxies: clusters: individual (MACSJ0717.5+3745); X-rays: galaxies: clusters1. Introduction
Major cluster mergers are the most energetic events in the universe, and one of the most important phenomena for the formation of large-scale structure in the hierarchical scenario. The enormous energy released in cluster mergers accelerates particles to relativistic energies and can, in the most massive systems, heat the intracluster medium (ICM) to temperatures exceeding 20 keV (see review by Sarazin, 2002). In an astrophysical context, dynamically simple two-component mergers like 1ES0657–56 have been instrumental in obtaining the currently best constraint on the self-interaction cross section of dark matter (Markevitch et al., 2004; Randall et al., 2008)111see also Mahdavi et al. (2007); Bradač et al. (2008) for results obtained for A 520 and MACSJ0025.4–1222.. Few mergers, however, are as straightforward to interpret as 1ES0657–56 which consists of only two well separated components, and whose merger axis is almost perpendicular to our line of sight. While the majority of massive mergers are thus among the most challenging systems for studies of the dynamics and interactions of gas, galaxies, and dark matter, they also offer the greatest opportunity to study with good statistics the full complexity of cluster mergers.
A prime example of a complex, major cluster merger is MACSJ0717.5+3745 (). Discovered during the Massive Cluster Survey (MACS Ebeling et al., 2001, 2007), the system is one of the most X-ray luminous and best-studied massive clusters at intermediate redshifts. The wealth of data accumulated for it from X-ray to mm wavelengths make MACSJ0717.5+3745 a promising target for a comprehensive study of the full range of physical mechanisms at work during the assembly of massive clusters. At radio frequencies, synchroton emission from relativistic electrons in MACSJ0717.5+3745 was detected in the form of both a radio halo and a very extended, steep-spectrum radio relic (Edge et al., 2003). The same relativistic electrons are expected to also produce hard X-ray photons via inverse Compton scattering of Cosmic Microwave Background photons, as reported by Petrosian et al. (2006). The spatial distribution of the galaxy population in and around MACSJ0717.5+3745 was studied by Ebeling et al. (2004) who found the cluster to be connected to an extended linear filamentary structure, consistent with the picture seen in numerical simulations (and observationally supported by the findings of Kartaltepe et al., 2008) that the most massive halos are more likely to be surrounded by pronounced large-scale structure (e.g. Colberg et al., 2000, 1999). Finally, a spectroscopic analysis by Ma et al. (2008) found strong evidence for star formation in many galaxies in and around this cluster, likely caused by the ongoing growth of this complex system. In this letter, we study variations in the temperature of the ICM of MACSJ0717.5+3745 and their correlation with features in the spatial and radial-velocity distribution of the cluster galaxy distribution, in order to assess the dynamical state and history of the cluster core.
2. X-ray data
MACSJ0717.5+3745 was observed with the Chandra Advanced CCD Imaging Spectrometer Imaging array (ACIS-I; Garmire et al., 2003) in January 2003 for a total exposure time of 60 ks in VFaint mode (ObsID 4200). We applied standard Chandra data reduction procedures222 to reprocess the event file using CIAO 3.3.0.1 and CALDB 3.2.1. Our spectroscopic analysis made use of a “blank-sky” background file333see http://cxc.harvard.edu/contrib/maxim/acisbg/COOKBOOK to remove low-level soft X-ray emission covering a majority of the ACIS-I array.
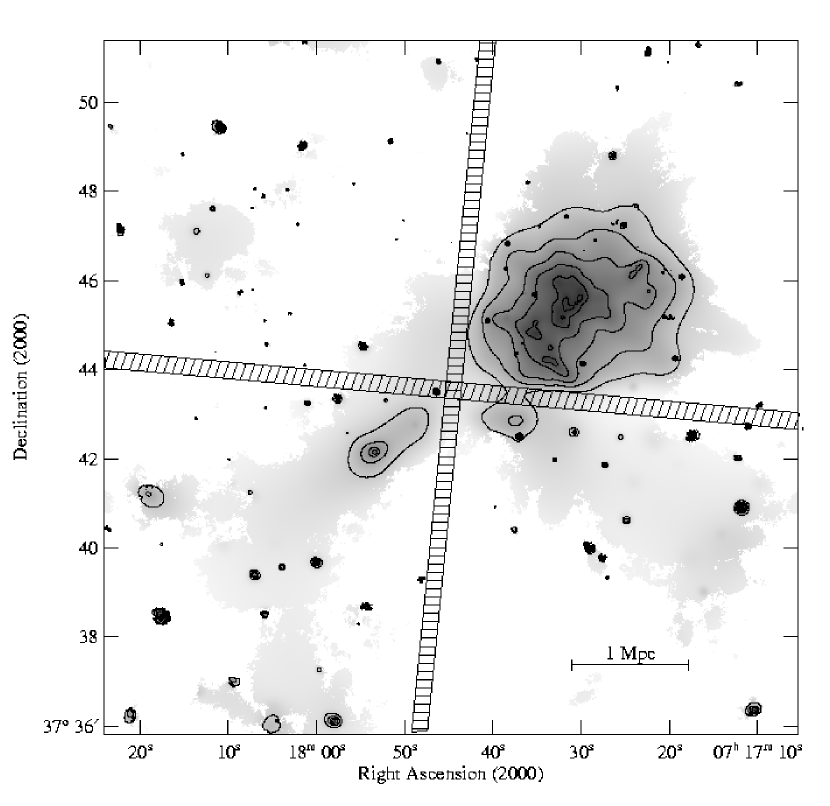
An adaptively smoothed representation of the data within the full field of view of ACIS-I is shown in Fig. 1. The disturbed X-ray morphology around the core of the cluster, which contains at least four X-ray surface-brightness peaks, is immediately obvious in the upper right corner. In addition, weak but detectable X-ray emission extends to the south-eastern corner of Fig. 1, matching the large-scale filament discovered in the galaxy distribution by Ebeling et al. (2004).444This includes the satellite cluster 2 Mpc south-east of the main system; we measure its ICM temperature to be keV.
3. Optical data
MACSJ0717.5+3745 was observed with the Advanced Camera for Surveys (ACS) aboard the Hubble Space Telescope (HST) in the F555W and F814W passbands on April 2, 2004 for an effective exposure time of 4470 and 4560s, respectively, as part of a comprehensive HST survey of the most distant MACS clusters (GO-09722). Groundbased observations of the galaxy population of the cluster were conducted with Keck-II/DEIMOS from 2004 to 2008 with the aim of probing large-scale cluster dynamics and examining the effect of environment on galaxy evolution (Ma et al. 2008).
4. X-ray temperature map
As is apparent from its complex X-ray morphology, MACSJ0717.5+3745 is far from virialized, and the gas temperature can be expected to vary significantly in its core555A summary of the global properties of the hot gas in MACSJ0717.5+3745 is given by Ma et al. (2008).. In order to derive a spatial temperature map, we need to define suitable regions for X-ray spectroscopy666We perform all spectral fitting with Sherpa using a MEKAL plasma model (Mewe et al., 1985), with the absorption term fixed at the Galactic value of nH , the redshift of the cluster set to z (Ma et al., 2008), and abundance Z .. Ideally, these regions should follow the temperature structure. The latter, however, is a priori unknown, and the limited photon statistics of our data do not allow us to extract spectra in arbitrarily small bins. We address this problem by adopting a two-level binning method. As a first step, we subdivide the image into regions whose shape is guided by the X-ray surface-brightness distribution, and each of which contains enough photons to allow a crude temperature measurement. We then merge adjacent regions with similar temperature in order to obtain a clearer view of temperature variations on larger scales. This procedure ensures that the final regions represent the temperature structure fairly, and also that the resulting measurements are statistically robust.
4.1. Low-fidelity temperature map
The initial regions for this process are determined by running the ”accumulative binning” algorithm contbin (Sanders, 2006) on the exposure-weighted image777In contbin the image was smoothed to a signal-to-noise ratio (SNR) of 10, and we set the ”constraint parameter” (Sanders, 2006) to 1.5 to prevent the bins from becoming too elongated. The SNR required of the resulting regions was 20, which corresponds to 400 net counts in regions with negligible background.. We chose contbin because the algorithm’s choice of bins is physically motivated, in as much as contbin attempts to follow the X-ray surface brightness, which is related to the ICM temperature and density. If the initial regions are sufficiently small, their choice will, by the end of the merging process, not affect the final temperature map.
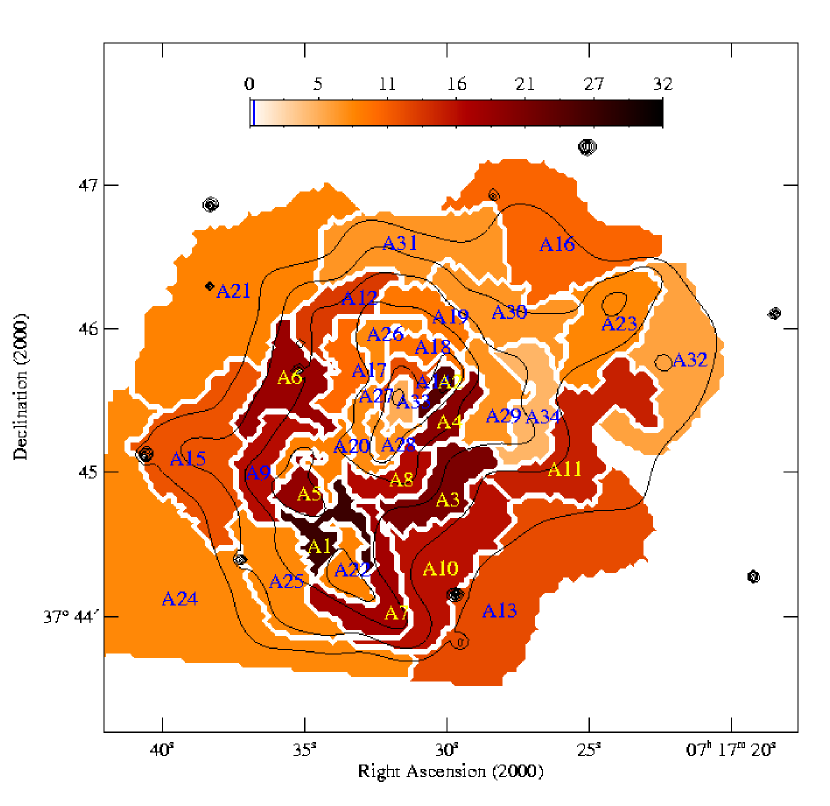
The results of this first-level binning step are shown in the top two panels of Fig. 2. As expected, the relatively low SNR chosen leads to large errors in the measured temperatures and to low values of . Although the best-fit temperatures for some regions, mostly the hottest ones, are poorly constrained, we already see clear variations and trends of the ICM temperature within our study region.


| Region | kT**The quoted errors denote uncertainty. | Binning Table | |
|---|---|---|---|
| (keV) | |||
| B1 | 0.78 | A1, A5, A7 | |
| B2 | 0.57 | A2, A3, A4, A8 | |
| B3 | 0.56 | A6, A9, A15 | |
| B4 | 0.69 | A10, A11, A13 | |
| B5 | 0.71 | A20, A27, A28 | |
| B6 | 0.73 | A12, A17, A19 | |
| B7 | 0.71 | A14, A18, A26 | |
| B8 | 0.84 | A16, A23, A32 | |
| B9 | 0.70 | A22 | |
| B10 | 0.69 | A21, A24, A25 | |
| B11 | 0.73 | A29, A30, A31, A34 | |
| B12 | 0.93 | A33 |
4.2. Re-binning
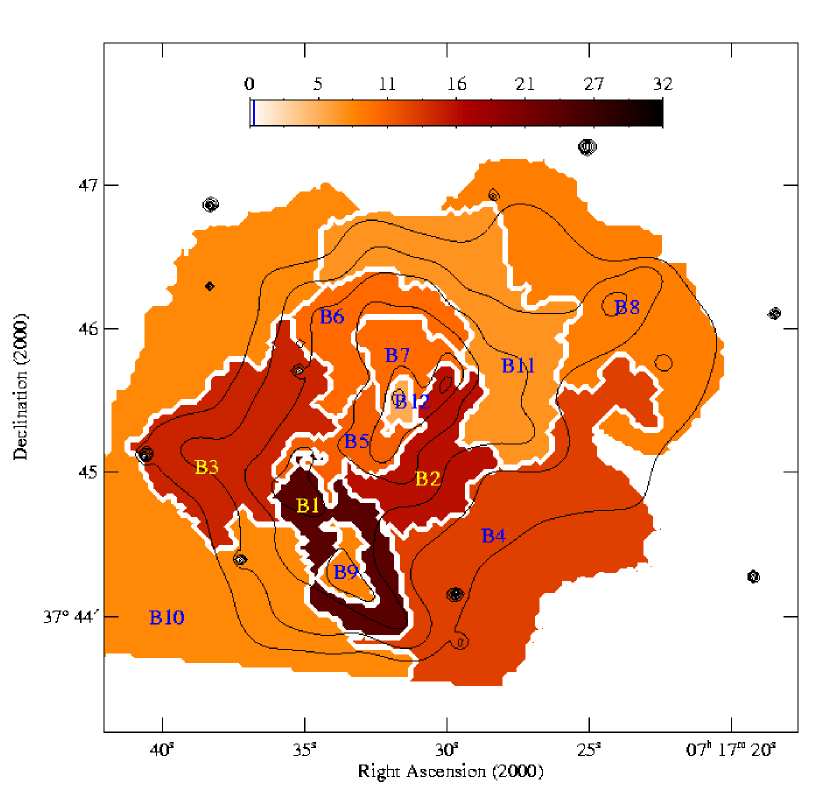
As a second step, we examined the temperature map from Stage 1 and combined adjacent regions with similar temperature in order to obtain a clearer view of temperature variations on larger scales, the goal being to reach at least 1200 net counts per bin by combining three (occasionally four) of the initial regions. The results of this rebinning process are shown in the bottom two panels of Fig. 2; the individual regions and their temperatures are listed in Table 1.
Note that two of the initial regions were excluded from the rebinning and left unchanged, namely the ones coinciding with the main peaks in the X-ray surface brightness distribution, A22 (B9) and A33 (B12). Both of these exhibit markedly cooler temperatures than their surroundings, making them likely candidates for cool cores of clusters still in the process of merging with the main system. This interpretation is particularly plausible for the region around the global peak in the X-ray emission from MACSJ0717.5+3745, A33 (B12), which is found to contain the coolest gas anywhere within our study region (k keV). By comparison, the temperature measured for the second putative cool core, region A22 (B9), is much higher and less well constrained (k keV), but still in stark contrast to the much higher temperatures above 15 keV measured in its immediate vicinity (regions A1, A5, and A7). With all of these regions being viewed in projection, the true temperature difference is likely to be yet higher. Better constraints from a two-phase plasma model, especially relevant for region B9, would require significantly better photon statistics.
Although the selection of regions to merge is to some degree subjective, we convinced ourselves that our final results and conclusions are robust. For instance, our perhaps most debatable choice, the exclusion of the aforementioned cool core A22 (B9) from the merging of the surrounding regions A1, A5, and A7 (B1), predictably increases the temperature measured for B1 (k keV); including it, however, still leads to a statistically consistent result of k keV (Fig. 2).
5. Cluster galaxy distribution and dynamics
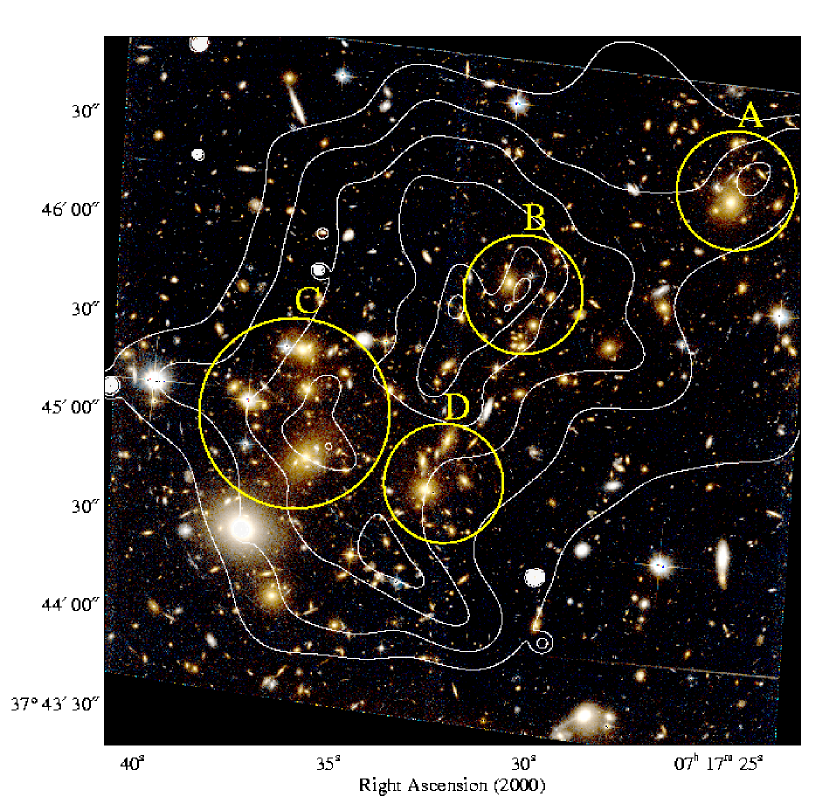
Our tentative interpretation of the physical origins of the complex temperature and gas density distribution presented in the previous section can be tested and extended by studying the distribution and dynamics of the cluster galaxies in the same region. Shown in Fig. 3 is an overlay of the X-ray contours from Fig. 2 onto the HST image of the cluster core. We identify four major concentrations in the integrated optical light, which is dominated by the large cluster ellipticals. Average redshifts and velocity dispersions for galaxies within the four circles marked in Fig. 3 are listed in Table 2. Unlike their counterparts in regions A, C, and D, the galaxies associated with feature B are found to move through the cluster core at a very high relative radial velocity of over 3,000 km s-1, close to the maximal velocity expected from infall from infinity. No significant differences are found between the velocity dispersions measured for the four regions, although the results suggest that the structure in region C is the most massive one.
6. Interpretation
A comparison of the gas and galaxy distribution shown in Fig. 3 as well as of the radial velocity information summarized in Table 2 yields important insights into the dynamics of the multiple components of the cluster core. Specifically, we note that, of the four galaxy concentrations discussed in Section 5, only A and C are reasonably well aligned with peaks in the X-ray surface brightness. The good X-ray/optical alignment of component C, combined with a systemic velocity and velocity dispersion consistent with those of MACSJ0717.5+3745 as a whole, makes this subsystem a likely candidate for the actual, if disturbed, core of the main cluster.
The dominant galaxies in regions B and D, on the other hand, are offset by about 25 arcsec (160 kpc at the cluster redshift) from the respective X-ray peak – in both cases in a direction that points toward the filament to the SE of the main cluster. Offsets of this kind between gas and galaxies (and dark matter) have been observed before in merging clusters, examples being the Bullet Cluster 1ES0657–56 (Markevitch et al., 2004) and MACSJ0025.4–1222 (Bradač et al., 2008), and are readily explained by the difference in the self-interaction cross sections of the various cluster constituents. The X-ray temperature maps of Fig. 2 show the gas near regions B and D being cool compared to their surroundings (B9 and B12); we can thus safely identify them as the cool cores of clusters merging with the main body of MACSJ0717.5+3745 and falling behind as their respective galaxy populations advance. While the merger axis of system D is consistent with lying in the plane of the sky (and aligned with the large-scale filament prominently visible on the left of Fig. 1), the combination of the observed X-ray/optical offset with a very high radial velocity indicates that system B is moving through the cluster core along an axis that is much more inclined toward our line of sight. We note also that the high-velocity collision of component B most likely happened only recently, given that its cool core (region B12 in Fig. 2) appears to be still largely intact.
A similar argument can be made to explain the observational evidence in region A. The X-ray/optical offset suggests infall from the NW, i.e. in the direction of the filament. The trailing peak in the gas density is highly elongated though, and no cool gas is detected in the area, all of which suggests that we are witnessing back-infall of a cluster that originated from the filament and has already passed through the main cluster once.
While the combined X-ray/optical evidence allows a straightforward and self-consistent interpretation of the dynamics and three-dimensional geometry of the three seperate ongoing merger events described above, the gas distribution and temperature structure near the cluster-filament interface – the south-eastern corner of Figs. 2 and 3 – defies simple explanation. Although the extremely high temperatures measured in regions B1 and B2 could to some extent be caused by shock heating from the ongoing mergers of components B and D, this explanation appears implausible for the entirety of the hot interface region extending from B3 to B4. The sheer size of this feature (about 1 Mpc), its alignment perpendicular to the cluster-filament axis, and the simultaneous increase in gas temperature and X-ray surface brightness all point to a direct large-scale interaction between the filament and the cluster core. We therefore speculate that the prominent jump in gas density and temperature along the cluster-filament interface is the result of contiguous accretion of gas along the large-scale filament feeding MACSJ0717.5+3745. A deeper Chandra observation would allow this hypothesis to be tested and may yield the first credible characterization of the gas content of large-scale filaments.
References
- Beers et al. (1990) Beers, T. C., Flynn, K., & Gebhardt, K. 1990, AJ, 100, 32
- Bradač et al. (2008) Bradač, M. et al. 2008, ArXiv e-prints, 806, arXiv:0806.2320
- Colberg et al. (2000) Colberg, J. M., et al. 2000, MNRAS, 319, 209
- Colberg et al. (1999) Colberg, J. M., et al. 1999, MNRAS, 308, 593
- Ebeling et al. (2001) Ebeling, H., Edge, A., & Henry, P. 2001, ApJ, 553, 668
- Ebeling et al. (2004) Ebeling, H., Barrett, E., & Donovan, D. 2004, ApJL, 609, 49
- Ebeling et al. (2006) Ebeling, H., White, D., & Rangarajan, F. 2006, MNRAS, 368, 65
- Ebeling et al. (2007) Ebeling, H. et al. 2007, ApJL, 661, 33
- Edge et al. (2003) Edge, A. C. et al. 2003, MNRAS, 339, 913
- Garmire et al. (2003) Garmire, G. P. et al. 2003, Proc. SPIE, 4851, 28
- Ma et al. (2008) Ma, C-J. et al. 2008, ApJ , 684, 160
- Kartaltepe et al. (2008) Kartaltepe, J. et al. 2008, MNRAS in press
- Mahdavi et al. (2007) Mahdavi, A. et al. 2007, ApJ, 668, 806
- Markevitch et al. (2000) Markevitch, M., et al. 2000, ApJ, 541, 542
- Markevitch et al. (2004) Markevitch, M. et al. 2004, ApJ, 606, 819
- Mewe et al. (1985) Mewe, R., Gronenschild, E.H.B.M., & van den Oord, G.H.J. 1985, A&AS, 62, 197
- Petrosian et al. (2006) Petrosian, V, Madejski, G, & Luli, K, 2006, ApJ, 652, 948
- Randall et al. (2008) Randall, S. W. et al. 2008, ApJ, 679, 1173
- Sarazin (2002) Sarazin, C. L. 2002, Merging Processes in Galaxy Clusters, 272, 1
- Sanders (2006) Sanders, J. S. 2006, MNRAS, 371, 829