X-ray Emission from the FU Orionis Star V1735 Cygni
Abstract
The variable star V1735 Cyg (= Elias 1-12) lies in the IC 5146 dark cloud and is a member of the class of FU Orionis objects whose dramatic optical brightenings are thought to be linked to episodic accretion. We report the first X-ray detections of V1735 Cyg and a deeply-embedded class I protostar lying 24′′ to its northeast. X-ray spectra obtained with EPIC on XMM-Newton reveal very high-temperature plasma (kT 5 keV) in both objects, but no large flares. Such hard X-ray emission is not anticipated from accretion shocks and is a signature of magnetic processes. We place these new results into the context of what is presently known about the X-ray properties of FU Orionis stars and other accreting young stellar objects.
1 Introduction
IC 5146 originally referred to the bright nebula surrounding the B1V star BD 46∘3474 and was already identified in early observations by Espin (1900). The nebula is commonly referred to as the Cocoon Nebula. Wolf (1904) noted that faint stars were present in the nebula but were much less numerous immediately outside it. Later optical studies by Walker (1959), Herbig (1960), and Forte & Orsatti (1984) confirmed that a cluster of more than 100 faint young stars surrounds BD 46∘3474. Herbig & Dahm (2002) showed that many of these faint objects exhibit H emission and are pre-main sequence (PMS) T Tauri stars. They obtained a cluster distance d = 1200 pc (with an uncertainty of at least 180 pc), mean extinction AV = 3.0 0.2 mag, and age 1 Myr.
Dark cloud filaments extend 2∘ westward from BD 46∘3474 (Wolf 1904), and this region is commonly referred to as the IC 5146 dark cloud. Deep near-IR (HK) imaging of a portion of the filament known as the Northern Streamer by Lada, Alves, & Lada (1999) revealed heavily-embedded young stars with extinctions up to AV 20 - 50 mag. Submillimeter surveys have detected dense cores in some of the filaments that may be prestellar (Kramer et al. 2003), suggesting that stars are actively forming within the dark cloud.
A recent Spitzer study of the IC 5146 star-forming region using the IRAC and MIPS cameras was presented by Harvey et al. (2008; hereafter H08). They reexamined the distance to the region based on a comparison with the Orion Nebula Cluster (ONC), which is of similar age. H08 concluded that: (i) the most likely distance to the optical cluster surrounding BD 46∘3474 is 950 80 pc, and (ii) the IC 5146 dark cloud lying to the west of BD 46∘3474 is at a similar distance. H08 used infrared colors to identify more than one hundred candidate young stellar objects (YSOs) in IC 5146 and modeled their spectral energy distributions to infer disk properties. They concluded that 40% of the cluster members detected by Spitzer are surrounded by disks.
One of the most unusual objects identified to date in the IC 5146 dark cloud is the variable star V1735 Cyg, lying 1∘ west of BD 46∘3474. It has an infrared spectral energy distribution characteristic of a class II 111The YSO class is determined from the slope of the infrared spectral energy distribution, where = log()/log . Greene et al. (1994) used flux densities in the 2.2 - 10 m range to compute but H08 used data over the range = 2.2 - 24 m where available. Greene et al. (1994) classify sources with 0.3 as class I, 0.3 0.3 as flat-spectrum, 0.3 1.6 as class II, and 1.6 as class III. source (H08). It was discovered in the near-IR survey of Elias (1978) and is object number 12 (Elias 1-12) in his catalog. On the basis of a comparison with previous red Palomar plates, Elias concluded that this object brightened by at least 5 magnitudes at R sometime between 1952 and 1965. He also noted that its spectrum is similar to the eruptive variable FU Orionis and he classified V1735 Cyg as an FU Orionis star (FUor). These rare objects have undergone strong optical outbursts that are thought to be related to episodic disk accretion, as reviewed by Hartmann & Kenyon (1996; hereafter HK96). The enhanced accretion gives rise to a strong wind and CO observations of V1735 Cyg provide evidence for mass outflow (Levreault 1983). The radio continuum emission detected from V1735 Cyg is consistent with free-free wind emission at an ionized mass-loss rate 10-7 M⊙ yr-1 (Rodriguez & Hartmann 1992). Cold dust is also present near the star as evidenced by a submillimeter detection (Sandell & Weintraub 2001, hereafter SW01).
We present here the results of an X-ray observation of the IC 5146 dark cloud obtained with XMM-Newton, centered near V1735 Cyg. This observation was obtained as part of a broader program aimed at determining if FUors are X-ray sources and establishing their X-ray properties, which prior to this survey were unknown. We recently reported the X-ray detection of the prototype star FU Orionis with XMM-Newton, which shows an unusual double-absorption X-ray spectrum with a soft and hard component (Skinner, Briggs, & Güdel 2006; hereafter SBG06). We show here that V1735 Cyg is also an X-ray source with a hard component. We also report the discovery of a second heavily-absorbed X-ray source located 24′′ northeast of V1735 Cyg that is associated with a class I protostar detected in the mid-infrared by Spitzer.
2 XMM-Newton Observations
The observation began on 2006 July 22 at 15:27 UT and ended at 23:15 UT. Data were acquired with the European Photon Imaging Camera (EPIC), which provides charge-coupled device (CCD) imaging spectroscopy from the pn camera (Strüder et al. 2001) and two nearly identical MOS cameras (MOS1 and MOS2; Turner et al. 2001). The observation was obtained in full-window mode using the medium optical blocking filter. The EPIC cameras provide energy coverage in the range E 0.2 - 15 keV with energy resolution E/E 20 - 50. The MOS cameras provide the best on-axis angular resolution with FWHM 4.3′′ at 1.5 keV.
Data were reduced using the XMM-Newton Science Analysis System (SAS vers. 7.1). To insure that the latest calibration was applied, we ran the SAS pipeline processing tasks and to generate updated pn and MOS event files. These event files were then filtered to select good event patterns. Inspection of pn background light curves showed two short intervals of elevated background, and these intervals were excluded during spectral extraction. We obtained 27,275 s of total PN exposure and 26,000 s of usable exposure after removing the two high background intervals. No time-filtering of the MOS data was required and the usable exposure times were 31,663 s (MOS1) and 31,667 s (MOS2).
Spectra and light curves were extracted from circular regions of radius Re = 15′′ centered on V1735 Cyg and other sources of interest, corresponding to 68% encircled energy at 1.5 keV. Background spectra and light curves were obtained from circular source-free regions near the source. The SAS tasks rmfgen and arfgen were used to generate source-specific response matrix files (RMFs) and auxiliary response files (ARFs) for spectral analysis. The data were analyzed using the XANADU software package 222The XANADU X-ray analysis software package is developed and maintained by NASA’s High Energy Astrophysics Science Archive Research Center. See http://heasarc.gsfc.nasa.gov/docs/xanadu/xanadu.html for further information., including XSPEC vers. 12.4.0.
3 Results
3.1 X-ray Properties of V1735 Cygni
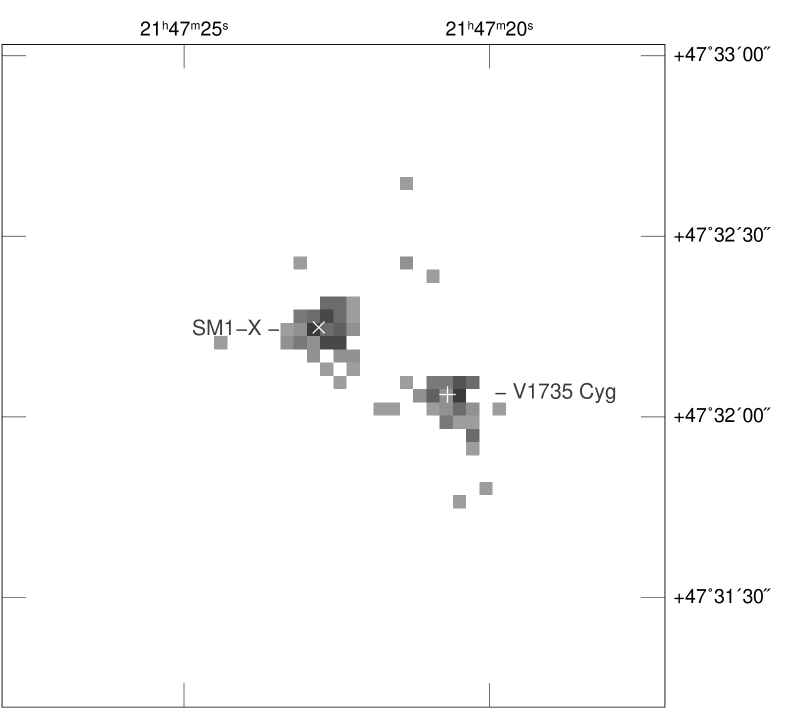
Figure 1 shows the XMM-Newton MOS image near
V1735 Cyg. Two X-ray sources separated by 24′′ are
present. The position of the southwest source (Table 1)
is offset by 0.′′91 from the HST
Guide Star Catalog (GSC v2.3.2) optical position of V1735 Cyg
(HST J214720.66473203.8), 1.′′02 from
its 2MASS position (2MASS J214720.65473203.5;
Fig. 2), and 0.′′83 from its Spitzer position
(Spitzer J214720.65473203.8; H08; Fig. 3). These offsets
are nearly identical to the mean rms positional offset of
1.0′′ determined by comparing the X-ray
and near-IR positions of 18 sources in
the EPIC field having 2MASS counterparts.
These offsets are consistent with the expected
XMM-Newton positional accuracy of 1′′
at the signal-to-noise (S/N) ratio of our data
333XMM-Newton EPIC calibration data can be found at:
http://xmm2.esac.esa.int/docs/documents/CAL-TN-0018.pdf.
We find no other optical or near-IR sources
within 10′′ of V1735 Cyg in the HST GSC,
USNO B1, 2MASS, or HEASARC on-line extragalactic catalogs
444http://heasarc.gsfc.nasa.gov/docs/archive.html
and therefore conclude
that V1735 Cyg is the most likely counterpart to
X-ray source XMM J214720.58473204.3.
The JCMT submillimeter position of V1735 Cyg given by SW01 is offset 4.′′6 - 4.′′8 northeast of the HST GSC, Spitzer, and XMM-Newton positions of V1735 Cyg. A similar northeasterly offset is noted for the JCMT position of the submillimeter source SM1 (Sec. 3.2). This may indicate a slight systematic northeasterly shift of JCMT positions relative to optical, IR (H08), and X-ray (Table 1) positions but it should be kept in mind that the JCMT observations were sensitive to cold dust emission which does not always peak at the stellar position.
Figure 4 shows the X-ray light curve of V1735 Cyg from the pn detector. No large amplitude variability is detected. A variability test on the pn light curve binned at 2000 s intervals gives a probability of constant count rate Pconst = 0.81 (/dof = 8.5/13) and a larger binsize of 5000 s gives Pconst = 0.56. Analysis of the individual MOS light curves binned at 5000 s intervals give Pconst = 0.46 (MOS1) and Pconst = 0.36 (MOS2). Thus, no statistically significant X-ray variability is found for V1735 Cyg.
Figure 5 shows the pn X-ray spectrum of V1735 Cyg. Faint line features are visible near 1.86 keV (Si XIII) and 6.67 keV (Fe K complex, including Fe XXV), implying thermal emission rather than a power-law spectrum. We have thus fitted the spectra with single-temperature (1T) and two-temperature (2T) optically thin plasma models (Table 2). The 1T model is statistically acceptable and requires a high but uncertain plasma temperature with a lower bound kT 6.4 keV (90% confidence). There are insufficient counts in the spectra to place a useful upper bound on the plasma temperature.
The 1T model gives an absorption column density equivalent to visual extinction AV = 2.9 [2.1 - 4.8] mag using the conversion NH = 2.2 1021 AV cm-2 mag-1 (Gorenstein (1975), and a similar value using the Ryter (1996) conversion. Alternatively, the conversion of Vuong et al. (2003) from data for the Oph dark cloud is NH = 1.6 1021 AV cm-2 mag-1 (assuming AJ/AV = 0.28) and gives AV = 4.1 [2.9 - 6.6] mag. The above values are less than the values AV 8.0 - 10.8 mag determined from infrared studies of V1735 Cyg (Elias 1978; H08). Assuming that the infrared values are correct, this could be an indirect clue that the 1T model is an oversimplification.
A 2T model gives a value of the fit statistic that is nearly identical to that of 1T , but converges to a higher absorption that equates to AV = 6.5 [1.8 - 10.6] mag (Gorenstein 1975; Table 2 notes). This is in better agreement with the above IR estimates but the temperatures of the cool (kT1 1 keV) and hot (kT2 5 keV) components in the 2T model are poorly-constrained. Any cool plasma would be quite heavily-absorbed and difficult to detect, but could be present since most low-mass YSOs do show both a cool and hot component. This is generally true for T Tauri stars (Preibisch et al. 2005; hereafter P05) and is also the case for FU Ori (SBG06).
To summarize the above: the simplest 1T thermal model that provides an acceptable fit to the V1735 Cyg X-ray spectrum gives an equivalent AV that is a factor of 2 less than published values based on IR data. This discrepancy can be alleviated by adding a second cool plasma component to the X-ray spectral model (2T ). There is good reason to suspect that such a cool component may be present, but acceptable X-ray fits can be obtained without it.
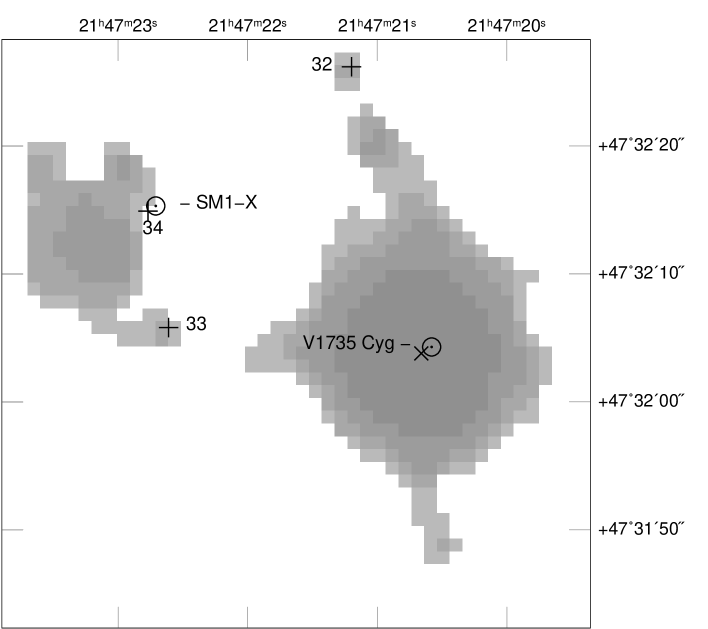
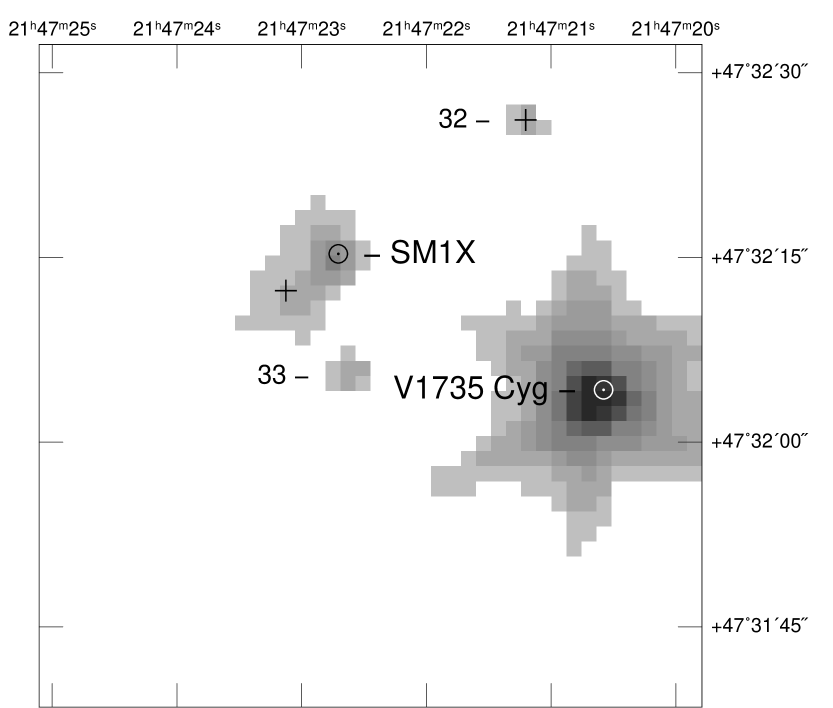
3.2 X-ray Properties of SM1-X
The X-ray source detected 24′′ northeast of V1735 Cyg is not visible in 2MASS near-IR images (Fig. 2), but is clearly seen in Spitzer IRAC images (Fig. 3) and is also detected by MIPS at 24 and 70 microns (H08). The Spitzer counterpart to the X-ray source is listed as source number 34 in the catalog of H08 who identified it with the JCMT submillimeter source SM1 (SW01). The JCMT position of SM1 is offset 3.′′5 - 3.′′8 northeast of the Spitzer and XMM positions, similar to the JCMT offset noted for V1735 Cyg (Sec. 3.1). Assuming that some (or all) of the JCMT positional offset is systematic, it seems likely that the submillimeter source is the same object detected by Spitzer and XMM-Newton. We thus hereafter refer to this X-ray source as SM1-X (= XMM J214722.71473215.3; Table 1). Using Spitzer data, H08 concluded that this object is an extremely cold, embedded class I source. Figure 3 also reveals two other faint nearby mid-IR sources listed as class I objects 32 and 33 in H08. Their 8 m flux densities are more than an order of magnitude lower than SM1 and V1735 Cyg, and neither was detected in X-rays.
The pn X-ray light curve of SM1-X (Fig. 4) does not show any large impulsive flares but there is a slow decline in count rate by a factor of 2 during the first 20 ksec of the observation. A analysis of the pn light curve binned at 2000 s intervals gives Pconst = 0.19 and a larger binsize of 3000 s gives Pconst = 0.03. Thus, slow low-level X-ray variability is likely present in SM1-X.
The pn spectrum (Fig. 5) shows a hard component including a detection of the Fe K emission line complex at 6.67 keV. There is no clear detection of a fluorescent Fe line at 6.4 keV but there is some weak emission redward of the Fe K line visible in unbinned spectra and higher S/N spectra would be useful to determine if a fluorescent line is present.
A 1T model is acceptable (Table 2) and gives a best-fit temperature kT = 6.5 [3.9 - 11.9; 90% confidence] keV. The absorption column density is much higher than that of V1735 Cyg and yields an equivalent visual extinction AV = 35 [29 - 42] mag (Gorenstein 1975). This X-ray source is thus very heavily obscured, as is typical of class I objects. Since there are no obvious emission lines in the spectrum apart from the strong Fe K line, we also tried fitting the data with a power-law model plus a Gaussian line component to reproduce the Fe K line. This model is acceptable (Table 2) and gives a best-fit line energy Eline = 6.64 [6.51 - 6.77] keV, in accord with the Fe K identification, and a reduced that is identical to the 1T model. The absorption inferred from the power-law model is about 10% larger than determined from .
4 Discussion
4.1 X-ray Emission from FU Orionis Stars
FUors were originally identified on the basis of their dramatic optical outbursts (Herbig 1966, 1977). Only a few of these classical FUors are known (HK96, SW01). We have now observed the four classical FUors that define the class with XMM-Newton as part of our exploratory survey aimed at determining their X-ray properties. As summarized in Table 3, we have detected V1735 Cyg and the prototype FU Ori, but V1057 Cyg and V1551 Cyg were undetected.
Both V1735 Cyg and FU Ori show high-temperature plasma at kThot 5 keV that is characteristic of magnetic (e.g. coronal) processes and incompatible with accretion shocks. This is substantiated by a definite detection of the Fe K line at 6.67 keV in FU Ori, and a possible detection in V1735 Cyg (Fig. 5). This line complex emits maximum power at log Tmax 7.6 K. Moreover, this high-temperature plasma is detected even in the absence of any obvious large flares, suggesting that its presence is not transient. In the case of FU Ori, the hot X-ray component is viewed under much higher absorption NH 1023 cm-2 (SBG06) than is anticipated from visual extinction estimates (Table 3). The origin of this excess absorption is not yet known but either the disk, cold accreting gas, or FU Ori’s strong wind may contribute (SBG06).
A cool plasma component is also detected in FU Ori (Fig. 5) at a best-fit temperature kTcool = 0.7 [0.1 - 1.0; 90% conf.] keV, and the absorption associated with this component is consistent with AV estimates (SBG06; Table 3). There is no clear detection of a cool plasma component in V1735 Cyg, but the absorption inferred from X-ray spectral fits is in better agreement with IR values if a cool component is included in the spectral model (Sec. 3.1).
One of the primary reasons for undertaking an X-ray survey of FUors was to determine if accretion shocks might play a role in their X-ray emission. They are accreting at very high rates up to 10-4 M⊙ yr-1 (HK96). An accretion shock is expected to reveal itself in X-rays as soft emission at a characteristic temperature kTshock 0.02v keV where v100 is the infall speed in units of 100 km s-1 (Ulrich 1976). For plausible infall speeds of a few hundred km s-1, the expected shock temperature is kTshock 0.1 - 0.2 keV.
Accretion shock emission may be present in the classical T Tauri star (CTTS) TW Hya ( 10-8 M⊙ yr-1), based on the detection of cool plasma for which a high density was inferred from line flux ratios in X-ray grating observations (Kastner et al. 2002; Stelzer & Schmitt 2004). No X-ray grating observations have yet been obtained of FUors but, as noted above, a cool plasma component is detected in FU Ori and may also be present in V1735 Cyg. Even so, the temperature of the cool component kT = 0.7 [0.1 - 1.0] keV (T 8 MK) for FU Ori is several times higher than expected for an accretion shock. Plasma at T 8 MK is quite typical of T Tauri stars and is also frequently detected in coronally-active stars that are not accreting (P05). It is thus by no means certain that the cool emission seen in the FU Ori X-ray spectrum is accretion-related.
4.1.1 X-ray Constraints on Stellar Luminosity and Mass
The X-ray luminosities of both V1735 Cyg and FU Ori (Table 3; Fig. 6) are at the high end of the range observed for other YSOs (excluding massive hot stars) such as those in the ONC (P05), Serpens (Giardino et al. 2007, hereafter G07), and the Taurus molecular cloud (Güdel et al. 2007; Telleschi et al. 2007, hereafter T07). The high LX is particularly intriguing because it is present even in the absence of any obvious large flares. This could be an indication that the central stars are at the high end of the luminosity (or mass) range typically found for T Tauri stars, since it is known that LX increases with stellar luminosity (Lstar) and stellar mass (Mstar) in T Tauri stars (P05; T07). Interestingly, it has been suggested that the central star in V1735 Cyg is a high-luminosity object (Elias 1978) and a similar claim has been made for FU Ori (Herbig, Petrov, & Duemmler 2003; Petrov & Herbig 2008).
In general, the spectral types, masses, and luminosities of the central stars in FUors are not well-determined because of the difficulty in disentangling spectral features of the star from those of the luminous accretion disk, and imprecise knowledge of disk properties and disk inclination angle (e.g. Kenyon, Hartmann, & Hewett 1988; HK96). Because of the high accretion rates of FUors, the accretion-disk luminosity during outbursts can be comparable to that of the underlying star and will contribute significantly to the bolometric luminosity Lbol Lstar Ldisk given in Table 3.
Given the uncertainties in stellar properties of FUors, it is worthwhile to seek constraints on Lstar or Mstar using the X-ray data. To obtain a quantitative estimate of Lstar for V1735 Cyg, we assume that the underlying star is a single object resembling a TTS and that its LX was not temporarily elevated during our observation because of a flare. We use the correlation between Lstar and LX found for CTTS in the XEST survey of Taurus, which has less scatter than the COUP ONC sample. The linear regression fit for the XEST CTTS sample is (T07; Fig. 6): log LX = 1.16 (0.09) log (Lstar/L⊙) 29.83 (0.06) ergs s-1. Using LX from Table 1, this relation gives Lstar 5 - 22 L⊙ for V1735 Cyg. This estimate accounts for uncertainties in LX for V1735 Cyg from different spectral models (Table 2) and uncertainties in the XEST regression fit. But, other factors such as age differences between the Taurus CTTS sample and V1735 Cyg could also affect the comparison.
The inferred luminosity Lstar 5 - 22 L⊙ is reasonable for a TTS or even a class I object, but is at the high end of their ranges (Doppmann et al. 2005; Getman et al. 2005; P05; T07). LX is also correlated with stellar mass and the XEST regression fit using the bisector method for CTTS in Taurus gives (T07): log LX = 1.98 (0.20) log (Mstar/M⊙) 30.24 (0.06) ergs s-1. This would require Mstar 1.7 M⊙ to account for the X-ray luminosity of V1735 Cyg. A similar lower limit on Mstar is obtained from the COUP ONC regression fits (P05). A reliable upper limit on Mstar cannot be obtained from the XEST or COUP regression fits because they are based on stars with Mstar 2 M⊙.
The above estimates assume that the underlying star in V1735 Cyg is a T Tauri-like object and that it obeys the regression relations for TTS. This is a reasonable assumption given that the optical spectrum of at least one FUor, V1057 Cyg, resembled a TTS prior to outburst (Herbig 1977). Unfortunately, little is known about the pre-outburst nature of V1735 Cyg (Elias 1978). The above estimates also assume that the X-ray emission of V1735 Cyg arises in a single star and not an unresolved binary. Obviously, if the X-ray luminosity is the summed contribution of two stars in a close binary system then the above values of Lstar and Mstar would be overestimated. However, we are not aware of any reports so far that V1735 Cyg is a spectroscopic binary and high-resolution Keck I spectra have shown that the radial velocity of FU Ori is constant to within 0.3 km s-1 over three years (Petrov & Herbig 2008).
The preceding analysis shows that the X-ray luminosity of V1735 Cyg is consistent with the value expected for a central star that is a relatively luminous (Lstar 5 - 22 L⊙) or massive (Mstar 1.7 M⊙) single T Tauri star. By analogy, a similar conclusion holds for FU Ori since its X-ray luminosity is comparable to that of V1735 Cyg (Table 3). If future observations demonstrate that either Lstar or Mstar is significantly less than these values, we would be forced to conclude that LX in these X-ray bright FUors is enhanced above the normal levels found for T Tauri stars. Whether any dramatic increase in LX might have occurred during their previous outbursts is not known because there are no pre-outburst X-ray data for classical FUors.
Following the above approach, upper limits on Lstar and Mstar can be obtained for the undetected FUors V1057 Cyg and V1515 Cyg. Applying the XEST CTTS regression results to the tighter upper limit log LX 30.0 ergs s-1 for V1057 Cyg (Table 3) gives Lstar 1.4 (0.2) L⊙ and Mstar 0.8 (0.3) M⊙. Although the upper limits on LX for V1057 Cyg and V1515 Cyg are well below the values of the two detected FUors, they are still not particularly stringent. The majority of YSOs in nearby star-forming regions such as the ONC and Taurus molecular cloud emit at levels log LX 30.0 ergs s-1 (Getman et al. 2005; P05; T07). Models of the mid- to far-IR emission of V1057 Cyg and V1515 Cyg suggest that they are viewed nearly pole-on through evacuated cavities in surrounding envelopes (Kenyon & Hartmann 1991; Millan-Gabet et al. 2006; Zhu et al. 2008). If that is the case, then a low-extinction path would be available for stellar X-rays to escape. Thus, deeper observations of V1057 Cyg and V1515 Cyg are needed to search for fainter emission that could be present if the central stars are lower mass objects of a few tenths of a solar mass.
4.2 X-ray Emission from Class I Protostars
As a result of deep surveys of star-forming regions like COUP (Getman et al. 2005) and XEST (Güdel et al. 2007), a wealth of X-ray data now exists for class II (CTTS) and class III (weak-lined TTS) YSOs. Much less is known about the X-ray properties of heavily-obscured class I protostars, but some trends are now beginning to emerge. For example, there is good evidence that X-ray absorption column densities decrease in progressing from embedded class I sources to optically-revealed non-accreting class III objects (G07; Prisinzano et al. 2008, hereafter P08). Values of NH 1022 - 1023 cm-2 are commonly found for class I objects. There is a trend for lower unabsorbed X-ray luminosity in class I sources, as compared to class II and III (G07; P08), for reasons that are not yet fully understood. Most class I sources have X-ray luminosities log LX 31.0 ergs s-1 (P05; G07; Ozawa, Grosso, & Montmerle 2005; T07) but in rare cases higher. Also, sources with higher unabsorbed LX tend to have higher average plasma temperatures (P08). Class I sources are often variable in X-rays (P08), and some dramatic magnetic-reconnection flares were detected in class I sources during a long Chandra exposure of the Oph molecular cloud (Imanishi, Koyama, & Tsuboi 2001; hereafter I01). Interestingly, some class I sources in Oph were detected only when they flared. Thus, the two class I objects near V1735 Cyg (sources 32 and 33 in Fig. 3) which were undetected in our XMM observation may well be capable of transient X-ray outbursts.
The properties of the class I object SM1-X analyzed in this work are in general agreement with the above results, but its high LX is exceptional (Table 1). The high plasma temperature of SM1-X is consistent with the trend noted above for higher average temperatures in sources with high LX. The high plasma temperature of SM1-X determined from the thermal spectral model (Table 2) points clearly to a magnetic origin for its X-ray emission. Temperatures derived from spectral fits of heavily-absorbed objects like SM1-X can be biased toward high values because the low-energy part of the spectrum is masked, but the presence of the Fe K line leaves little doubt that hot X-ray plasma is present. Because of the high X-ray absorption, any soft emission that might be present due to accretion shocks, shocked outflows, or a cool coronal component escapes detection.
The high X-ray luminosity log LX = 31.6 ergs s-1 inferred for SM1-X (Table 1) is remarkable because it was observed even in the absence of any large flares. Comparable X-ray luminosities have been reported in some class I objects such as YLW 15A in Oph (I01), but were recorded during flares. However, as we have noted, there is a slow decline in the X-ray count rate of SM1-X during the first 20 ks of the observation (Fig. 4), and it is conceivable that this represents the decay tail of a large flare that peaked prior to the start of the XMM observation.
There are other processes besides flare decay that could be responsible for the slow X-ray variability of SM1-X. Similar slow variability has also been seen in other X-ray sources such as IRS 7B (= IRS 7 XE) in the Corona Australis dark cloud (Hamaguchi et al. 2005, 2006). This X-ray source corresponds to a young class 0/I transitional object (Groppi et al. 2007). One possibility is that the slow variability is tied to stellar rotation. That is, part of the X-ray emitting region may be periodically occulted by the star or disk. Such modulation has been detected in some ONC YSOs (Flaccomio et al. 2005). Longer time monitoring of specific class I protostars over timescales of days to weeks would be useful to search for X-ray periodicity.
The presence of large-amplitude X-ray flares in some class I sources and the existence of very hot plasma provide strong (but indirect) evidence that these objects do have magnetic fields. These fields are evidently present in very young objects since the estimated age of the low-mass pre-main sequence population in IC 5146 is 0.6 Myr (H08). This poses the interesting theoretical question of how young class I objects which are presumably fully-convective can produce magnetic fields. Are the fields internally-generated by dynamo action, as simulations suggest could be the case for fully-convective M dwarfs (Browning 2008)? Or, are the fields primordial and inherited from the parent molecular cloud?
Lastly, it is worth calling attention to the striking similarity between the X-ray spectrum of the class I source SM1-X and the hard (kT 2 keV) spectral component of FU Ori (Fig. 5). Thermal models give similar high temperatures kT 6 - 7 keV and high absorption column densities NH 1023 cm-2 in both cases (Table 2; SBG06). Some subtle differences are present however. For example, the weak fluorescent Fe line at 6.4 keV that is likely present in FU Ori is not clearly detected in SM1-X. But, the fluorescent Fe line has been seen in other class I sources (I01) and is usually interpreted as arising in cold near-neutral material near the star - possibly the disk (Tsujimoto et al. 2005). The differences seen between SM1-X and FU Ori at low energies below 2 keV may be absorption-related and do not necessarily reflect intrinsic differences in their underlying spectral properties. The strong similarity in their hard spectral component suggests a possible link between FU Ori and class I protostars. Similarities between FUors and class I objects have also been noted at submillimeter wavelengths (SW01).
5 Summary and Open Questions
Our exploratory survey with XMM-Newton has obtained the first pointed X-ray observations of four classical FUors. The prototype FU Ori as well as V1735 Cyg were detected, but V1057 Cyg and V1515 Cyg were not. Both detections show high-temperature X-ray plasma that is undoubtedly associated with magnetic (e.g. coronal) processes, but no large-amplitude flares. Cool X-ray plasma (kTcool = 0.7 [0.1 - 1.0] keV) is also present in FU Ori, but not clearly detected in V1735 Cyg. The cool plasma temperature is at least a factor of 2 higher than expected for an accretion shock, so a magnetic (coronal) origin seems likely. But, the temperature of the cool component is quite uncertain and a pending deep Chandra observation may provide tighter temperature constraints.
The X-ray luminosities of both FU Ori and V1735 Cyg are at the high-end of the range observed for low-mass YSOs. This fact, along with the known correlation between LX and stellar luminosity (or mass) in YSOs, suggests that the central stars in FU Ori and V1735 Cyg are high-luminosity objects, as has previously been proposed. Thus, X-ray observations offer the potential to determine properties of the central star in FUor stardisk systems that are exceedingly difficult to extract from their complex optical and infrared spectra.
We have obtained the first X-ray detection of the newly-discovered class I protostar SM1-X, located near V1735 Cyg. The X-ray spectrum is heavily-absorbed with an equivalent visual extinction AV 35 mag, confirming that SM1-X is still deeply-embedded and very young. Its high X-ray temperature is characteristic of magnetic processes and adds to the accumulating evidence that class I sources have magnetic fields. Whether these fields are internally-generated or primordial is still an open question. The origin of the slow low-level X-ray variabilility seen in SM1-X and other class I objects such as IRS 7B in CrA is still a mystery, but it may be linked to stellar rotation. If this can be confirmed from longer monitoring over timescales of days to weeks, then X-ray observations may be able to provide information on rotation periods for embedded class I protostars that is difficult to obtain by other methods.
The X-ray spectrum of the class I object SM1-X is remarkably similar to the hard component detected in FU Ori. General similarities between FUors and class I sources have also been noted at submillimeter wavelengths (SW01). This suggests a possible link between FU Ori and class I protostars. The precise nature of any such relationship is unclear, but it may be that FU Ori is now in the process of emerging from the deeply-embedded class I phase.
References
- (1) Adams, F.C., Lada, C.J., & Shu, F.H. 1987, ApJ, 312, 788
- (2) Anders, E., & Grevesse, N. 1989, Geochim. Cosmochim. Acta, 53, 197
- (3) Browning, M.K. 2008, ApJ, 676, 1262
- (4) Doppmann, G.W. Greene, T.P., Covey, K.R., & Lada, C.J. 2005, ApJ, 130, 1145
- (5) Elias, J.H. 1978, ApJ, 223, 859
- (6) Espin, T.E. 1900, AN, 152, 135
- (7) Flaccomio, E. et al. 2005, ApJS, 160, 450
- (8) Forte, J.C. & Orsatti, A.M. 1984, ApJS, 56, 211
- (9) Getman, K.V. et al., 2005, ApJS, 160, 319
- (10) Giardino, G., Favata, F., Micela, G., Sciortino, S., & Winston, E. 2007, A&A, 463, 275 (G07)
- (11) Gorenstein, P., 1975, ApJ, 198, 95
- (12) Green, J.D. et al. 2006, ApJ, 648, 1099
- (13) Greene, T.P., Wilking, B.A., André, P., Young, E.T., & Lada, C.J. 1994, ApJ, 434, 614
- (14) Groppi, C.E., Hunter, T.R., Blundell, R., & Sandell, G. 2007, ApJ, 670, 489
- (15) Güdel, M. et al. 2007, A&A, 468, 353
- (16) Hamaguchi, K. et al. 2005, ApJ, 623, 291
- (17) Hamaguchi, K. et al. 2006, in Proceedings of the X-ray Universe 2005 (ESA SP-604), ed. A. Wilson, 33
- (18) Hartmann, L. & Kenyon, S.J. 1996, ARA&A, 34, 207 (HK96)
- (19) Harvey, P.M. et al. 2008, ApJ, 680, 495 (H08)
- (20) Herbig, G.H. 1960, ApJ, 131, 516
- (21) Herbig, G.H. 1966, Vistas in Astron., 8, 109
- (22) Herbig, G.H. 1977, ApJ, 217, 693
- (23) Herbig, G.H. & Dahm, S.E. 2002, AJ, 123, 304
- (24) Herbig, G.H., Petrov, P.P., & Duemmler, R. 2003, ApJ, 595, 384
- (25) Imanishi, K., Koyama, K., & Tsuboi, Y. 2001, ApJ, 557, 747 (I01)
- (26) Kastner, J.H., Huenemoerder, D.P., Schulz, N.S., Canizares, C.R., & Weintraub, D.A., 2002, ApJ, 567, 434
- (27) Kenyon, S.J.& Hartmann, L. 1991, ApJ, 383, 664
- (28) Kenyon, S.J., Hartmann, L., & Hewett, R., 1988, ApJ, 325, 231
- (29) Kenyon, S.J., Hartmann, L., & Kolotilov, E.A. 1991, PASP, 103, 1069
- (30) Kramer, C., Richer, J., Mookerjea, B., Alves, J., & Lada, C. 2003, A&A, 399, 1073
- (31) Lada, C.J., Alves, J., & Lada, E.A. 1999, ApJ, 512, 250
- (32) Levreault, R.M., 1983, ApJ, 265, 855
- (33) Lorenzetti, D. et al. 2000, A&A, 357, 1035
- (34) Millan-Gabet, R. et al. 2006, ApJ, 641, 547
- (35) Ozawa, H., Grosso, N., & Montmerle, T. 2005, A&A, 429, 963
- (36) Petrov, P.P. & Herbig, G.H., 2008, AJ, 136, 676
- (37) Preibisch, T. et al. 2005, ApJS, 160, 401 (P05)
- (38) Prisinzano, L. et al. 2008, ApJ, 677, 401 (P08)
- (39) Quanz, S.P., Henning, T., Bouwman, J., Ratzka, T., & Leinert, C. 2006, ApJ, 648, 472
- (40) Rodriguez, L.F., & Hartmann, L.W. 1992, Rev. Mex. Astron. Astrof., 24, 135
- (41) Ryter, C.E. 1996, Ap&SS, 236, 285
- (42) Sandell, G. & Weintraub, D.A. 2001, ApJS, 134, 115 (SW01)
- (43) Skinner, S.L., Briggs, K.R., & Güdel, M. 2006, ApJ, 643, 995 (SBG06)
- (44) Stelzer, B. & Schmitt, J.H.M.M. 2004, A&A, 418, 687
- (45) Strüder, L. et al. 2001, A&A, 365, L18
- (46) Telleschi, A., Güdel, M., Briggs, K.R., Audard, M., & Palla, F. 2007, A&A, 468, 425 (T07)
- (47) Tsujimoto, M. et al. 2005, ApJS, 160, 503
- (48) Turner, M.J.L. et al. 2001, A&A, 365, L27
- (49) Ulrich, R.K. 1976, ApJ, 210, 377
- (50) Vuong, M.H., Montmerle, T., Grosso, N., Feigelson, E.D., Verstraete, L., & Ozawa, H. 2003, A&A, 408, 581
- (51) Walker, M.F. 1959, ApJ, 130, 57
- (52) Wolf, M. 1904, MNRAS, 64, 838
- (53) Zhu, Z., Hartmann, L., Calvet, N., Hernandez, J., Tannirkulam, A.-K., & D’Alessio, P. 2008, ApJ, 684, 1281
| V1735 Cyg | SM1-X | |
|---|---|---|
| R.A. (h,m,s) | 21 47 20.585 | 21 47 22.710 |
| Decl. (∘, ′, ′′) | 47 32 04.3 | 47 32 15.3 |
| pn rate (c/ks) | 5.3 1.3 | 8.1 2.2 |
| MOS rate (c/ks) | 2.4 0.7 | 2.9 0.6 |
| log LX (ergs s-1)aaLX (0.5 - 7 keV) is unabsorbed at d = 1 kpc and the uncertainties in LX reflect the range of values obtained for different emission models (Table 2). | 31.0 0.2 | 31.6 0.1 |
| log (LX/Lbol)bbWe adopt Lbol = 235 L⊙ (H08) for V1735 Cyg, which includes the mid-IR excess from the disk. There is no reliable Lbol estimate for SM1-X. | 4.95 | … |
Note. — The J2000.0 X-ray positions are based on the XMM-Newton standard processing source list and have been corrected for systematic offsets using the SAS processing task . The mean count rates (1) are background-subtracted in the 0.5 - 7 keV range, computed from light curves binned at 3000 s (PN) and 5000 s (per MOS). The MOS count rates are per MOS. The total exposure times were 27,275 s (PN), 31,663 s (MOS1), and 31,667 s (MOS2).
| Parameter | |||
|---|---|---|---|
| Object | V1735 Cyg | SM1X | SM1X |
| Model | 1T APECaaA 2T APEC model gives a larger NH = 1.43 [0.39 - 2.34] 1022 cm-2 and a larger unabsorbed flux FX = 1.33 10-13 ergs cm-2 s-1 (log LX = 31.20 ergs s-1), with a nearly identical value of = 0.94. But the temperatures of the cool (kT1 1 keV) and hot (kT1 5 keV) components are poorly-constrained. | 1T APEC | PL linebbThe power-law (PL) model includes a Gaussian line component to model the Fe K emission line. It converged to a best-fit line energy Eline = 6.64 [6.51 - 6.77] keV, normline = 1.11 [0.42 - 2.15] 10-6, and = 67 [0 - 168] eV, where = FWHM/2.35. |
| NH (1022 cm-2) | 0.65 [0.46 - 1.06] | 7.82 [6.53 - 9.24] | 8.86 [6.68 - 13.1] |
| kT1 (keV) | 13.7 [6.37 - …] | 6.48 [3.87 - 11.9] | … |
| norm1 (10-5) | 3.28 [2.77 - 4.39] | 16.9 [13.3 - 25.3] | … |
| Z (Z⊙) | {1.0}ccAllowing the abundance to vary gives Z = 0.85 Z⊙, with no significant change in NH or , but higher kT. The 90% confidence bounds on Z are not tightly constrained by the data. | {1.0}ddAllowing the abundance to vary gives Z = 0.55 [0.23 - 1.01] Z⊙, NH = 8.72 [7.06 - 11.1] 1022 cm-2, kT = 5.42 [3.36 - 9.44] keV, /dof = 29.0/34, log LX = 31.58 ergs s-1. | … |
| … | … | 2.08 [1.54 - 2.59] | |
| normpl (10-5) | … | … | 9.86 [3.54 - 60.3] |
| /dof | 23.1/24 | 31.5/35 | 28.7/32 |
| 0.96 | 0.90 | 0.90 | |
| FX (10-14 ergs cm-2 s-1) | 3.95 (5.32) | 9.46 (27.7) | 9.22 (41.0) |
| log LX (ergs s-1) | 30.80 | 31.52 | 31.69 |
Note. — Tabulated values are based on simultaneous fits of all three EPIC spectra (PN, MOS1, MOS2) using the APEC optically thin plasma model and the power law (PL) model in XSPEC v12.4.0. The spectra were rebinned to a minimum of 15 (PN) and 10 (MOS) counts per bin. The tabulated parameters are absorption column density (NH), plasma temperature (kT), XSPEC normalization (norm), abundance (Z), and photon power-law index (). For the APEC models, the XSPEC norm is related to the emission measure (EM) by EM = 41014dnorm, where dcm is the stellar distance in cm. Curly braces enclosing the abundance mean that it was held fixed at solar abundances referenced to Anders & Grevesse (1989). Brackets enclose 90% confidence intervals. X-ray flux (FX) is the observed (absorbed) value followed in parentheses by the unabsorbed value in the 0.5 - 7.0 keV range. X-ray luminosity (LX) is the unabsorbed value in the 0.5 - 7.0 keV range. A distance of 1 kpc is assumed (Herbig & Dahm 2002; Harvey et. al 2008).
| Star | Distance | AV | Lbol | log LX | Refs. |
|---|---|---|---|---|---|
| (pc) | (mag) | (L⊙) | (ergs s-1) | ||
| FU Ori | 460 | 1.5 - 2.6 | 340 - 500 | 30.8 0.4 | 1,2,3,4,5,6,7,8 |
| V1735 Cyg | 950 - 1200 | 8.0 - 10.8 | 235 | 31.0 0.2 | 7,9,10,11 |
| V1057 Cyg | 600 | 3.0 - 4.2 | 250 - 800 | 30.0aaBased on 23.2 ksec of usable EPIC pn exposure obtained on 26 Nov 2005 using the medium optical blocking filter (Observation Id 0302640201). The LX estimate assumes an underlying two-temperature optically thin thermal plasma spectrum with kT1 = 0.7 keV, kT2 = 3.0 keV, and log NH = 21.83 cm-2. | 1,2,3,7,12,13,14,15 |
| V1515 Cyg | 1000 | 2.8 - 3.2 | 200 | 30.5bbBased on 34.2 ksec of usable EPIC pn exposure obtained on 22 Oct 2006 using the medium optical blocking filter (Observation Id 0402840101). The LX estimate assumes an underlying two-temperature optically thin thermal plasma spectrum with kT1 = 0.7 keV, kT2 = 3.0 keV, and log NH = 21.79 cm-2. | 1,2,7,8,13,14,15,16 |
Note. — Lbol refers to the stardisk system and includes IR-excess emission. LX (0.5 - 7 keV) is unabsorbed and the uncertainties in LX reflect the range of values obtained for different emission models (Table 2; SBG06). Upper limits on unabsorbed LX are from the Portable Interactive Mult-Mission Simulator (PIMMS) using EPIC pn count rates in the 0.5 - 7 keV range inside an extraction circle of radius Re = 15′′ centered on the optical position.
References.– (1) SW01; (2) HK96; (3) Kenyon et al. 1988; (4) Adams, Lada, & Shu 1987; (5) SBG06; (6) Quanz et al. 2006; (7) this work; (8) Zhu et al. 2008; (9) H08; (10) Elias 1978; (11) Herbig & Dahm 2002; (12) Herbig 1977; (13) Green et al. 2006; (14) Millan-Gabet et al. 2006; (15) Lorenzetti, D. et al. 2000; (16) Kenyon, Hartmann, & Kolotilov 1991