Probing fractal magnetic domains on multiple length scales in Nd2Fe14B
Abstract
Using small-angle neutron scattering, we demonstrate that the complex magnetic domain patterns at the surface of Nd2Fe14B, revealed by quantitative Kerr and Faraday microscopy, propagate into the bulk and exhibit structural features with dimensions down to 6 nm, the domain wall thickness. The observed fractal nature of the domain structures provide an explanation for the anomalous increase in the bulk magnetization of Nd2Fe14B below the spin-reorientation transition. These measurements open up a rich playground for studies of fractal structures in highly anisotropic, magnetic systems.
The industrial strength ferromagnet, Nd2Fe14B has become a prototypical system for the study of magnetic domain structures. Below the Curie temperature, = 565 KBuschow86 ; Herbst91 , the Nd and Fe moments order ferromagnetically. The crystal-electric field produces a strong magnetic anisotropy with the easy axis along the tetragonal direction. Below the spin-reorientation temperature, = 135 K, the magnetic structure (and easy axis direction) changes via a second order transitionPastushenkov02 and becomes cone-likeInaba88 , in which the moments are canted away from the direction by an angle that increases from 0 deg at to 28 deg at 4 KTokuhara85 ; Pastushenkov97 . The moments lie in one of the four symmetry-equivalent {1 1 0} planes in agreement with calculations of crystal-electric field effectsYamada88 . A multitude of techniques have been used to image magnetic domains at exposed surfaces of Nd2Fe14B, such as Bitter decorationCorner88 , Kerr microscopyPastushenkov02 ; Pastushenkov97 ; Szymczak87 ; Folks94 ; Hubert00 , LorentzLemke97 ; Zhu98 ; Shinba05 and holographicZhu98 ; Park04 transmission electron microscopy, scanning electron microscopyZhu98 ; Wang98 , and magnetic force microscopyLemke97 ; Gruetter88 ; Neu04 ; Szmaja06 ; AlKhafaji98 . For imaged surfaces perpendicular to the direction, domains have been observed with dimensions between 2-5 m at 4 KPastushenkov97 and about 0.1-0.6 m at room temperaturePastushenkov97 ; Folks94 ; Lemke97 , respectively. These values are very close to the single domain size of about 0.2-0.4 m determined by magnetization measurements on polycrystalline samplesBuschow86 ; Groenefeld90 .
These imaging techniques, however, only probe the magnetic fields at the surface and/or are limited in terms of the size of fine details that can be resolved. In the case of transmission electron microscopy, for example, samples thinner than 1 m are required and the domain structure can be very different from that of a bulk specimen. Thus, important questions regarding the size, distribution and morphology of magnetic domains in the bulk remain open. Here, we address these issues by correlating the results of magnetization measurements, magnetic domain imaging, and small-angle neutron scattering experiments on solution grown Nd2FeB single crystalsCanfield92 ; Canfield01 that manifest smooth, mirrored surfaces and can have volumes as large as 1 cm3.
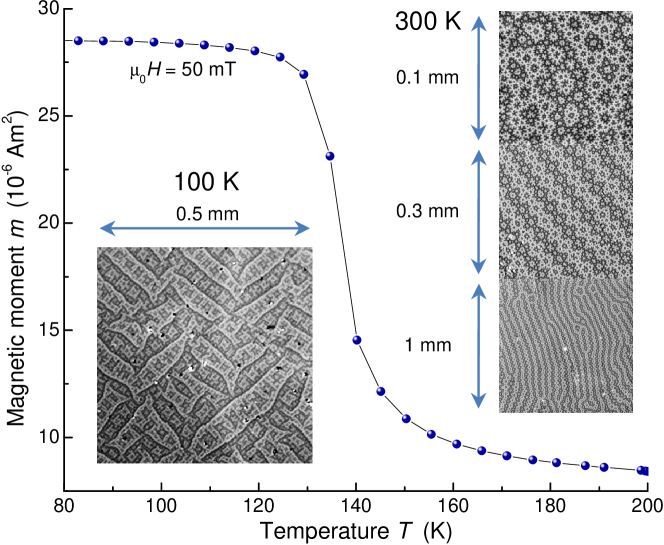
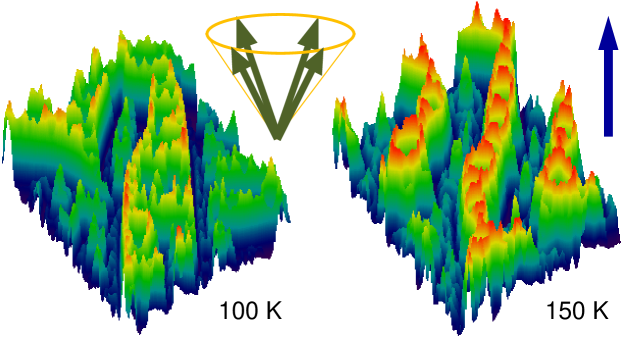
Single crystalline Nd2FeB shows a strong increase in magnetization along the direction below = 135 K, similar to what has been reported previouslyHerbst91 ; Tokuhara85 . As shown in Fig. 1, this behavior is correlated with a dramatic change of the magnetic domain patterns above and below as measured by the magneto-optical Kerr effect. In both the high and the low temperature states, the domains are arranged in chains in the () plane. However, the fine domains observed above evolve to much larger domains below . Above , the domains exhibit more isotropic star-like boundaries whereas, below , the domains are nearly rectangular in shape. The Faraday microscopy patterns, shown in Fig. 2, provide a spatially resolved measurement of the local magnetization along the direction. Above , higher values for the magnetic induction perpendicular to the surface in the inner parts of domains are observed, indicated by the red regions. This is consistent with the uniaxial alignment of moments along the direction, in contrast to the canted moments below for which only the moment projection along the direction contributes. This result appears to be in contradiction to the decreased bulk magnetization measured along the direction above . We show below that this arises from the details of the domain structure within the bulk of the Nd2FeB single crystal.
Figures 1 and 2 demonstrate clearly that domain features on many length scales can be detected at the surface of the sample. But do these features extend into the bulk? With a sufficiently large penetration depth and sensitivity to magnetic moments and magnetostrictive effects, neutrons are well suited to study this material using small-angle neutron scattering (SANS) methods. SANS measurements made with the incident neutron beam parallel to the axis of the sample yield a two-dimensional Fourier transform of magnetic and magnetostrictive correlations within the () plane of the sample, averaged over the thickness of the sample. Using well-established techniquesLindner92 , the average dimension and conformation of domains can be probed, and characteristic length scales of the magnetic induction variation can be extracted from the measurements. The minimum scattering vector of 0.5 Å-1, that can be realized by conventional SANS instruments, limits the dimension of detectable features to length scales smaller than 1 m, which is just at the limit of optical techniques.
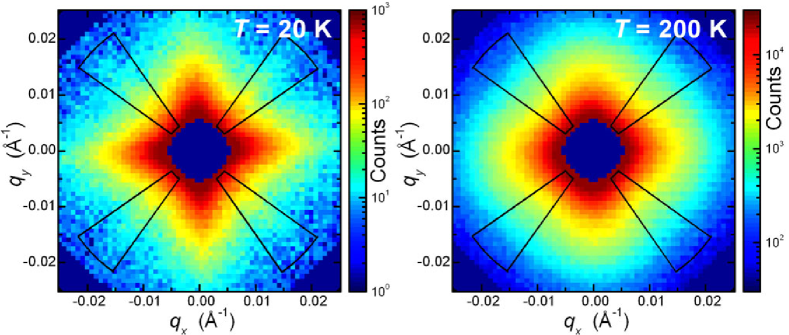
SANS experiments were performed on the D11 instrumentLindner92 , at the ILL, on a plate-like Nd2FeB sample with its direction oriented parallel to the incident neutrons. Fig. 3 shows the raw SANS area-detector images both above and below . Even a cursory comparison of the two images reveals significant differences. First, the pattern below exhibits significantly more anisotropy than that above which is consistent with the rectangular habit of magnetic domains for shown in the left panel of Fig. 1. By comparing the intensity scales in Fig. 3, it can be seen that the pattern at = 200 K ¿ , exhibits significantly enhanced scattering. This indicates a strong decrease in the average domain size above . Perhaps most importantly, since SANS probes the distribution of magnetic domains throughout the sample, these domain distributions are characteristic of the bulk of the 300 m thick sample, not only the exposed surface.
SANS patterns have been measured over a wide range of scattering vectors and the scattered intensity was determined as function of the magnitude of the scattering vector. The results are displayed in Fig. 4. Information regarding the formation of the magnetic domains can be obtained by fitting regions of the SANS data to a power-law behavior of the form . For details concerning the interpretation of power laws in SANS measurements, we refer the reader to several excellent reviews in Refs. Schmidt95 ; Mildner86 ; Schmidt89 ; Martin87 . Although we follow their treatments here, we note that much of the previous work in this area is based upon systems consisting of well defined “objects” with a finite homogeneous scattering strength embedded in a “matrix” with a different scattering strength. The situation for scattering from magnetic domains is somewhat different since the “objects” are the interior regions of domains with an identical and constant absolute value of the scattering strength that can be positive or negative depending on the direction of the local magnetization. The “surfaces” of these “objects” are the domain walls, with their own magnetic structure that varies across the domain wall width. Together, the domains and domain walls fill the complete volume of the sample, so no “matrix” in the sense used above exists.
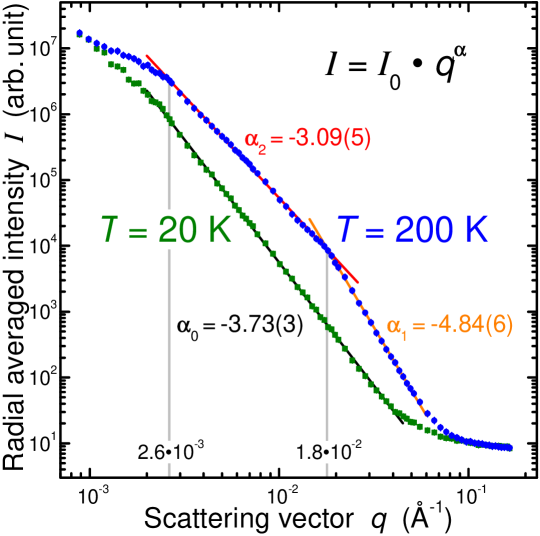
At = 20 K, the neutron scattering intensity shows a power-law dependence over a wide scattering-vector range with a single exponent from 2 Å-1 up to 3 Å-1. The value of is not far from = -4 which would be the expected exponent for scattering from a “smooth surface”, the so-called Porod scatteringSchmidt95 ; Mildner86 ; Schmidt89 ; Martin87 . A wrinkle-free, sharp domain wall is the corresponding picture in a magnetic system. Besides scattering from magnetic domains, neutrons can be refracted at domain walls due to the difference in the refraction index on both sides of the domain wall. This spreading of the incident beam can cause intensity for finite scattering vectors in SANS experiments and is strongly wavelength dependentSchaerpf78 ; Hoffmann07 . Contributions to the observed intensity can not completely excluded but measurements for scattering vectors between 2 Å-1 and 1 Å-1 using neutrons with wavelengths between 4 and 17 yield only marginal differences in the normalized intensity and deviations in of smaller than 0.2.
At = 200 K, we see dramatic changes in the intensity and shape of the scattering curves. The number of neutrons scattered in the range between 1 Å-1 up to 1 Å-1 is, on average, a factor of six higher at = 200 K than at = 20 K. A distinctive kink is obvious at 1.8 Å-1 in the curve for = 200 K in contrast to the smooth shape for = 20 K in the double-logarithmic plot in Fig. 4. Neutron refraction from an increased density of domain walls can yield an intensity increase but would not cause such a distinct kink. The range of scattering vectors corresponds to fine-scale features of domains from 0.1 m down to 0.001 m, well below the resolution limit of magneto-optical techniques, but close to the resolution limit of magnetic force microscopySzmaja06 ; AlKhafaji98 . These features are also significantly smaller than the domain sizes described by the branching phenomena in magnetic domainsSzymczak87 ; Hubert00 : for a 300 m thick Nd2Fe14B single crystal, the bulk domains, at half sample thickness, are expected to be 10 m wideSzymczak87 ; Hubert00 ; Kronmueller03 , whereas a width of 0.6 m was determined for the “spike” domains in near-surface regionsSzymczak87 ; Hubert00 ; Kronmueller03 . In addition to these coarse domain structures, a complicated system of fine-scale surface domains with the topology of curved stripes with widths of 0.02-0.25 m has also been observed by magnetic force microscopySzmaja06 ; AlKhafaji98 . Domain features on this length scale are consistent with the observed signal in the reported SANS measurement.
For a more detailed discussion of the SANS results at = 200 K, it is convenient to consider two distinct ranges denoted by the vertical lines in Fig. 4. For scattering vectors , the scattering describes the properties of the domain “surface”Schmidt95 ; Mildner86 . The observed value of = -4.84(6) in the power law is significantly different from = -4 for a sharp domain wall, with an abrupt change in the direction of the magnetizationSchmidt95 ; Mildner86 ; Schmidt89 ; Martin87 . It falls in the class, with characteristic of a “smooth pore boundary”Schmidt95 , in which the scattering strength changes continuously over some distance by a power law with the power . The value of = 0.42(3) corresponds roughly to a square-root dependence of the scattering strength in the “boundary”Schmidt95 , close to the sinusoidal dependence expected for Bloch or Néel domain walls. The lower limit for this observed power-law dependence is related to the width of the domain wallMildner86 and yields a value of order = 6 nm which is in excellent agreement with values of 4-9 nm determined by other methodsBuschow86 ; Corner88 ; Zhu98 ; Gruetter88 . The increased scattering evident at = 200 K in this region, indicates that a significantly larger volume fraction of the sample is found in domain walls above and provides an explanation for the reduced magnetization above since the domain walls should not, or only marginally, contribute to the magnetization of the sample. With a strong increase in the volume fraction of domain walls in the bulk of the sample, the total magnetization measured parallel to the axis is reduced above even though the moments are more closely aligned along the axis.
In the intermediate scattering vector range, , a power = -3.09(5) was obtained from the SANS data measured at = 200 K. The observation of a power law over a scattering vector range of one decade with an exponent close to -3 characterizes the scattering “objects” as fractalsSchmidt95 ; Mildner86 ; Schmidt89 ; Martin87 ; Fractal . Indeed, the fractal nature may be expected for magnetic domains as we move from the two-dimensional fine surface pattern observed by Faraday imagingHan02 toward the coarse three-dimensional bulk domain structures via the branching processHubert00 . However, the present SANS data characterize the fractal nature of magnetic domains on a submicron length scale in the bulk. Interestingly, an exponent of in the power law for the scattering data marks the boundary between two types of fractalsSchmidt95 ; Mildner86 ; Schmidt89 ; Martin87 , surface fractals with and volume fractals with . A surface fractal with close to -3 can be described as a self-affine “surface”, which is so strongly wrinkled, that it almost fills the three dimensional space. The corresponding picture for a volume fractal with is that, starting from a point in a self-affine “object”, one can find a minimum of one other point in a given maximum distance , which is not within the same “object”. The range for , over which this self-affinity can be found, corresponds to the scattering vector range in which the specific power law is observed. Regardless of the starting point, both descriptions yield the same picture. The strong neutron scattering intensity for the intermediate scattering vector range is related to magnetic domains in the bulk with self-affinity on a length scale from = 6 nm to roughly = 40 nm.
In summary, for the case of strong uniaxial anisotropy in Nd2Fe14B, we see that very fine magnetic domains occur at the surface and in the bulk with a self-affine geometry. Below the spin reorientation transition, the domain structure is much coarser, less wrinkled and the effective volume of domain walls is smaller. This leads to an apparent increase of the measured magnetization along the axis even though the local magnetization decreases. Small-angle neutron scattering is not only a valuable tool to characterize the conformation of magnetic domains and their domain walls, it also provides information regarding the topology of magnetic domain arrangements. Finally, we note that the magnetic properties and the corresponding magnetic domain patterns can be tuned by varying external parameters (e. g. temperature, pressure or applied magnetic field) as well as internal parameters (e. g. change of the magneto-crystalline anisotropy by substitution of different rare earths). These modifications can be isotropic or anisotropic providing a rich and almost unique opportunity for experimental studies of (magnetic) fractals.
The authors are indebted to Y. Janssen and S. Nandi for stimulating discussions. Work at the Ames Laboratory was supported by the Department of Energy, Basic Energy Sciences, under Contract No. DE AC02-07CH11358. A. Kreyssig acknowledges the support by Deutsche Forschungsgemeinschaft through SFB 463. R. Prozorov acknowledges support by the NSF Grant No. DMR 05-53285 and by the Alfred P. Sloan foundation.
References
- (1) K. H. J. Buschow, Mater. Sci. Rep. 1, 1 (1986).
- (2) J. F. Herbst, Rev. Mod. Phys. 63, 819 (1991).
- (3) Y. G. Pastushenkov, Z. Metallkd. 93, 991 (2002).
- (4) N. Inaba, H. Miyajima, S. Chikazumi, Jpn. J. Appl. Phys. 27, 947 (1988).
- (5) K. Tokuhara, Y. Ohtsu, F. Ono, O. Yamada, M. Sagawa, Y. Matsuura, Solid State Commun. 56, 333 (1985).
- (6) Y. G. Pastushenkov, A. Forkl, H. Kronmüller, J. Magn. Magn. Mater. 174, 278 (1997).
- (7) M. Yamada, H. Kato, H. Yamamoto, Y. Nakagawa, Phys. Rev. B 38, 620 (1988).
- (8) W. D. Corner, M. J. Hawton, J. Magn. Magn. Mater. 72, 59 (1988).
- (9) R. Szymczak, D. Givord, H. S. Li, Acta Phys. Pol. A 72, 113 (1987).
- (10) L. Folks, R. Street, R. C. Woodward, Appl. Phys. Lett. 65, 910 (1994).
- (11) A. Hubert, R. Schäfer, Magnetic Domains. The Analysis of Magnetic Microstructures (Springer-Verlag, Berlin, Germany, 2000) Ch. 3.7.5 and 5.2.1.
- (12) H. Lemke, T. Göddenhenrich, C. Heiden, G. Thomas, IEEE T. Magn. 33, 3865 (1997).
- (13) Y. Zhu, M. R. McCartney, J. Appl. Phys. 84, 3267 (1998).
- (14) Y. Shinba, T. J. Konno, K. Ishikawa, K. Hiraga, M. Sagawa, J. Appl. Phys. 97, 053504 (2005).
- (15) Y.-G. Park, D. Shindo, J. Electron Microsc. 53, 43 (2004).
- (16) J.-Y. Wang, L. H. Lewis, D. O. Welch, P. Canfield, Mater. Charact. 41, 201 (1998).
- (17) P. Grütter, E. Meyer, H. Heinzelmann, L. Rosenthaler, H.-R. Hidber, H.-J. Güntherodt, J. Vac. Sci. Technol. A 6, 279 (1988).
- (18) V. Neu, S. Melcher, U. Hannemann, S. Fähler, L. Schultz, Phys. Rev. B 70, 144418 (2004).
- (19) W. Szmaja, J. Magn. Magn. Mater. 301, 546 (2006).
- (20) M. Al-Khafaji, W. M. Rainforth, M. R. J. Gibbs, J. E. L. Bishop, H. A. Davies, J. Appl. Phys. 83, 6411 (1998).
- (21) M. Grönefeld, H. Kronmüller, J. Magn. Magn. Mater. 88, L267 (1990).
- (22) P. C. Canfield, Z. Fisk, Philos. Mag. B 65, 1117 (1992).
- (23) P. C. Canfield, I. R. Fisher, J. Cryst. Growth 225, 155 (2001).
- (24) P. Lindner, R. P. May, P. A. Timmins, Physica B 180-181, 967 (1992).
- (25) P. W. Schmidt. In: Brumberger, H. (Ed.) The Modern Aspects of Small-Angle Scattering. (Kluwer Academic Publishers, Dordrecht, Netherlands, 1995) pp. 1.
- (26) D. F. R. Mildner, P. L. Hall, J. Phys. D: Appl. Phys. 19, 1535 (1986).
- (27) P. W. Schmidt. In: Avnir, D. (Ed.) The Fractal Approach to Heterogeneous Chemistry. (John Wiley and Sons, Chichester, UK, 1989) Ch. 2.2.
- (28) J. E. Martin, A. J. Hurd, J. Appl. Cryst. 20, 61 (1987).
- (29) O. Schärpf, J. Appl. Chryst. 11, 626 & 631 (1978), and references therein.
- (30) A. Hoffmann, G. P. Felcher. In: Kronmüller, H., Parkin, S. (Ed.) Handbook of Magnetism and Advanced Magnetic Materials, Vol. 3. (John Wiley & Sons, Hoboken, NJ, USA, 2007).
- (31) H. Kronmüller, M. Fähnle, Micromagnetism and the Microstructure of Ferromagnetic Solids. (Cambridge Univ. Press, Cambridge, UK, 2003) Ch. 9.2.6.
- (32) A fractal object remains “similar” to itself after an isotropic change of scale or dilation. For “self-affine” objects, this dilation can be anisotropic with different scaling factors for different directions26.
- (33) B. S. Han, D. Li, D. J. Zheng, Y. Zhou, Phys. Rev. B 66, 014433 (2002).