NLS1 galaxies and estimation of their central black hole masses from the X-ray excess variance method
Abstract
Black hole mass determination in active galaxies is a key issue in understanding various luminosity states. In the present paper we try to generalise the mass determination method based on the X-ray excess variance, successfully used for typical broad line Seyfert 1 galaxies (BLS1) to Narrow Line Seyfert 1 (NLS1) galaxies. NLS1 galaxies differ from BLS1 with respect to several properties. They are generally more variable in 2-10 keV energy band so the natural expectation is the need to use a different scaling coefficient between the mass and the variance in these two types of sources. However, we find that such a simple approach is not enough. Although for majority of the 21 NLS1 galaxies in our sample a single scaling coefficient (larger by a factor 20) provided us with a satisfactory method of mass determination, in a small subset of NLS1 galaxies this approach failed. Variability of those objects appeared to be at the intermediate level between NLS1 and BLS1 galaxies. These exceptional NLS1 galaxies have much harder soft X-ray spectra than majority of NLS1 galaxies. We thus postulate that the division of Seyfert 1 galaxies into BLS1 and NLS1 according to the widths of the H line is less generic than according to the soft X-ray slope.
keywords:
galaxies:active - galaxies:Seyfert - X-rays:galaxies1 Introduction
Active Galactic Nuclei (AGN) are strongly variable in X-ray band. In a fixed time-scale quasars containing very massive black holes vary less than much less massive Seyfert galaxies so the X-ray variability was used to estimate the black hole mass (e.g. Hayashida et al. 1998; Lu & Yu 2001, Markowitz & Edelson 2004, Papadakis 2004). However, if we aim to have a mass determination method which works relatively accurately we must take into account that the black hole mass is not the only parameter of the accreting system. The second, important parameter is the dimensionless accretion rate which may affect the variability.
In the literature, the three possibilities were suggested for the exact scaling of the X-ray variability of an AGN with mass and the accretion rate.
The first and the oldest one is the claim that the variability scales only with the X-ray luminosity (Barr & Mushotzky 1986, Lawrence & Papadakis 1993, Green, McHardy & Lehto 1993, Nandra et al. 1997, Leighly 1999a, Markowitz & Edelson 2004). It was recently argued by Liu & Zhang (2008) at the basis of a sample of 14 objects with black hole mass obtained directly from reverberation that the mass itself does not affect the variations.
The second possibility is a continuous two-parameter relation between the X-ray variability and the black hole mass and the bolometric (not X-ray !) luminosity found by McHardy et al. (2006). About this idea see also papers of Markowitz et al. 2003, Bian & Zhao 2003, McHardy et al. 2005, O’Neill et al. 2005.
The third possibility is that there is no continuous scaling with accretion rate but instead there are two separate scaling laws with mass: one for Narrow Line Seyfert 1 (NLS1) galaxies and another one for Broad Line Seyfert 1 (BLS1) galaxies (Hayashida et al. 1998, Turner et al. 1999, Lu & Yu 2001, Uttley, McHardy & Papadakis 2002, Nikolajuk, Papadakis & Czerny 2004). This possibility is an interesting option since the two classes of objects differ considerably.
The Narrow Line Seyfert 1 (NLS1) galaxies were introduced as a separate class by Osterbrock & Pogge (1985). These objects had all properties in the optical band of the Seyfert 1 galaxies but their line widths were surprisingly narrow in comparison to typical Seyfert 1s. The original division of Seyfert galaxies, according to the width, into narrow and broad line objects (Seyfert 1 and Seyfert 2) seemed to be accompanied by the increase of the [O III]5007 to the H flux ratios (Shuder & Osterbrock 1981). However, a class of objects with narrow lines but faint [O III]5007 was found and a new class had to be introduces.
Till now the NLS1 as a class are defined by the requirement that the [O III]5007 to the H flux ratios are smaller than 3 and Full Width Half Maximum (FWHM) of H line in NLS1s was less than 2000 kms-1. Further observations revealed other peculiar properties. Blue wings of some emission lines were stronger compared to that in Seyfert 1s. Also the Fe II lines are more asymmetric and much stronger than in Seyfert 1s (Stephens 1989; Boroson & Green 1992; Boller et al. 1996; Wang et al. 1996; Leighly 1999b; Véron-Cetty & Véron 2000; Grupe et al. 2004). The Baldwin effect, which is common in BLS1s, was seen in those objects as well (e.g. Warner et al. 2004; Shields 2007). However, Leighly & Moore (2004) observed the UV lines and found that the Equivalent Widths of emission lines in NLS1s were systematically offset to lower values at a given continuum luminosity in comparison to BLS1 galaxies.
Further differences came from X-ray observations. NLS1s very frequently exhibit rapid and/or high-amplitude X-ray variability. They systematically show larger amplitude variations than BLS1 on time-scales of minutes, hours and days (Hayashida et al. 1998; Fiore et al. 1998; Leighly 1999a; Turner et al. 1999; Markowitz & Edelson 2004; Uttley & McHardy 2005). Giant-amplitude X-ray variability has been observed in several NLS1s (e.g. in NGC 4051 - Uttley et al. 1999; in PHL 1092 - Brandt et al. 1999). The X-ray spectra of NLS1s are generally steeper than spectra of BLS1s (Brandt, Mathur & Elvis 1997). The average photon index, in BLS1 in 2-10 keV band is (Nandra & Pounds 1994; Reynolds 1997), whereas NLS1 galaxies have (Leighly 1999a). Similar effect is in 17-100 keV band. The photons index in BLS1 galaxies is and in NLS1 (Malizia et al. 2008). The effect is much stronger in the soft X-ray band, 0.1-2.4 keV. The photon index, , of BLS1s varies around value 2.1-2.3 (Boller et al. 1996; Grupe et al. 1998; Pfefferkorn et al. 2001) but in NLS1s it is typically of order of 3.0-3.3, and occasionally even larger (Boller et al. 1996; Lawrence et al. 1997; Véron-Cetty et al. 2001; Williams et al. 2004; Bian 2005). More precisely, NLS1s may show both steep as well as flat X-ray spectra, while BLS1s always have flat spectra (Grupe et al. 1999). Generally, there is an overall anticorrelation between the soft photon spectral index and the Balmer line width FWHM(H) (Puchnarewicz et al. 1992; Boller et al. 1996; Brandt et al. 1997; Williams et al. 2004). Recently Zhou et al. (2006) have reexamined this relationship using larger sample of objects and concluded that the anticorrelation in NLS1s extends only to FWHM 1000 kms-1, and at smaller line widths the trend appears to reverse.
Interpretation of observational data suggests that NLS1s are Seyfert 1s, which have relatively low mass for a given luminosity and therefore radiate near the Eddington limit (Pounds et al. 1995; Hayashida 2000; Shrader & Titarchuk 2003; Botte et al. 2004); even super-Eddington accretion rates were suggested (Wang et al. 1996; Collin & Kawaguchi 2004; Zhang & Wang 2006). Estimated Eddington ratios as well as the spectral properties may indicate that NLS1s represent the supermassive BH analogue of Galactic BH (GBH) in their high states (Pounds et al. 1995; McHardy et al. 2004; Gierliński & Done 2006; Sobolewska & Done 2007). However, more research should be done to confirm — or reject — this view, and thus the black hole mass determination is one of the key issues.
In the present paper we determine the X-ray excess variance for a larger sample of 21 NLS1 galaxies and discuss the scaling properties in the combined sample of NLS1 and BLS1 objects.
2 Method
We select a sample of NLS1 galaxies based on the requirement that an object was well studied both in optical and X-ray band. Majority of the classical NLS1 sources have the low redshift values (z ) and low X-ray luminosities in 2-10 keV band. Additionally we add two BLS1s – dwarf active galaxies which are close to being Sy2. First object is the least luminous AGN known - NGC 4395, and the second object is also a low luminosity source, with jet, and with maser emission - NGC 4258. Table 1 shows our sample of 23 selected sources. Types, redshifts and coordinates of the galaxies were taken from a catalogue of quasars and active nuclei (Véron-Cetty & Véron, 2006).
We supplement it with the sample of BLS1 galaxies taken from Nikolajuk et al. 2006 (see Table 2).
| Name | z | Type | FWHM() | ref. | ref. | |||
|---|---|---|---|---|---|---|---|---|
| Mrk 335 | 0.026 | NLS1 | 2 | 1 | ||||
| I Zw 1 | 0.061 | NLS1/QSO | 1240 | 1 | 1 | |||
| TON S180 | 0.062 | NLS1/QSO | 2 | 1 | ||||
| PHL 1092 | 0.396 | NLS1/QSO | 1790 | 1 | 1 | |||
| 1H 0707-495 | 0.041 | NLS1 | 1050 | 1 | 1 | |||
| Mrk 110 | 0.036 | NLS1 | 2 | 9 | ||||
| Mrk 142 | 0.045 | NLS1 | 2 | 1 | ||||
| Mrk 42 | 0.025 | NLS1 | 670-865 | 3,4 | 8 | |||
| NGC 4051 | 0.002 | NLS1 | 2 | 1 | ||||
| NGC 4395 | 0.001 | BLS1/S1.8 | 1500 | 5 | ||||
| PG 1211+143 | 0.081 | NLS1/QSO | 2 | 1 | ||||
| Mrk 766 | 0.012 | NLS1 | 2 | 9 | ||||
| NGC 4258 | 0.001 | BLS1/S1.9 | 6 | |||||
| PG 1244+026 | 0.048 | NLS1 | 2 | 1 | ||||
| MCG -6-30-15 | 0.008 | NLS1 | 7 | 9 | ||||
| PG 1404+226 | 0.098 | NLS1 | 880-950 | 1,4 | 1 | |||
| NGC 5506 | 0.006 | NLS1/S2.0 | ||||||
| Mrk 478 | 0.079 | NLS1/QSO | 2 | 1 | ||||
| HB89 1557+272 | 0.065 | NLS1 | 1410 | 8 | 3 | |||
| IRAS 17020+4544 | 0.060 | NLS1 | 1040 | 1 | 1 | |||
| Mrk 507 | 0.056 | NLS1 | 960-1565 | 8,4 | 1 | |||
| IC 5063 | 0.011 | NLS1/S2.0 | ||||||
| Akn 564 | 0.025 | NLS1 | 720-950 | 8,1 | 1 |
Column (1)-(4) list the object name, coordinates and redshifts. Column (5) list types of the galaxies. NLS1 or BLS1 mean the overall type of the galaxy. QSO (in the second part, after /) denotes that this source is brighter in B colour than absolute magnitude -23 mag (). In other case of remaining NLS1s or BLS1s we have galaxies that are fainter than -23 mag. Columns (6) and (8) list the values of the FWHM of H (broad component) in kms-1 and the values of the soft photon index, , respectively. Both values were taken from literature. For NGC 4258, the sign denotes FWHM of polarized H. The sign in Column (8) denotes that (above 1 keV) varies significantly on time-scales of 1 year or less ( 0.6-1.72; Moran et al. 2005). The indicates that the nuclear component is visible above 2 keV only (Fiore et al. 2001). The numbers in Column (7) and (9) correspond to the following references: 1 - Leighly (1999b), 2 - Grupe et al. (2004), 3 - Bian & Zhao (2003), 4 - Wang & Lu (2001), 5 - Kraemer et al. (1999), 6 - Barth et al. (1999), 7 - Nandra (2006), 8 - Boller et al. (1996), 9 - Walter & Fink (1993).
| Name | FWHM() | ref. | ref. | |
|---|---|---|---|---|
| 3C 120 | 1 | |||
| 3C 390.3 | 2 | 3 | ||
| Ark 120 | 2 | 3 | ||
| IC 4329A | 1 | 3 | ||
| Mrk 509 | 1 | 3 | ||
| NGC 3227 | 2 | |||
| NGC 3516 | 1 | |||
| NGC 3783 | 1 | 3 | ||
| NGC 4151 | 2 | |||
| NGC 4593 | 1 | 3 | ||
| NGC 5548 | 1 | 3 | ||
| NGC 7469 | 1 | 3 | ||
| F 9 | 1 | 3 |
Column (1) list the object name. Columns (2) and (4) list the values of the FWHM of H (broad component) in kms-1 and the values of the soft photon index, , respectively. The numbers in Columns (3) and (5) correspond to the following references: 1 - Nandra (2006), 2 - Peterson et al. (2004), 3 - Walter & Fink (1993).
2.1 Black hole mass from method based on optical observations
The estimation of the black hole masses is difficult. Several methods were developed for that purpose. We tried to collect the black hole mass determinations for our sample in possibly consistent way.
The most precise method to determine is based on water maser emission and the black hole mass from this method was used for NGC 4258.
Most of the sources were subject of AGN monitoring campaign so the reverberation method could have been used (e.g. Blandford & McKee 1982; Peterson & Wandel 1999, 2000; Vestergaard 2002). This technique assumes that the motion of the gas moving around the black hole is dominated by the gravitational force and therefore the gaseous clouds in Broad Line Region (BLR) are virialized. Hence the central black hole mass can be estimated using the BLR radius, , and velocity of the BLR gas, : , where G is the gravitational constant. The radius can be estimated from observations of a light travel time . One can assume that an optical/UV continuum, which is produced in an accretion disc, photoionises BLR clouds and leads to formation of emission lines (e.g. H). The continuum varies in time and therefore the lines in BLR also vary but they respond with a delay . The value of can be thus interpreted as a light travel distance . Such an approach to estimations of distance is accurate, and it is later referred as ’reverberation method’. However, it requires a long observational campaign, which are time consuming. In order to save that time, the radius can be estimated from the empirical relationship between the size and the monochromatic luminosity at 5100Å (Kaspi et al. 2000):
| (1) |
Such approach is called ’scaling method’ and it was used by many scientist (Wandel 1999; Kaspi et al. 2000, 2005; Bentz et al. 2006; McGill et al. 2008). As to the velocity dispersion, it can be expressed as FWHM, where FWHM is the width of e.g. H line and the geometrical factor depends on the geometry and the details of the gas kinematics in BLR (Krolik 2001; McLure & Dunlop 2001; Collin et al. 2006). Many authors assume the isotropy of the gas motions in BLR. In such case the factor is equal to (Netzer 1990, Kaspi et al. 2000) and the velocity can be written as FWHM(H). Onken et al. (2004) determined new value of the factor . They have used the correlation between the black hole mass and the stellar velocity dispersion in bulge mainly in BLS1 galaxies. They found out . Such value of was adopted by Peterson et al. (2004) and Peterson et al. (2005) in the estimation of BH masses in the reverberation method. We adopt those mass measurements when available (i.e. for sources Mrk 335, Mrk 110, NGC 4051, NGC 4395 and PG1212+143). Several other objects (I Zw1, TON S180, PHL 1092, 1H 0707, Mrk 142, Mrk 42, Mrk 766, PG 1244, MCG -6-30-15, PG 1404, Mrk 478, IRAS 17020, Mrk 507, Ark 564) had mass determination based on the old coefficient used by Kaspi and those masses were corrected for the two coefficients ratio, i.e. by the factor in order to obtain values. The original values and the rescaled values are both given in Table 3. When we have a choice between the black hole masses from Wang & Lu (2001) or Bian & Zhao (2003) (both masses estimated through the scaling method based on relationship between BLR radius and optical luminosity at 5100 Å) we have decided to take from the later paper. We believe that masses estimated in 2003 are determined more precisely that in 2001.
For two objects (NGC 5506 and in IC 5063) the black hole mass was estimated from stellar velocity dispersion, and the determination of the mass for HB89 1557+272 is outlined below.
All mass values and the references are collected in Table 3.
| Name | ref./ | ||
| () | () | meth. | |
| Mrk 335 | 1/r | ||
| I Zw 1 | 2/s | ||
| TON S180 | - | 21.3-22.5 | 3,5/s |
| PHL 1092 | 4/s | ||
| 1H 0707+495 | 3.74 | 5/s | |
| Mrk 110 | 1/r | ||
| Mrk 142 | 4.7 | 8.62 | 3/s |
| Mrk 42 | - | - | 5,3/s |
| NGC 4051 | 1/r | ||
| NGC 4395 | 6/r | ||
| PG 1211+143 | 1/r | ||
| Mrk 766 | - | - | 5,3/s |
| NGC 4258 | 7/m | ||
| PG 1244+026 | 1.3 | 2.38 | 3/s |
| MCG -6-30-15 | 5/s | ||
| PG 1404+226 | - | - | 5,3/s |
| NGC 5506 | 8/d | ||
| Mrk 478 | - | - | 3,5/s |
| HB89 1557+272 | 4.17 | ||
| IRAS 17020+45 | 5.9 | 10.8 | 3/s |
| Mrk 507 | 11.6 | 21.3 | 3/s |
| IC 5063 | 55 | 9/d | |
| Ark 564 | - | - | 5,3/s |
Column (1) lists the object name. Column (2) shows the masses of black holes obtained by using the scaling method (based on relationship between BLR radius and optical luminosity). Those values have been corrected by us and shown in Column (3) (see text). Column (3) also lists values of those sources for which masses were obtained from other methods (see the letter in Column (4)). In case of HB89 1557+272 their was calculated (see text for details). Values were taken for further analysis. The numbers in Column (4) correspond to the following references: 1 - Peterson et al. (2004), 2 - Vestergaard (2002), 3 - Wang & Lu (2001), 4 - Dasgupta et al. (2004), 5 - Bian & Zhao (2003), 6 - Peterson et al. (2005), 7 - Herrnstein et al. (1998), 8 - Papadakis (2004) 9 - Woo & Urry (2002). The letter in Column (4) shows the method of estimations of : ’r’ - the reverberation mapping technique, ’s’ - the scaling method, ’d’ - stellar velocity dispersion, ’m’ - maser).
2.1.1 The case of HB89 1557+272
No black hole mass estimate for HB89 1557+272 can be found in the literature, and the object was not monitored. Therefore, we obtain a simple order of magnitude estimate in a following way. From Malkan, Margon & Chanan (1984) we take the total bulge magnitude in r (6650Å; defined by e.g. Thuan & Gunn 1976) colour. This value is equal to 17.05. Then we convert this luminosity to the bulge magnitude in B (4400Å) colour. For this purpose, we assume that the bulge spectrum in HB89 1557+272 is the same as in M31. Using it (see Wamsteker et al. 1990) we obtain the ratio . We convert into based on this information and formulas from Zombeck (1990). We obtain that mag. In the third step, we calculate . Due to small redshift of this object (z=0.064625) we assume that in our universe the cosmological constant . The Hubble constant and the deceleration parameter are = 75 km s-1 Mpc-1 and , respectively. Under those conditions we obtain the bulge luminosity in the B colour erg s-1. Kormedy & Gebhardt (2001) have presented the correlation between and :
| (2) |
where denotes the Sun luminosity in B band111 erg s-1. Hence the black hole mass obtained from the formula is equal to . Kormedy & Gebhardt’s relationship is worth only for normal galaxies and BLS1. Véron-Cetty & Véron (2006) classify HB89 1557+272 as ordinary NLS1 sources, because it luminosity in B band is low. However, Malkan et al. (1984), Hutching et al. (1984) or NED222NASA/IPAC Extragalactic Database classify this object as quasar with the narrow emission lines. We assume the narrow line type of HB89 1557+272 and have to correct obtained in order to estimate true value of it. Mathur, Kuraszkiewicz & Czerny (2001) have mentioned that the BH to bulge mass ratio for NLS1 galaxies is of order of 0.00005 and 0.0005 for NL quasars. For Wandel’s (1999) sample of galaxies this ratio / = 0.0003 for BLS1 and 0.006 for normal galaxies and quasars. We adopt those values in our analysis. If we assume that (i) the bulge masses in NLS1 and BLS1 galaxies are the same (), (ii) the BH masses in NLS1s are simultaneously smaller than in BLS1s (), and (iii) there is only a systematic shift in equation (2) between those two kinds of Seyfert 1 galaxies, we obtain that and . Therefore, we should divide the value by 6 in the case if HB89 1557+272 would be NLS1 and by 12 if the galaxy would be NL quasars. We choose the last one factor and the BH mass in HB89 1557+272 is = . We adopted this value in our further analysis (Table 3). We must note here that the value of calculated by us has a large error and may be underestimated.
2.2 Determination of the X-ray excess variance
We determine the X-ray excess variance for the sources in our sample using the approach which was developed by Nikolajuk et al. (2004) with the aim to use for mass determination in BLS1 galaxies. The approach is based on the use of only the high frequency tail of the power spectrum and on the specific way of combining results for several lightcurves for a given source.
Each AGN emit a variable X-ray radiation observed in the hard (2-10 keV) band. From such lightcurve we can calculate the normalized excess variance which is defined as (e.g. Nandra et al. 1997; Turner et al. 1999):
| (3) |
Here, is the number of data points, and are the flux and its error, respectively. is the unweighted, arithmetic mean of . is in units of (rms/mean)2. The important value is not the excess variance itself but actually the ratio of the excess variance to the duration of the lightcurve since the power spectrum has the slope at high frequencies. This is clearly seen from the formula used to calculate for BLS1 galaxies:
| (4) |
where is the duration of the X-ray lightcurve (in seconds), is its bin size (in seconds) and is the constant. The requirement of the method is that the excess variance is measured at the high frequency tail of the power spectrum, i.e. that the length of a single lightcurve, , is significantly shorter than the inverse of the high frequency break of the power spectrum, (i.e. ). The same condition is important for any scaling relations so we follow it here. We would like to emphasise here that we need not to know exact value of . We chose based on information that our should be shorter than break time, . This time, which is simply equal to inversion of (i.e. = ), is shown in Table 4. In case of those NLS1 sources, for which we do not have any information about , we estimate this time in following way. We use the relationship between the black hole mass and the break frequency in BLS1 galaxies () Hz) derived by Papadakis (2004). In our calculations we assume . The break frequencies in NLS1s are higher by a factor 10-30 than in BLS1 sources (e.g. Papadakis 2004). Therefore, we multiply Papadakis’ relationship by a factor , i.e. our estimated s. Generally, the value is equal to 30. Sometimes the calculated excess variance had been less than zero and in those cases we decreased in order to obtain longer . We have decreased from 30, unless the values of become positive, but still . We choose now .
| Object | (ref.) | Proposal | Mean | |
|---|---|---|---|---|
| name | [ks] | details | [cnts/s] | |
| Mrk 335 | A/71010000 | 0.398 | 6 | |
| I Zw 1 | A/73042000 | 0.149 | 4 | |
| TON S180 | A/77036000 | 0.313 | 34 | |
| PHL 1092 | A/75042000 | 0.029 | 4 | |
| 1H 0707+495 | A/73043000 | 0.070 | 7 | |
| Mrk 110 | A/73091000 | 0.793 | 3 | |
| Mrk 142 | A/76034000 | 0.120 | 4 | |
| A/76034010 | 0.097 | 2 | ||
| Mrk 42 | A/75056000 | 0.041 | 4 | |
| NGC 4051 | (1) | R/P70141 | 2.302 | 10 |
| R/P70142 | 2.198 | 1 | ||
| NGC 4395 | - (2) | A/78009000 | 0.098 | 8 |
| A/78009001 | 0.105 | 21 | ||
| A/78009002 | 0.080 | 9 | ||
| A/78009003 | 0.067 | 9 | ||
| PG 1211+143 | A/70025000 | 0.171 | 3 | |
| Mrk 766 | (3) | A/71046000 | 0.469 | 10 |
| NGC 4258 | (4) | A/60018000 | 0.121 | 1 |
| A/64001000 | 0.176 | 1 | ||
| A/64001010 | 0.185 | 1 | ||
| A/77031000 | 0.117 | 8 | ||
| PG 1244+026 | A/74070000 | 0.162 | 8 | |
| MCG -6-30-15 | (5) | R/P10299 | 4.594 | 1 |
| R/P20310 | 4.119 | 20 | ||
| R/P40155 | 4.346 | 8 | ||
| A/70016300 | 1.221 | 3 | ||
| A/77003000 | 0.672 | 35 | ||
| PG 1404+226 | A/72021000 | 0.020 | 2 | |
| NGC 5506 | (6) | R/P20318 | 8.563 | 12 |
| Mrk 478 | A/73067000 | 0.109 | 5 | |
| HB89 1557+272 | A/81004000 | 1.624 | 4 | |
| A/81005000 | 0.559 | 6 | ||
| IRAS 17020+45 | A/73047000 | 0.303 | 11 | |
| Mrk 507 | A/74033000 | 0.042 | 1 | |
| IC 5063 | R/P10337 | 0.988 | 1 | |
| A/71030010 | 0.124 | 1 | ||
| Ark 564 | (7) | R/P10291 | 2.035 | 19 |
Column (1) lists the object name. Column (2) shows the power spectral density (PSD) break time-scales, which are connected with the frequency break (=1/). The number in parentheses correspond to the following references: (1) McHardy et al. (2004); (2) Vaughan et al. (2005); (3) Vaughan & Fabian (2003); (4) Markowitz & Uttley (2005); (5) McHardy et al. (2005); (6) Uttley & McHardy (2005); (7) Papadakis et al. (2002). Column (3) shows the observation details. The first letter refers to the satellite name (A – ASCA, R – RXTE), the number refers to proposal number. In Column (4) are shown the mean fluxes observed in the lightcurve (in count per second units). Column (5) lists the number of short lightcurves, , subtracted from whole proposal lightcurve. also means the number of the values ()k, which were used in order to estimate .
| Name | |||
| [s] | |||
| Mrk 335 | 2396 | 43.07 (a) | |
| I Zw 1 | 2270 | 43.35 (a) | |
| TON S180 | 7842 | 43.58 (a) | |
| PHL 1092 | 11584 | 44.15 (b) | |
| 1H 0707+495 | 7696 | 42.49 (b) | |
| Mrk 110 | 2632 | 43.80 (c) | |
| Mrk 142 | 7510 | 43.17 (a) | |
| Mrk 42 | 8162 | 42.12 (b) | |
| NGC 4051 | 1500 | 41.21 (a) | |
| NGC 4395 | 2100 | 39.99 (a) | |
| PG 1211+143 | 7967 | 43.63 (b) | |
| Mrk 766 | 2460 | 42.73 (a) | |
| NGC 4258 | 31300 | 40.52 (d) | |
| PG 1244+026 | 1200 | 43.03 (a) | |
| MCG -6-30-15 | 8408 | 42.72 (a) | |
| PG 1404+226 | 7382 | 43.03 (b) | |
| NGC 5506 | 8015 | 42.73 (a) | |
| Mrk 478 | 11153 | 43.50 (a) | |
| HB89 1557+272 | 2354 | ||
| IRAS 17020+45 | 1782 | ||
| Mrk 507 | 14126 | 43.62 (b) | |
| IC 5063 | 32205 | 42.87 (e) | |
| Ark 564 | 888 | 43.38 (a) | |
| 3C 120 | 30600 | 43.95 (d) | |
| 3C 390.3 | 437915 | 44.00 (d) | |
| Ark 120 | 237600 | 43.88 (a) | |
| IC 4329A | 13510 | 43.59 (a) | |
| Mrk 509 | 26990 | 44.03 (a) | |
| NGC 3227 | 319200 | 41.66 (a) | |
| NGC 3516 | 92475 | 43.08 (a) | |
| NGC 3783 | 29770 | 42.90 (a) | |
| NGC 4151 | 102700 | 42.62 (a) | |
| NGC 4593 | 27140 | 42.98 (a) | |
| NGC 5548 | 34000 | 43.41 (a) | |
| NGC 7469 | 127400 | 43.25 (a) | |
| F 9 | 40000 | 43.91 (a) | |
| F 303 | 39936 | 43.03 (a) | |
| PG 0026+129 | 39936 | 44.53 (a) | |
| Mrk 586 | 39936 | 44.07 (a) | |
| Mrk 1040 | 39936 | 42.40 (a) | |
| NGC 985 | 39936 | 43.50 (a) | |
| Mrk 279 | 39936 | 43.66 (a) | |
| Mrk 841 | 39936 | 43.54 (a) | |
| Mrk 290 | 39936 | 43.22 (a) |
First part of this table concerns the values of sources considered in this paper. Second part shows the values obtained for BLS1 galaxies (sample taken from Nikolajuk et al. 2006). Galaxies and their appropriate values shown in third part are taken from O’Neill et al. 2005. Those all objects and several galaxies from part one and two have been considered by Liu & Zhang (2008) in their analysis. Column (1) lists the object name. Column (2) shows the arithmetic mean time of observations. Col (3) gives the normalized excess variance with errors. Those values have been calculated taking mean and as the product of those two quantities (see equation 6). The errors have been obtained from Monte Carlo simulations of (see text). Column (4) shows logarithm of the luminosity in the 2-10 keV band. The cosmology is and . References in this column: (a) - O’Neill et al. 2005, (b) - Vaughan et al. 1999, (c) - George et al. (2000), (d) - Merloni et al. 2003, (e) - Bassani et al. (1999).
More accurate mass determination can be obtained if more measurements are available for a given source. If a single but long observation is available, it can be split into several parts. Instead of direct computation of an average excess variance we use a procedure which allows for different duration of the lightcurve parts and higher determination accuracy. The separate measurements are combined in the following way: (i) we obtain the th individual ratios:
| (5) |
(ii) we fit this set of the individual and calculate the mean value of as weighted mean from the minimum chi-square fit, in order to estimate the final value of the X-ray excess variance
| (6) |
where is the mean duration of a single lightcurve. The value of was also used to calculate the black hole mass from the excess variance (Nikołajuk et al. 2006)
| (7) |
Gierliński et al. (2008) have shown that the method applies very well to galactic sources at their hard states and to Seyfert 1 galaxies, and the proportionality constant, , does not depend on the source luminosity state.
The value of the scaling constant was determined to be s-1 (Nikolajuk et al. 2004), if based on the black hole mass of Cyg X-1 equal to 10 (e.g. Orosz 2003, Herrero et al. 1995; Nowak et al. 1999; Gierliński et al. 1999). Nikolajuk et al. (2006) obtained s-1, again based on Cyg X-1 scaling but taking the Cyg X-1 mass of after Ziółkowski (2005). Recent study of several galactic sources by Gierliński et al. (2008) gave the value 333Note the difference in the definition of the constant C between the present paper and Gierliński et al. which leads to a difference in units but not in the numerical value: , where Hz. Hence, the numerical value of the coefficients are the same in units s-1 and Hz-1.. In the present paper we adopt the value of 1.92 from Nikołajuk et al. (2006) for better consistency with the previous study of BLS1 galaxies.
As it was mentioned by Nikolajuk et al. (2006), the accuracy of the excess variance and determination depend on the effect of statistical error of variance measurement and power leaking from long time-scales. The errors are estimated by performing Monte Carlo simulations for each source separately. The simulation generated a few hundred sets of artificial data. From each lightcurve of one set was calculated ()k, the coefficient and, based on the least squares method, the . Finally, the 90% error of was calculated due to having a distribution of the hundreds values of them. The mass error was determined from the error of .
| Name | ||||
|---|---|---|---|---|
| () | () | |||
| Mrk 335 | 14.2 | |||
| I Zw 1 | 33.4 | |||
| TON S180 | 22.5 | |||
| PHL 1092 | 293 | |||
| 1H 0707+495 | 3.74 | |||
| Mrk 110 | 25.1 | |||
| Mrk 142 | 8.62 | |||
| Mrk 42 | 0.73 | |||
| NGC 4051 | 1.91 | |||
| NGC 4395 | 0.36 | |||
| PG 1211+143 | 146 | |||
| Mrk 766 | 1.52 | |||
| NGC 4258 | 39.0 | |||
| PG 1244+026 | 2.38 | |||
| MCG -6-30-15 | 2.84 | |||
| PG 1404+226 | 12.1 | |||
| NGC 5506 | 88.0 | |||
| Mrk 478 | 40.2 | |||
| HB89 1557+272 | 4.17 | |||
| IRAS 17020+45 | 10.8 | |||
| Mrk 507 | 21.3 | |||
| IC 5063 | 55.0 | |||
| Ark 564 | 2.20 |
Column (1) lists the object name. Column (2) shows the masses of black holes without errors taken from Table 3. Column (3) shows the black holes masses obtained from the variance method. The ratios of the two masses are given in Column (4).
3 Results
Since NLS1 galaxies are known to be relatively more variable than BLS1 galaxies (e.g. Hayashida 2000, Czerny et al. 2001; McHardy et al. 2004; Papadakis 2004), we do not expect the standard X-ray excess variance method of mass measurement, with the same value of the constant C, to work for these objects.
Instead, we search here for the discrepancies between variability based method and other methods of mass measurements, and we analyse the dependence of these discrepancies on the source properties.
The details on the lightcurves analysed for the purpose of this work are given in Table 4 and the values of the X-ray excess variance for a whole sample of both NLS1 and BLS1 galaxies are given in Table 5.
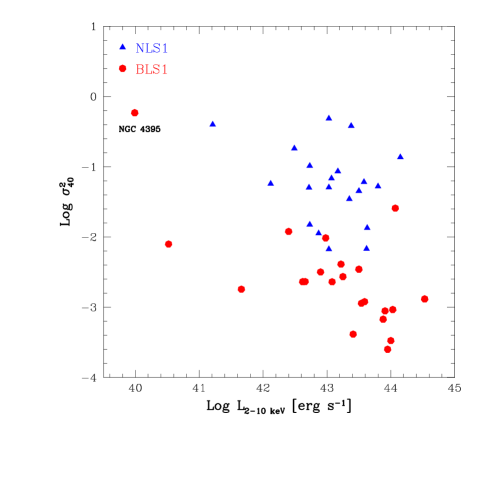
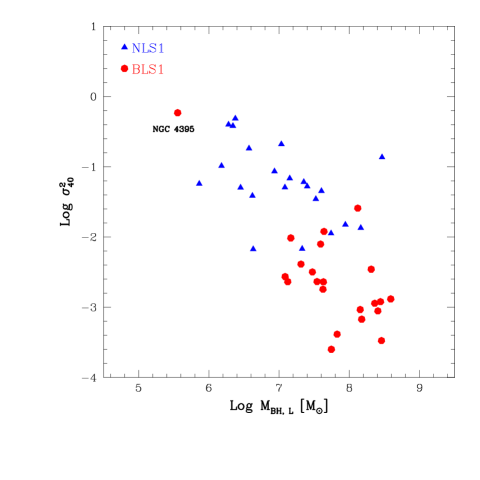
We first check single parameter relations between the X-ray excess variance and the black hole mass (taken from optical determination) and the X-ray luminosity. We renormalize the excess variance to the value expected for the duration of the lightcurve equal to 40 000 s, i.e. . The results are plotted in Figs. 1 and 2.
There is much better correlation with mass than with luminosity in the whole combined sample of NLS1 and BLS1 galaxies (correlation coefficient equal to -0.69 and -0.39 correspondingly). However, the correlation with the luminosity is basically driven by the BLS1 objects. If only NLS1 are selected, the correlation of the excess variance with the black hole mass is stronger than with the X-ray luminosity (-0.44 and -0.27 correspondingly).
The correlation with the mass suggest that the X-ray excess variance can possibly be used for mass determination in NLS1 galaxies. We therefore calculate the masses of the black holes in our sample using the equation (7).
The values of the black hole masses derived from the standard excess variance, , the values of the masses based on other methods (reverberation, stellar velocity dispersion, etc), , and the ratio of the two values for each source in our sample of NLS1 galaxies, , are given in Table 6.
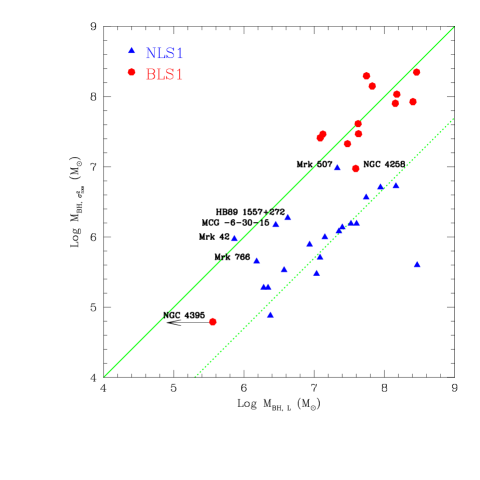
In Fig. 3 we show the plot of the mass from variability vs. mass from the literature for our sample of galaxies and for BLS1 galaxies from Nikolajuk et al. (2006). The BLS1 sources cluster along the continuous line marking the ratio 1. Apart from two sources, the value of for all objects is within the limits 0.3 - 3. The source with the smallest mass, NGC 4395 is shifted from the line ( for this source). We have to note that our obtained value () is similar to other values obtained from other methods based on X-ray variability: (Vaughan et al. 2005; method); - (Shih et al. 2003; method). Other black hole mass determinations for this source also gave lower values than the direct reverberation (photoionization, Kraemer et al. 1999; scaling with luminosity, Filippenko & Ho 2003) have mentioned in NGC 4395 of order of - . In such case the ratio would be equal to 0.6-1.61, respectively. On the other hand, the upper limit from stellar dispersion velocity in the central 3.9 pc (, Filippenko & Ho 2003) is still consistent with the reverberation value. In the case of NGC 4258 the BH mass is estimated precisely from maser emission method. Our determination gives the upper limit of and hence the lower limit of , so the agreement is not quite satisfactory.
The NLS1 sources show larger dispersion than BLS1 sources. Most of them cluster along the dotted line, marking the ratio of 20. This simply reflects the fact that in both plots of (Figs. 1 and 2) the NLS1 objects lie on average higher, as expected.
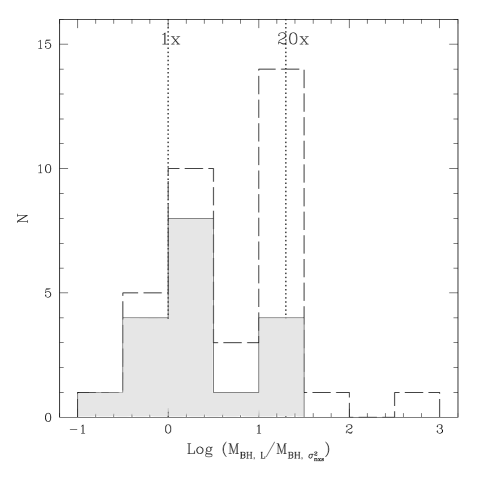
The existence of two characteristic values of the ratio is already suggested by Fig. 3 but it is seen more clearly from the direct plot of the mass ratio. In Fig. 4 we present the results on the variability level in our sample in a form of two histograms showing the number of sources in a particular bin of the and mass ratio. First histogram (drawn by long-dashed line) considers all objects in our sample of NLS1 and BLS1 galaxies. Second histogram (drawn by continuous line and shaded) shows galaxies which are taken from the reverberation or the maser method (for NGC 4258) only. Both histograms are similar. The distributions show two separate peaks, one close to unity, and one close to the factor 20. BLS1 galaxies occupy the first peak while most of NLS1 galaxies make the second one.
Our data come from two different instruments (ASCA and Rossi-XTE; see Table 4) which cover slightly different energy range we checked whether this may have a strong impact onto our results. For MCG -6-30-15 we had both ASCA and Rossi-XTE data, so we calculated the X-ray excess variance for this source independently from both instruments. The ASCA variance was by a factor 1.957 higher than Rossi-XTE variance which is consistent with ASCA being sensitive in softer energy band and with the general trend of lower normalization of the power spectrum in higher energies (e.g. Uttley & McHardy 2005). We then made an experiment and multiplied all variance values from Rossi-XTE by this factor and replotted the histogram. It still did not change and showed apparent bimodality.
However, there exists a small subset of our NLS1 sources which does not require that multiplication and the value of is the same like in BLS1 cases (MCG -6-30-15, Mrk 42, Mrk 507, Mrk 766 and quasar HB89 1557+272).
Since the behaviour of this small subset of NLS1 is puzzling and may help to understand the origin of the variability we analyse the possible cause of this behaviour.
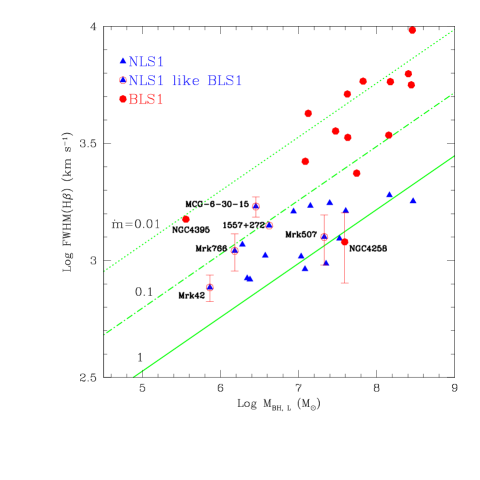
The location of these slowly variable NLS1 on the FWHM(H) versus the mass diagram is shown in Fig. 5. The errors are large but the sources do not seem to be located differently from the other NLS1 objects. In Fig. 5 we also indicate the lines corresponding to the fixed dimensionless accretion rate, or the Eddington ratio, . We have calculated using equation taken from Czerny, Różańska & Kuraszkiewicz (2004): , where is constant. They derived this formula using Kaspi et al. (2000) relationship for and assuming the geometrical factor . We have corrected Czerny et al. formula by taking new estimated by Bentz et al. (2007) relationship and assuming . Therefore, the corrected formula using by us in this paper is:
| (8) |
In Fig. 5 the division into BLS1 and NLS1 objects corresponds roughly to the division into and for a black hole. For other values black hole masses the exact classification according to the spectra (NLS1 versus BLS1) and according to the Eddington ratio do not overlap. The issue of the usefulness of the current definition of NLS1 was already raised by Mathur & Grupe (2005a,b) in the context of comparison of optically-selected and X-ray selected NLS1.
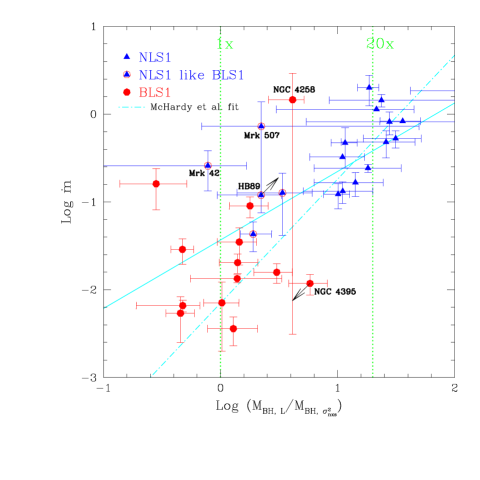
In Fig. 6 the NLS1 objects which have slower variability than most NLS1s are naturally located at the mass ratio , but their Eddington ratios span rather wide range. This may be related to relatively large errors for a single object.
The formula used by us derives the value of the dimensionless accretion rate partially from the black hole mass, and relies on the scaling of the Broad Line region so it is not independent from the mass ratio in the statistical sense. Therefore, the result may be biased by the underlying correlation. However, at present this is the simplest way to see the trend with the Eddington ratio. We will discuss Fig. 6 again in Sect. 3.1.
In order to gain additional insight which may not be biased by determination of , we consider the dependence of the variability on the soft X-ray slope.
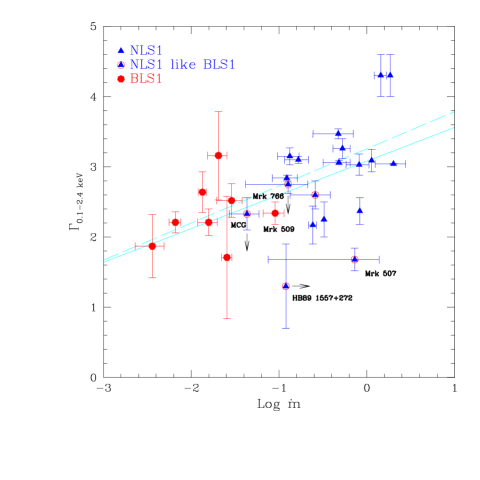
The spectral slope in 0.1-2.4 keV range in our sample generally correlates with the dimensionless accretion rate (see Fig. 7). For two slowly variable NLS1 the X-ray slope is flatter than expected from the overall correlation while for other three sources are close to the best fit line. The continuous line represents our best fit to our sample (correlation coefficient of this fit is 0.515): log . The long-dash line shows fit to the same sample but without the subset NLS1 like BLS1 galaxies. This fit is log with correlation coefficient 0.650.
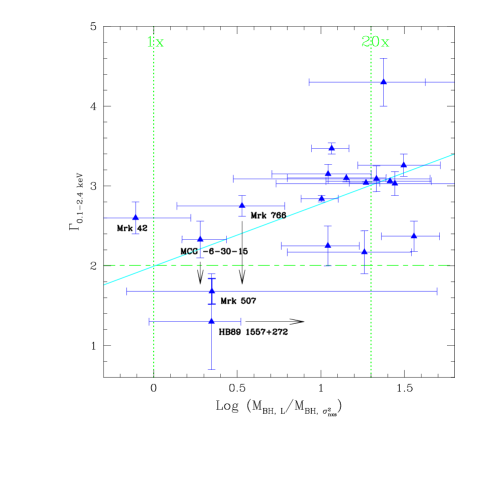
Now we present the relation between the soft X-ray slope and the mass ratios for our sample of NLS1 galaxies (see Fig. 8). A strong trend with a soft X-ray slope is seen again. Since the measurement of the soft X-ray slope is more direct than the estimate of the accretion rate or bolometric luminosity, this result indeed supports the claim of McHardy et al. (2006) that the black hole mass alone does not determine the variability properties if we include objects with steep soft X-ray spectra into our sample. The change of variability properties with the change of the spectral slope is not surprising, since the underlying mechanism may be different as well.
If indeed there are two separate mechanisms of the hot plasma formation, separate for soft spectra and separate for hard X-ray power law, then the dependence of variability level on the sources properties may be rather bimodal, reflecting a rapid state transition, instead of showing a continuous dependence on the Eddington ratio, as proposed by McHardy et al.
Our sample may not still be large but at present the distribution looks rather bimodal, with sources concentrating around the ratios and instead of continuously covering the whole diagram between some minimum and maximum values, as it would be expected from a continuous dependence on . The corresponding histogram of does not show such a bimodality. However, a histogram of slopes in our sample again shows a bimodal behaviour, with objects clumping around and . This supports the view that indeed a spectral change from hard to soft X-ray slope is underlying the change in variability properties of AGN.
3.1 Multidimensional fits
In the previous section we concentrated on the relation between the X-ray excess variance with the black hole mass but there were suggestions that the variability may correlate both with the mass and one more parameter like X-ray luminosity or bolometric luminosity.
Since the division of objects according to the Eddington ratio seems to be based on better physical grounds we test whether the dependence of the variability level on this ratio can account for the issue of enhanced NLS1 variability. Such an idea was put forward by McHardy et al. (2006) for a small sample of AGN.
The dependence of the mass ratio, or the variability enhancement, on the dimensionless accretion rate for our sample is shown in Fig. 6. We have calculated using equation (8) with the data of FWHM(H) and taken from Tables 1-3. Our best fit (solid line in figure) to the whole sample (without NGC 5506 i IC 5063 for which we have no estimate) gives
| (9) |
with and . The correlation is statistically significant (correlation coefficient 0.712).
We can compare this result with the result of McHardy et al. (2006). If we assume that the high frequency slope of the power spectrum is equal 2, and the normalization of the frequency multiplied power spectrum is independent from the object we can relate their result based on frequency break to our result involving the high frequency tail. With this assumption, the result of McHardy et al. (2006) imply we should expect a linear trend with the slope , or more precisely, a relation
| (10) |
where and are the coefficients from the McHardy et al. fits. Our larger sample is roughly consistent with this result since our slope and the slope implied by McHardy et al. (2006) results is 1.4. Since the dependence on the dimensionless accretion rate implied by the results based on the frequency break is even steeper it means that the overall trend of an increase of the mass discrepancy between the two methods with the Eddington ratio seems to be real although determination of this ratio is highly uncertain.
We also show in this figure the fit calculated by McHardy et al. (2006) made for 10 objects (i.e. 5 BLS1 and 5 NLS1). This fit is represented by the dot-short-dash line with the slope and value chosen in arbitrary way. Close to this fit lie our second fit (not shown in Fig 6). This fit is calculated for our sample of the same objects as in McHardy et al., but without NGC 5506. The value of slope of our second fit () and correlation coefficient (0.780) indicates that our approach is indeed equivalent to McHardy et al. (2006) analysis.
However, such a two-dimensional fit simply joints the extreme values of our mass ratios in Fig. 7 and does not provide an explanation of the bimodal distribution seen in Fig. 4.
We also repeat the two-dimensional fit to both the black mass and the X-ray luminosity proposed by Liu & Zhang (2008). If we allow for a general relation between the X-ray excess variance in our sample of 43 objects (renormalized to 40 000 s lightcurves) and the X-ray luminosity
| (11) |
we obtain the fit parameters , , . This sample includes the objects with the mass taken from the scaling relation since the number of sources with direct reverberation mass measurement is low. However, it seems that the most important effect is the careful measurement of the X-ray excess variance. If we take only the excess variance measurements obtained by O’Neill et al. (2005) and used by Liu & Zhang, and supplement them with our measurements only for sources which were not included in their study, the result is widely different: the dependence on the black hole mass is weak () while the dependence on the X-ray luminosity is strong () irrespectively of the use of scaled values of the black hole mass. Our measurements of the X-ray excess variance for a number of objects differ from the values obtained by O’Neil et al. (2005) due to another way of averaging and different length of single curves.
4 Discussion
The X-ray variability of the BLS1 galaxies at high frequencies depends only on the black hole mass, and the same is true for the galactic sources in their hard states (Gierliński et al. 2008). Therefore, the X-ray excess variance is a viable method of black hole mass determination (e.g. Papadakis 2004; Nikolajuk et al. 2004; Awaki et al. 2005; Zhang et al. 2005; Markowitz et al. 2006; Nikolajuk et al. 2006; see also O’Neill et al. 2005).
The issue complicates when the sources with soft X-ray spectra are considered. In the case of AGN the sources with the soft X-ray spectra usually belong to the NLS1 galaxy class, and usually they are more variable than the corresponding broad line objects (Iwasawa et al. 2000; Markowitz & Edelson 2004; Vaughan et al. 2005). McHardy et al. (2006) suggested that this effect should be taken into account in a form of continuous dependence of the variability rate not just on the black hole mass but also on the Eddington ratio. They have found a relation which roughly represents the variability properties in a combined sample of NLS1 and BLS1 objects.
In the present paper we studied a larger sample of 21 NLS1 galaxies. We confirm the dependence of the variability properties on the accretion rate if NLS1 galaxies are included. However, our study indicated that such a parametrization of variability as proposed by McHardy et al. (2006) for AGN may not fully reflect the complexity of the issue.
We have found that the essential effect is not in the dependence on the accretion rate but likely in the dependence on the soft X-ray slope. The slope is apparently related to the character of variability, as is seen for example in the study of the energy-dependent fractional variability by Gierliński & Done (2006). Typical soft NLS1 like NGC 4051 showed much higher amplitude at lower energies, below 0.5 keV than at 10 keV, indicating a pivoting trend while the hard spectrum NLS1, MCG -6-30-15 showed the same amplitude at very low and very high energy, i.e. no change of the spectral slope. What is more, we see an indication of a bimodal behaviour connected with predominantly bimodal distribution of the soft X-ray slopes of AGN in our sample while the distribution of the accretion rates seems to be continuous. This explains why Gierliński et al. (2008) do not find the dependence of the variability rate on luminosity in their study of the galactic sources: the sources were selected to represent the hard state only and the evolutionary stages with soft spectra were not selected for consideration.
The fact that it is not the luminosity change but the spectra change, which affects the fastest variability, hints for a different, or additional variability mechanism when the spectrum becomes softer.
We would like to emphasise the fact that our approach in calculating the normalized excess variance, based on computation weighted mean from the minimum chi-square fit, is more reliable and gives more accurate results than direct computation. Indeed, the way of calculating the excess variances is very important and it influences on obtained results. The findings depends on it very strongly. From this follows differences between our and Liu & Zhang (2008) results. When we repeated calculation of Liu & Zhang taking only their values of , we obtained results similar to them.
Nevertheless, we must note that we had still too small sample of galaxies, the data came from two different instrument (ASCA and Rossi-XTE), and particularly the number of sources with mass determination from monitoring was far from satisfactory. In order to resolve the fact that existence of bimodal distribution is realised in nature or not we need enlarge sample, especially by NLS1 objects which behave in the X-ray variance like BLS1 galaxies.
Acknowledgments
We would like to thank Yuang Wei-Min for useful discussions. The present work was supported by grants 1P03D00829 of the Polish State Committee for Scientific Research and by the Polish Astroparticle Network 621/E-78/SN-0068/2007. We also acknowledge the use of data obtained through the HEASARC online service provided by NASA/GSFC.
References
- [] Awaki H., Murakami H., Leighly K. M., Matsumoto C., Hayashida K., Grupe D., 2005, ApJ, 632, 793
- [] Barr P., Mushotzky R. F., 1986, Nat, 320, 421
- [] Barth A. J., Tran H. D., Brotherton M. S., Filippenko A. V., Ho L. C., van Breugel W., Antonucci R., Goodrich R. W., 1999, AJ, 118, 1609
- [] Bassani L., Dadina M., Maiolino R., Salvati M., Risaliti G., della Ceca R., Matt G., Zamorani G., 1999, ApJS, 121, 473
- [] Bentz M. C., Peterson B. M., Pogge R. W., Vestergaard M., Onken C. A., 2006, ApJ, 644, 133
- [] Bentz M. C., Denney K. D., Peterson B. M., Pogge R. W., 2007, in Ho L. C., Wang J.-M. eds, ASP Conf. Ser. Vol. 373, The Central Engine of Active Galactic Nuclei, San Francisco, p. 380
- [] Bian W.-H., 2005, Chin. J. Astron. Astrophys., 5, 289
- [] Bian W., Zhao Y., 2003, MNRAS, 343, 164
- [] Blandford R. D., McKee C. F., 1982, ApJ, 255, 419
- [] Boller T., Brandt W. N., Fink H., 1996, A&A, 305, 53
- [] Botte V., Ciroi S., Rafanelli P., Di Mille F., 2004, AJ, 127, 3168
- [] Boroson T. A., Green R. F., 1992, ApJS, 80, 109
- [] Brandt W. N., Mathur S., Elvis M., 1997, MNRAS, 285, L25
- [] Brandt W. N., Boller Th., Fabian A. C., Ruszkowski M., 1999, MNRAS, 303, 53
- [] Branduardi-Raymont G., Sako M., Kahn, S. M., Brinkman A. C., Kaastra J. S., Page M. J., 2001, A&A, 365, L140
- [] Collin S., Kawaguchi T., 2004, A&A, 426, 797
- [] Collin S., Kawaguchi T., Peterson B. M., Vestergaard M., 2006, A&A, 456, 75
- [] Czerny B., Nikolajuk M., Piasecki M., Kuraszkiewicz J., 2001, MNRAS, 325, 865
- [] Czerny B., Różańska A., Kuraszkiewicz J., 2004, A&A, 428, 39
- [] Dasgupta S., Rao A. R., Dewangan G. C., 2004, 614, 626
- [] Filippenko A. V., Ho L. C., 2003, ApJ, 588, L13
- [] Fiore F. et al., 1998, MNRAS, 298, 103
- [] Fiore F. et al., 2001, ApJ, 556, 150
- [] George I. M., Turner T. J., Yaqoob T., Netzer H., Laor A., Mushotzky R. F., Nandra K., Takahashi T., 2000, ApJ, 531, 52
- [] Gierliński M., Done C., 2006, MNRAS, 371, L16
- [] Gierliński M., Zdziarski A. A., Poutanen J., Coppi P. S., Ebisawa K., Johnson W. N., 1999, MNRAS, 309, 496
- [] Gierliński M., Nikołajuk M., Czerny B., 2008, MNRAS, 383, 741
- [] Green A. R., McHardy I. M., Lehto H. J., 1993, MNRAS, 265, 664
- [] Grupe D., Beuermann K., Thomas H.-C., Mannheim K., Fink H. H., 1998, A&A, 330, 25
- [] Grupe D., Beuermann K., Mannheim K., Thomas H.-C., 1999, A&A, 350, 805
- [] Grupe D., Wills B. J., Leighly K. M., Meusinger H., 2004, AJ, 127, 156
- [] Hayashida K., 2000, New Astron. Rev., 44, 419
- [] Hayashida K., Miyamoto S., Kitamoto S., Negoro H., Inoue H., 1998, ApJ, 500, 642
- [] Herrero A., Kudritzki R. P., Gabler R., Vilchez J. M., Gabler A., 1995, A&A, 297, 556
- [] Herrnstein J. R., Greenhill L. J., Moran, J. M., Diamond P. J., Inoue M., Nakai N., Miyoshi M., 1998, ApJ, 497, L69
- [] Hutchings J. B., Crampton D., Campbell B., 1984, ApJ, 280, 41
- [] Iwasawa K. Fabian A. C., Almaini O., Lira P., Lawrence A., Hayashida K., Inoue H., 2000, MNRAS, 318, 879
- [] Kaspi S., Smith P. S., Netzer H., Maoz D., Jannuzi B. T., Giveon U., 2000, ApJ, 533, 631
- [] Kaspi S., Maoz D., Netzer H., Peterson B. M., Vestergaard M., Jannuzi B. T., 2005, ApJ, 629, 61
- [] Kormendy J., Gebhardt K., 2001, in Wheeler J. C. , Martel H., eds, AIP conference proceedings, Vol. 586, 20th Texas Symposium on relativistic astrophysics, Austin, Texas, p. 363
- [] Kraemer S. B., Ho L. C., Crenshaw D. M., Shields J. C., Filippenko A. V., 1999, ApJ, 520, 564
- [] Krolik J. H., 2001, ApJ, 551, 72
- [] Lawrence A., Papadakis I., 1993, ApJ, 414, L85
- [] Lawrence A., Elvis M., Wilkes B. J., McHardy I., Brandt N., 1997, MNRAS, 285, 879
- [] Lee J. C., Ogle P. M., Canizares C. R., Marshall H. L., Schulz N. S., Morales R., Fabian A. C., Iwasawa K., 2001, ApJ, 554, L13
- [] Leighly K. M., 1999a, ApJ, 125, 297
- [] Leighly K. M., 1999b, ApJ, 125, 317
- [] Leighly K. M., Moore J. R., 2004, ApJ, 611, 107
- [] Liu Y., Zhang S. N., 2008, A&A, 480, 699
- [] Lu Y., Yu Q., 2001, MNRAS, 324, 653
- [] McLure R. J., Dunlop J. S., 2001, MNRAS, 327, 199
- [] McHardy I. M., Papadakis I. E., Uttley P., Page M. J., Mason K. O., 2004, MNRAS, 348, 783
- [] McHardy I. M., Gunn K. F., Uttley P., Goad M. R., 2005, MNRAS, 359, 1469
- [] McHardy I. M., Koerding E., Knigge C., Uttley P., Fender R. P., 2006, Nat, 444, 730
- [] McGill K. L., Woo J.-H., Treu T., Malkan M. A., 2008, ApJ, 673, 703
- [] Malizia A. et al., 2008, MNRAS, 389, 1360
- [] Malkan M., Margon B., Chanan G., 1984, ApJ, 280, 66
- [] Markowitz A., Edelson R., 2004, ApJ, 617, 939
- [] Markowitz A., Uttley P., 2005, ApJ, 625, L39
- [] Markowitz A. et al. 2003, ApJ, 593, 96
- [] Markowitz A., Reeves J. N., Braito V., 2006, ApJ, 646, 783
- [] Mathur S., Grupe D., 2005a, ApJ, 633, 688
- [] Mathur S., Grupe D., 2005b, A&A, 432, 463
- [] Mathur S., Kuraszkiewicz J., Czerny B., 2001, New Astronomy, 6, 321
- [] Merloni, A., Heinz, S., di Matteo, T., 2003, MNRAS, 345, 1057
- [] Moran E. C., Eracleous M., Leighly K. M., Chartas G., Filippenko A. V., Ho L. C., Blanco P. R., 2005, AJ, 129, 2108
- [] Nandra K., 2006, MNRAS, 368, L62
- [] Nandra K., Pounds K. A., 1994, MNRAS, 268, 405
- [] Nandra K., George I. M., Mushotzky R. F., Turner T. J., Yaqoob T., 1997, ApJ, 476, 70
- [] Netzer H., 1990, in Courvoisier T. J.-L., Major M., eds, Active Galactic Nuclei. Springer, Berlin, p. 57
- [] Nikolajuk M., Papadakis I. E., Czerny B., 2004, MNRAS, 350, L26
- [] Nikołajuk M., Czerny B., Ziółkowski J., Gierliński M., 2006, MNRAS, 370, 1534
- [] Nowak M. A., Vaughan B. A., Wilms J., Dove J. B., Begelman M. C., 1999, ApJ, 510, 874
- [] O’Neill P. M., Nandra K., Papadakis I. E., Turner T. J., 2005, MNRAS, 358, 1405
- [] Onken Ch. A., Ferrarese L., Merritt D., Peterson B. M., Pogge R. W., Vestergaard M., Wandel A., 2004, ApJ, 615, 645
- [] Osterbrock D. E., Pogge R. W., 1985, ApJ, 297, 166
- [] Orosz J. A., 2003, IAUS, 212, 365
- [] Papadakis I. E., 2004, A&A, 425, 1133
- [] Papadakis I. E., Brinkmann W., Negoro H., Gliozzi M., 2002, A&A, 382 L1
- [] Peterson B. M., Wandel A., 1999, ApJ, 521, L95
- [] Peterson B. M., Wandel A., 2000, ApJ, 540, L13
- [] Peterson B. M. et al., 2004, ApJ, 613, 682
- [] Peterson B. M. et al., 2005, ApJ, 632, 799
- [] Pfefferkorn F., Boller Th., Rafanelli P., 2001, A&A, 368, 797
- [] Pounds K. A., Done C., Osborne J. P., 1995, MNRAS, 277, L5
- [] Puchnarewicz E. M., et al. 1992, MNRAS, 256, 589
- [] Reynolds C. S., 1997, MNRAS, 286, 513
- [] Shields J. C., 2007, in Ho L. C., Wang J.-M. eds, ASP Conf. Ser. Vol. 373, The Central Engine of Active Galactic Nuclei, San Francisco, p. 355
- [] Shih D. C., Iwasawa K., Fabian A. C., 2003, MNRAS, 341, 973
- [] Shrader Ch. R., Titarchuk L., 2003, ApJ, 598, 168
- [] Shuder J. M., Osterbrock D. E., 1981, ApJ, 250, 55
- [] Sobolewska M., Done C., 2007, MNRAS, 374, 150
- [] Stephens S. A., 1989, AJ, 97, 10
- [] Thuan T. X., Gunn E., 1976, PASP, 88, 543
- [] Turner T. J., George I. M., Nandra K., Turcan D., 1999, ApJ, 524, 667
- [] Uttley P., McHardy I. M., 2005, MNRAS, 363, 586
- [] Uttley P., McHardy I. M., Papadakis I. E., Guainazzi M., Fruscione A., 1999, MNRAS, 307, 6
- [] Uttley P., McHardy I. M., Papadakis I. E., 2002, MNRAS, 332, 231
- [] Vaughan S., Fabian A. C., 2003, MNRAS, 341, 496
- [] Vaughan, S., Reeves, J., Warwick, R., Edelson, R., 1999, MNRAS, 309, 113
- [] Vaughan S., Iwasawa K., Fabian A. C., Hayashida K., 2005, MNRAS, 356, 524
- [] Vestergaard M., 2002, ApJ, 571, 733
- [] Véron-Cetty M.-P., Véron P., 2000, A&ARv, 10, 81
- [] Véron-Cetty M.-P., Véron P., 2006, A&A,455, 773
- [] Véron-Cetty M.-P., Véron P., Gonçalves A. C., 2001, A&A, 372, 730
- [] Walter R., Fink H. H., 1993, A&A, 274, 105
- [] Wamsteker W., et al, 1990, ApJ, 354, 446
- [] Wandel A., 1999, ApJ, 519, 39
- [] Wang T., Lu Y., 2001, A&A, 377, 52
- [] Wang T., Brinkmann W., Bergeron J., 1996, A&A, 309, 81
- [] Warner C., Hamann F., Dietrich M., 2004, ApJ, 608, 136
- [] Williams R. J., Mathur S., Pogge, R. W., 2004, ApJ, 610, 737
- [] Woo J.-H., Urry C. M., 2002, ApJ, 579, 530
- [] Zhang E.-P., Wang J.-M., 2006, ApJ, 653, 137
- [] Zhang Y. H., Treves A., Celotti A., Qin Y. P., Bai J. M., 2005, ApJ, 629, 686
- [] Zhou H., Wang T., Yuan W., Lu H., Dong X., Wang J., Lu Y. 2006, APJS, 166, 128
- [] Ziółkowski J., 2005, MNRAS, 358, 851
- [] Zombeck M. V., 1990, Handbook of Astronomy and Astrophysics. Cambridge University Press, Cambridge, UK
This paper has been typeset from a TeX/LaTeX file prepared by the author.