Shear Flows Driven by the Lorentz Force: An Energy Source for Coronal Mass Ejections and Flares
Abstract
Shear flows have been prescribed in numerical models of coronal mass ejections and flares for decades as a way of energizing magnetic fields to erupt. While such shear flows have long been observed in the solar atmosphere, until recently, there was no compelling physical explanation for them. This paper will discuss the discovery that such shear flows are readily explained as a response to the Lorentz force that naturally occurs as bipolar magnetic fields emerge and expand in a gravitationally stratified atmosphere. It will be shown that shearing motions transport axial flux, and magnetic energy from the submerged portion of the field to the expanding portion, strongly coupling the solar interior to the corona. This physical process explains active region shear flows and why the magnetic field is found to be nearly parallel to photospheric polarity inversion lines where prominences form. Finally, shear flows driven by the Lorentz force are shown to produce a loss of equilibrium and eruption in magnetic arcades and flux ropes offering a convincing explanation for CMEs and flares.
1. Introduction
Coronal mass ejections (CMEs) are energetic expulsions of plasma from the solar corona that are driven by the release of magnetic energy typically in the range of ergs. The majority of CMEs originate from the eruption of pre-existing large-scale helmet streamers (Hundhausen 1993). Less common fast CMEs typically come from smaller, more concentrated locations of magnetic flux referred to as active regions. In this case, the CMEs often occur shortly after the flux has emerged at the photosphere, but can also happen even as the active region is decaying. While CMEs occur in a wide range of circumstances, all CMEs originate above photospheric magnetic polarity inversion lines (neutral lines), which exhibit strong magnetic shear. Shear implies that the magnetic field has a strong component parallel to the photospheric line that separates magnetic flux of opposite sign, and in this configuration, the field possesses significant free energy. In contrast, a potential field runs perpendicular to the inversion line and has no free energy.
There is enormous evidence for the existence of highly sheared magnetic fields associated with CMEs and large flares. At the photosphere, magnetic shear is measured directly with vector magnetographs (e.g. Hagyard et al. 1984; Zirin & Wang 1993; Falconer et al. 2002; Yang et al. 2004; Liu et al. 2005). Higher in the atmosphere, the magnetic field is difficult to measure directly, but its direction may be inferred from plasma structures formed within the field. Seen in chromospheric H absorption, filaments form only over photospheric inversion lines (Zirin 1983) along which the magnetic field is nearly parallel (Leroy 1989). Fibrils and H loops that overlay photospheric bipolar active regions are also indicative of magnetic shear (Foukal 1971). Comparisons between vector magnetograms and H images show that the direction of the sheared photospheric magnetic field coincides with the orientation of such fibril structures (Zhang 1995). Higher in the corona, evidence of magnetic shear is found in loops visible in the extreme ultraviolet (Liu et al. 2005) and X-ray sigmoids (Moore et al. 2001). These structures run nearly parallel to the photospheric magnetic inversion line prior to CMEs, and are followed by the reformation of closed bright loops that are much more potential in structure. Finally, observations by the Transition Region and Coronal Explorer (TRACE) show that 86 percent of two-ribbon flares show a strong-to-weak shear change of the ribbon footpoints that indicates the eruption of a sheared core of flux (Su et al. 2007).
Sheared magnetic fields are at the epicenter of solar eruptive behavior. Large flares are preferentially found to occur along the most highly sheared portions of magnetic inversion lines (Hagyard et al. 1984; Zhang 1995). More recent analysis by Schrijver et al. (2005) found that shear flows associated with flux emergence drove enhanced flaring. Similarly, active region CME productivity is also strongly correlated with magnetic shear as shown by Falconer (2001); Falconer et al. (2002, 2006). It is not coincidental that large flares and CMEs are strongly associated with filaments, which are known to form only along sheared magnetic inversion lines (Zirin 1983). The buildup of magnetic shear is essential for energetic eruptions, and for this reason, it is of fundamental importance to understanding solar activity.
Currently the majority of CME initiation models rely on the application of artificially imposed shear flows. Examples of such models include Antiochos et al. (1999); Mikic & Linker (1994); Guo and Wu (1998); Amari et al. (2003). Until recently, there was no theory to account for these large scale shear flows. In this paper, we discuss a series of simulations that illustrate a physical process by which these shear flows are self-organized in emerging magnetic fields. We will give a close comparison of these simulations in the context of new observations that make a more complete and compelling picture of a fundamental cause of eruptive solar magnetic activity.
2. Simulations
Shearing motions and magnetic field alignment with the polarity inversion line, so frequently observed in active regions, are readily explained as a response to the Lorentz force that arises when magnetic flux emerges in a gravitationally stratified atmosphere. The motions take the form of large-amplitude shear Alfvén waves in which the magnetic tension force drives horizontal flows in opposite directions across the polarity inversion line. The physical process was first shown by Manchester & Low (2000); Manchester (2000, 2001) and found in later simulations by Fan (2001); Magara & Longcope (2003); Archontis et al. (2004). As will be discussed in greater detail, what ultimately produces the shearing Lorentz force is the nonuniform expansion of the emerging magnetic field.
The shearing process was first simulated by Manchester (2001), with a two-and-a-half-dimensional (2.5D) simulation of flux emergence from a horizontal magnetic layer placed 2-3 pressure scale heights below the photosphere. The crucial aspect of this simulation is that the magnetic field is initially in a sheared configuration oriented at a 45 degree angle to the plane of variation. In this case, for spatial and temporal variations of the instability described by , is oblique to the magnetic field (). This distinguishes the mode of instability from a Parker mode (Parker 1966) in which is parallel to or an interchange mode in which is perpendicular to . With oblique to , the instability can be thought of as a mixed mode, (e.g. Cattaneo et al. 1990; Matsumoto et al. 1993; Kusano et al. 1998). In this case, there will be a component of the Lorentz force out of the plane of variation any where the magnetic component out of the plane ( in the chosen coordinates) is not constant along field lines. In the simulation by Manchester (2001), it was shown that the departure of from constant values along field lines produced strong shear flows in the emerging flux.
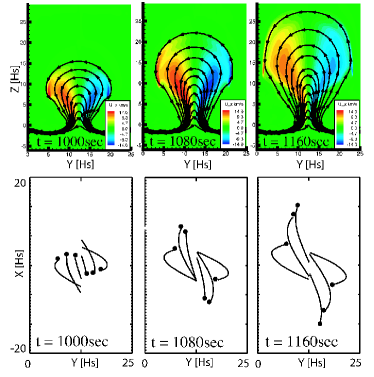
When the magnetic flux rises forming an arcade as shown in Figure 1, expansion causes the magnitude of to decrease in the arcade. The gradient in along field lines results in the Lorentz force that drives the shear flows. Examining the expression for the component of the Lorentz (tension) force, , we see the reason for the shear. The gradient in is negative moving up the arcade in the direction of on one side of the arcade, while on the opposite side, the gradient of along is positive.
These shear flows are illustrated in color in the top row of Figure 1. Here, we see the persistence of shear flows as the magnetic field (drawn with black lines) expands in the atmosphere. The magnitude of the shear flow velocity reaches a peak of 15 km/s high in the arcade, 3-4 km/s at the photosphere and approximately 1 km/s below the photosphere. The maximum shear speed typically reaches half the value of the local Alfvén speed. The bottom row of Figure 1 shows the time evolution of magnetic field lines integrated in three-dimensional space, and shown from above projected onto the plane. Footpoints of the field lines are shown with black dots. These panels show the shear displacement of the footpoints and how the magnetic field evolves to be parallel to the polarity inversion line. Note that the field is most highly sheared in close proximity to the polarity inversion line, and grows more nearly perpendicular to the line with greater distance from it.
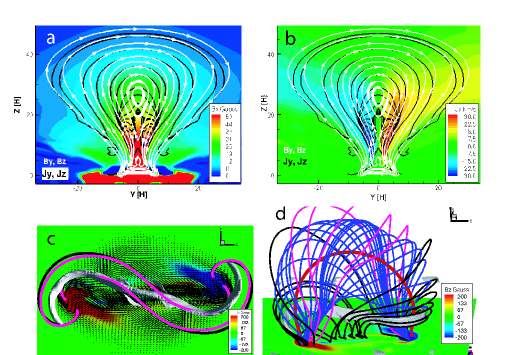
This same shearing process is found in more complex simulations such as three-dimensional emerging flux ropes (Fan 2001; Magara & Longcope 2003; Manchester et al. 2004; Archontis et al. 2004). Panel (a) of Figure 2 shows in greater detail than before the structure of the magnetic field and current systems in the emerging flux rope of Manchester et al. (2004) that leads to the Lorentz force, which drives the shear flows. Here, the axial field strength of the rope is shown in color, while the direction of the magnetic field and current density (confined to the plane) are shown with white and black lines respectively on the vertical plane that is at the central cross section of the flux rope. The large expansion of the upper part of the flux rope produces a vertical gradient in the axial component of the magnetic field that results in a horizontal current . The magnetic field crosses the current in opposite direction on opposite sides of the flux rope. This produces the Lorentz force out of the plane that reverses direction across the flux rope, and drives the horizontal shear flow. Panel (b) shows the magnitude of these shear flows on the same central cross section of the flux rope. The shear flow is greatest precisely where the field is most nearly perpendicular to the current reaching a magnitude of approximately 30 km/s. At this time, the flux rope has risen twice as high as the flux that emerged from the magnetic layer and similarly the shear flow in the rope is also twice as fast.
In the case of Manchester et al. (2004) the flux rope erupted, which was not found in earlier simulations such as (Fan 2001). This eruption resulted from high speed shear flows close to the neutral line that formed a highly sheared core that lifted off, and was followed by magnetic reconnection. The bottom panels show the magnetic and current structure at the time of the eruption. Panel (c) gives a view of the system that shows the vertical magnetic field in color and the horizontal field with arrows at the photosphere. A current sheet is illustrated with an isosurface of current density. The sigmoid shape of the sheet reflects the shape of both the coronal field lines passing close to the sheet as well as the highly sheared field at the photosphere. This model strongly suggests that X-ray sigmoids seen prior to and during CMEs are indicative of a highly sheared magnetic field geometry. Panel (d) shows that at this current sheet, reconnection is taking place that separates the upper part of the rope that is erupting from the lower part that has V-shaped field lines full of dense plasma that remains attached to the photosphere. Such flux separations in CMEs have been suggested by Gilbert et al. (2000) based on observations of filament eruptions.
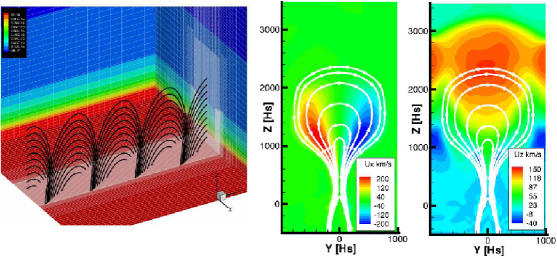
Finally we discuss a numerical simulation of an arcade eruption. This simulation is essentially identical to the simulation of Manchester (2003), with the exception that it is carried out in fully three-dimensional space with the BATS-R-US MHD code developed at the University of Michigan. The left panel of Figure 3 shows the initial state of the simulation with field lines drawn in black showing the sheared magnetic arcade. On the boundaries of the computational domain, the plasma mass density is shown in color along with the computational grid shown with white lines. The center and right panels show the shear and vertical velocities respectively in color on the central plane of the simulation. The magnetic field confined to the plane (ignoring the component out of the plane) is drawn with white lines in both panels. In these panels, we find that the arcade erupts very violently with a shear flow that reach a magnitude of 200 km/s. The arcade rises at a peak velocity of 150 km/s, and drives a shock ahead of it in the corona.
In this simulation, the eruption is caused by shear flows driven by the Lorentz force. A shearing catastrophe occurs when the component of the magnetic field can not be equilibrated along field lines. This simulation is different from the pervious two discussed in that it does not treat flux emergence through the photosphere, but only models the coronal plasma at a temperature of one million degrees. Not needing to resolve the photospheric pressure scale hight allows much larger cells and a computational domain that is 25 times larger than that of the previous two simulations. The result of this coronal arcade simulation is an eruption that is 5 times faster than the flux rope eruption, and extends out to half a solar radius above the surface. This progression of eruption velocity with the size of the flux system being treating offers compelling evidence that shear flows driven by the Lorentz are capable of producing fast CMEs from large active regions.
3. Discussion
The build up of magnetic energy in active regions is essential to the onset of CMEs and flares. The magnetic stress must pass from the convection zone into the corona in the form of non-potential fields, and effectively couple layers of the atmosphere. Observations show that such non-potential fields occurs along magnetic polarity inversion lines where the magnetic field is highly sheared. The evidence that magnetic shear is essential to CMEs and flares is provided by the very strong correlation between photospheric shear flows, flux emergence and the onset of CMEs and large flares (Meunier & Kosovichev 2003; Yang et al. 2004; Schrijver et al. 2005). These shear flows are found to be strongest along the magnetic inversion line precisely where flares are found (Yang et al. 2004; Deng et al. 2006). This complements earlier evidence that in the case of two-ribbon flares (Zirin 1984), prior to the eruption, H arches over the inversion line are highly sheared, afterward, the arches are nearly perpendicular to the inversion line. Su et al. (2006) found a similar pattern of magnetic shear loss in the apparent motion of footpoints in two-ribbon flares. There are even now observations of subphotospheric shear flows with a magnitude of 1-2 km/s 4-6 Mm below the photosphere that occur during flux emergence (Kosovichev and Duvall 2006), which simulations show is fully consistent with the Lorentz force driving mechanism (Manchester 2007).
These ubiquitous shear flows and sheared magnetic fields so strongly associated with CMEs are readily explained by the Lorentz force that occurs when flux emerges and expands in a gravitationally stratified atmosphere. This physical process explains and synthesizes many observations of active regions and gives them meaning in a larger context. This shearing mechanism explains (1) the coincidence of the magnetic neutral line with the velocity neutral line, (2) the impulsive nature of shearing in newly emerged flux, (3) the magnitude of the shear velocity in different layers of the atmosphere, (4) the large scale pattern of magnetic shear in active regions, (5) the transport of magnetic flux, and energy from the convection zone into the corona, (6) eruptions such as CMEs and flares. With so much explained, it still remains a numerical challenge to model an active region with sufficient resolution to produce a large scale CME by this shearing mechanism. The rope emergence simulation discussed here only produces a flux concentration that is one tenth the size of an active region, which at this scale simply can not produce an eruption the size of a CME. However, this simulation illustrates the basic process by which CMEs and flares must occur, and current simulations already show a very favorable scaling of eruption size. With increases in computer power, simulations of flux emergence should soon be producing CME size eruptions by shear flows driven by the Lorentz force.
Acknowledgments.
Ward Manchester is supported in part at the University of Michigan by NASA SR&T grant NNG06GD62G. The simulations shown here were performed on NCAR and NASA super computers.
References
- Amari et al. (2003) Amari, T., Luciani, J. F., Aly, J. J., Mikic, Z. & Linker, J. 2003, ApJ, 585, 1073
- Antiochos et al. (1999) Antiochos S. K., DeVore C. R., and Klimchuk J. A. 1999, ApJ, 510, 485
- Archontis et al. (2004) Archontis V., Moreno-Insertis F., Galsgaard, K., Hood, A. & O’Shea J. A. 2004, A&A, 426, 1047
- Cattaneo et al. (1990) Cattaneo, F., Chiueh, T., & Hughes, D.W. 1990, J. Fluid Mech., 219, 1
- Deng et al. (2006) Deng, N., Xu, Y., Yang, G., Cao, W., Liu, C., Rimmele, R., Wang, H., & Denker, C. 2006, ApJ, 644, 1278
- Fan (2001) Fan, Y. 2001, ApJ, 554, L111
- Falconer (2001) Falconer, D. A. 2001, JGR, 106, 25185
- Falconer et al. (2002) Falconer, D. A., Moore, R. L. & Gary, G. A. 2002, ApJ, 569, 1016
- Falconer et al. (2006) Falconer, D. A., Moore, R. L. & Gary, G. A. 2006, ApJ, 644, 1272
- Foukal (1971) Foukal, P. 1971, Solar Phys., 19, 59
- Gilbert et al. (2000) Gilbert, H. R., Holzer, T. E., Burkepile, J. T., & Hundhausen, J. A. 2000, ApJ, 537, 503
- Guo and Wu (1998) Guo, W. P., & Wu, S. T. 1998, ApJ, 494, 419
- Hagyard et al. (1984) Hagyard, M. J., Moore, R. L., & Emslie, A. G. 1984a, Adv. Space Res. 4, 7, 71
- Howard & LaBonte (1980) Howard, R., & LaBonte, B. J. 1980, ApJ, 239, L33
- Hundhausen (1993) Hundhausen, A. J., Sizes and locations of coronal mass ejections: SMM observations from 1980 and 1984-1989, 1993, J. Geophys Res., 98, 13177-13200
- Kosovichev and Duvall (2006) Kosovichev, A. G., & Duvall JR, T. L. 2006, Space Sci. Rev., 124, 1
- Kusano et al. (1998) Kusano, K., Moriyama, K. & Miyoshi, T. 1998, Phys. Plasmas, 5, 2582
- Leroy (1989) Leroy, J. L. 1989 in Dynamics and Structure of Quiescent Solar Prominences, ed. E. R. Priest (Dordrecht: Kluwer), p. 77
- Liu et al. (2005) Liu, C., Deng, N., Liu, Y., Falconer, D., Goode, P., Denker, C., & Wang, H. 2005, ApJ622, 722
- Magara & Longcope (2003) Magara, T. & Longcope, D. W. 2003, ApJ, 586, 630
- Manchester & Low (2000) Manchester, IV, W. & Low, B. C. 2000, Phys. Plasmas, 7, 1263
- Manchester (2000) Manchester, IV, W. 2000b, Ph.D. thesis, University of Illinois, 2000
- Manchester (2001) Manchester, IV, W. 2001, ApJ, 547, 503
- Manchester (2003) Manchester, IV, W. 2003, JGR, 108, 1162, doi:10.1029/2002JA009252
- Manchester et al. (2004) Manchester, IV, W., Gombosi, T., DeZeeuw, D. & Fan, Y. 2004, ApJ, 610, 588
- Manchester (2007) Manchester, IV, W. 2007, ApJ, 666, 532
- Matsumoto et al. (1993) Matsumoto, R., Tajima, T., Shibata, K., & Kaisig, M. 1993, ApJ, 414, 357
- Meunier & Kosovichev (2003) Meunier, N., & Kosovichev, A. 2003, A&A, 412, 541
- Mikic & Linker (1994) Mikic, Z., & Linker, J. A. 1994, ApJ, 430, 898
- Moore et al. (2001) Moore, R. L., Sterling, A. C., Hundson, H. S. & Lemen, J. R. 2001, ApJ, 552, 833
- Parker (1966) Parker, E. N. 1966, ApJ, 145, 811
- Schrijver et al. (2005) Schrijver, C., DeRosa, M. L., Title, A. M., & Metcalf, T. 2005, ApJ, 628, 501
- Su et al. (2006) Su, Y. N., Golub, L., Van Ballegooijen, A. A. & Gros, M. 2006, Sol. Phys., 236, 325
- Su et al. (2007) Su, Y. N., Golub, L., Van Ballegooijen, A. A. 2007, ApJ655, 606
- Yang et al. (2004) Yang, G., Xu, Y., Cao, W., Wang, H., Denker, C., & Rimmele, T. R., 2004, /apj, 617, L151
- Zhang (1995) Zhang, H. 1995, A&A, 304, 541
- Zirin (1983) Zirin, H. 1983, ApJ, 274, 900
- Zirin (1984) Zirin, H. 1984, ApJ, 281, 884
- Zirin & Wang (1993) Zirin, H., & Wang, H. 1993, Nature, 363, 426