Dynamics of lane formation in driven binary complex plasmas
Abstract
The dynamical onset of lane formation is studied in experiments with binary complex plasmas under microgravity conditions. Small microparticles are driven and penetrate into a cloud of big particles, revealing a strong tendency towards lane formation. The observed time-resolved lane formation process is in good agreement with computer simulations of a binary Yukawa model with Langevin dynamics. The laning is quantified in terms of the anisotropic scaling index, leading to a universal order parameter for driven systems.
pacs:
52.27.Lw, 61.20.Ja, 64.70.DvThe formation of lanes is a ubiquitous phenomenon occurring in nature when two species of particles are driven against each other. When the driving forces are strong enough, like-driven particles form “stream lines” and move collectively in lanes. Typically, the lanes exhibit a considerably anisotropic structural order accompanied by an enhancement of their mobility. The phenomenon is most commonly known from pedestrian dynamics in highly populated pedestrian zones helbing_prl_2000 , but also occurs in very different model systems of driven particles, such as colloidal dispersions dzubiella_pre_2002 ; leunissen_nature_2005 ; Reichhardt2006 , lattice gases Zia and molecular ions netz_epl_2003 . Lane formation is a genuine nonequilibrium transition Zia which depends on the details of the particle interactions and their dynamics Rex2008 .
Recently, the particle laning was also observed in complex plasmas Morfill06NJP . In fact, complex plasmas Fortov05 ; ShuklaBook provide a very important intermediate dynamical regime that is between classic undamped fluids and fully damped colloidal suspensions: In complex plasmas, the “atomistic” dynamics associated with the interparticle interaction is virtually undamped whereas the large-scale hydrodynamics is determined by friction.
In this Letter we report on comprehensive experimental studies of lane formation in complex plasmas, that were carried out under microgravity conditions with the radio frequency (rf) discharge chamber PK-3 Plus Thomas08 . The motivation for this research is threefold: First, we demonstrate that complex plasmas are indeed an ideal model system to study nonequilibrium phase transitions such as laning. Second, the experiments enable us to investigate the dynamical onset of lane formation in detail. Third, we achieve a quantitative understanding of the structural correlation during the onset of laning by comparison with particle-resolved Langevin simulations. Based on the anisotropic scaling index analysis of the obtained data, we suggest a universal order parameter for non-equilibrium phase transitions in driven systems.
Experiments. A series of dedicated experiments was carried out in the PK-3 Plus rf discharge chamber on the International Space Station. Microgravity is a crucial factor which allows us to form stable spheroidal complex plasma clouds. When small particles are injected into a cloud of big ones, the force field pulls small particles towards the center, thus making such systems perfectly suited to study lane formation. Our experiments were performed for various combinations of “big” and “small” monodisperse particles (2.55, 6.8, 9.2, and 14.9 m diameter for “big”, and 1.55, 2.55, and 3.4 m for “small”), with different neutral gases and pressures (argon between 10 and 60 Pa and neon at 60 Pa, to control the friction rate), and for different rf discharge powers (to control the screening length).
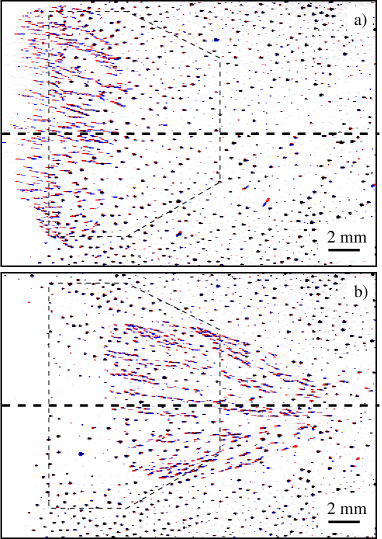
Figure 1 shows a characteristic example of lane formation observed in experiments with m and m particles at pressure of 30 Pa. When a fraction of individual small particles enters the interface of the fairly homogeneous cloud formed by big particles, the subsequent penetration is accompanied by a remarkable self-organization sequence: (a) Big particles are pushed collectively by the inflowing cloud of small particles, the latter form strings drifting on average along the force field. (b) As the particles approach the center of chamber, the field decreases and the strings organize themselves into larger streams. At the later stage, when the field almost vanishes, the streams merge to form a spheroidal droplet with well-defined surface, indicating the transition to the regime when surface tension plays the primary role. In this Letter we are specifically interested in the first two stages footnote1 . It is noteworthy that during the stage (b) big particles also form well defined strings. Small and big particles create an “array” of interpenetrating strings, where small particles are drifting to the right and big ones are almost immobile. After the flux of small particles is exhausted, the big-particle strings slowly dissolve footnote2 .
Computer simulations. First, the distribution of the characteristic parameters of the discharge plasma, such as plasma density, electron temperature, and electric fields, was deduced from 2D simulations of the PK-3 Plus discharge chamber. We used the plasma fluid code (described in Ref. Land06 ), which provides a self-consistent coupling of dust species to the discharge plasma, including the particle charging, plasma absorption, redistribution of volume charges/ambipolar fields, etc. These simulations suggest that in the midplane of the chamber the cloud of big particles is “self-confined” at its edges due to the self-consistent plasma field, as illustrated in Fig. 13 of Ref. Land06 , whereas inside the cloud the electric and ion drag forces practically compensate each other. On the other hand, since these two forces have different scaling on the particle size, the net force on small particles is nonzero inside the cloud. For the experiment shown in Fig. 1, the simulations yield a force of pN pushing a small particle towards the center.
Next, particle-resolved molecular dynamics (MD) simulations were performed on the Langevin level Ivlev05 for a binary mixture of 5759 small and 12287 big particles. The simulation box with periodic boundary conditions has dimensions of cm in -direction and cm in - and -directions. The particles interact via a Yukawa pair potential with a screening length m (based on results of our plasma discharge simulations) and effective charges (based on experiment Annibaldi07 ) and , proportional to the respective particle diameter, m and m. The mass density of the particles is g/cm3 and the corresponding friction rates are s-1 and s-1. The mean interparticle distances are deduced from the experiment, m (before the penetration) and m, the temperature is eV.
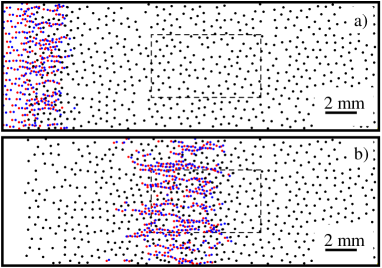
Our plasma simulations show that big particles do not experience an external force in the bulk. Therefore, in our MD simulation we confine them in -direction by a parabolic external potential at two edges (with a width of 2.2 cm) and adjust the confinement strength, so that the measured interparticle distance is reproduced. Similarly, a portion of small particles, separated from the big particles, was prepared (with a width of 0.7 cm). Then the constant driving force was instantaneously applied, leading to penetration of small particles into the cloud of big ones. Simulation snapshots are shown in Fig. 2, revealing a qualitative agreement with the experiment.
Anisotropic scaling index and order parameter. In order to identify and quantify the string-like structures in our experimental data and the simulations, a suitable order parameter has to be employed that is sensitive to the changing particle structures. Conventional approaches, e.g., binary correlation or bond orientation functions, Legendre polynomials, etc. turned out to be too insensitive. Much more satisfactory results were obtained by implementing an anisotropic scaling index method – a local nonlinear measure for structure characterization. This method has already been used to characterize electrorheological complex plasmas Ivlev08 , large-scale distribution of galaxies Rath02 , or bone structure Rath08 .
For a given set of particle positions, , , we define a local density , where and is a certain shaping function characterized by the spatial scale . The scaling index is the logarithmic derivative of the density with respect to the spatial scale, . Hence, characterizes the dimensionality of the local structure around point , in the vicinity determined by the scale . For example, means that the local structure is close to a straight line at the spatial scale , for it is an element of a plane, and so on. Using the Gaussian shaping function we derive for the scaling index,
| (1) |
Thus, the spatial scale is an important mesoscopic measure of the local environment. In the range of relevant scales is practically independent of .
In order to characterize anisotropic structures, we use a “stretch metric” for the distance measure . On a 2D plane, the metric is determined by the aspect ratio , which is the relative stretching of two principal axes, and by the unit vector in the direction of stretching. Then the resulting anisotropic scaling index, , can be directly obtained from Eq. (1). We propose a “uniaxial vector characterization”: Each point is associated with the unit vector which points to a “preferred” direction of the local anisotropy. This direction is determined by the angle at which the “anisotropic contrast” is maximized. The directions and are equivalent, so that below they are defined for the range .
Thus, each point can now be considered as a uniaxial “molecule” (simple rod) with the direction . Therefore, the global laning on a 2D plane can be characterized with the second-rank tensor , analogous to that used to quantify order of the nematic phase. The direction of the global laning, , is then the eigenvector (“nematic director”) corresponding to the largest eigenvalue of , which in turn is the laning order parameter, . Obviously, for a perfect alignment and for a disordered phase, when individual vectors are uncorrelated. We finally define the global laning angle via the relation .
Comparison of experiments and simulations. For the analysis of the MD simulations, we divided the volume of the simulation box in -direction (perpendicular to the driving force in -direction) into several slabs of mm width, which is about the thickness of the laser sheet used to record the experimental data. Hence, the average number of particles and their average density, as well as the magnitude of their fluctuations in this “reduced” simulation data set were similar to those in the experiment. The obtained results were analyzed and compared using the anisotropic scaling index method. The relevant range of spatial scales was about for big particles and for small particles, the anisotropic aspect ratio was 5 and 7, respectively.
Discrimination of big and small particles in the experimental data was performed in terms of their velocities: During the stages of the lane evolution illustrated in Fig. 1, small particles drift relatively fast with respect to big particles towards the center of the chamber. They gradually slow down, until at the later stage their velocities become too low and then small and big particles are no longer distinguishable.
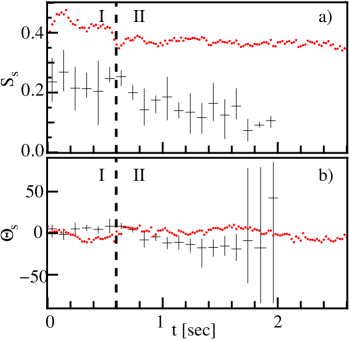
(i) Small particles. We first identified boundaries of the self-contained big- and small-particle clouds. Overlap of the two clouds was a natural choice for the region to analyze the dynamics and structural evolution of small particles, as they penetrate the cloud of big ones. There are two distinct phases characterizing formation and evolution of small-particle lanes [approximately correspond to Figs 1(a) and 1(b), respectively]: An “injection stage” (I), starts at the moment when first small particles penetrate the cloud of big ones. During this phase, the number of small particles for the analysis increases from zero to the average number per slab, and therefore significant fluctuations are possible due to poor statistics. After about one second, there is a crossover to a “steady-state stage” (II), when the average number of small particles remains constant and the driving force can be considered constant as well. In the simulations the duration of steady-state phase is sufficiently long (two seconds), due to properly chosen length of the simulation box. In the experiment, however, this phase is 2–3 times shorter, because the driving force and hence the particle velocities decrease as they approach the center of chamber.
The order parameter calculated for small particles is plotted in Fig. 3(a). Although in the beginning of stage I it exhibits significant fluctuations due to poorer statistics, one can see that the formation of small-particle lanes is practically “instantaneous” at timescales corresponding to the experimental frame rate (50 frames/s). The magnitude of the order parameter in the experiment is almost twice as low as that in the MD simulation. We believe that this discrepancy is due to the fact that the discrimination procedure allows us to identify only 70–80 % of small particles in the experimental data, which results in the artificial “thinning” of the small-particle lanes. The random elimination of 30 % small particles in the MD data decreases down to the experimental level, clearly supporting this hypothesis. Figure 3(b) shows the evolution of the global laning angle for small particles, which exhibits narrow dispersion and demonstrates that the “nematic director” practically coincides with the driving vector. Note the increasing broadening and deflection of seen in experiment at the “steady-state” stage II [coinciding with slight decrease in ], which is related to convergence of small-particle lanes towards the chamber center as the driving force gradually decreases.
(ii) Big particles. In order to diminish possible influence of the boundary effects, we defined fixed regions in the bulk of the big-particle cloud, as indicated in Figs 1 and 2. In terms of the size and shape, these regions approximately correspond to the “overlap regions” used for the analysis of small-particle dynamics.
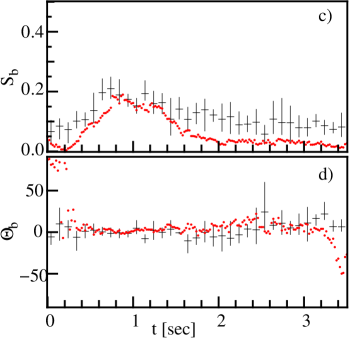
The evolution of the order parameter and of the global laning angle for big particles is shown in Figs 3(c) and 3(d), respectively. Initially, there is no anisotropy in the simulation, whereas in the experiment and , due to a weak inhomogeneity in the big-particle density. Once a cloud of small particles reaches the fixed region used for the analysis, starts growing and the angular distribution narrows around , due to the increasing number of small particles causing the formation of big-particle strings. Then reaches a maximum and starts falling off, reflecting the onset of string relaxation when small particles leave the region. The initial relaxation occurs at a characteristic timescale of s which is an order of magnitude shorter than the self-diffusion timescale for the big particles (). Note that after this rapid relaxation tends to some intermediate plateau, and laning angle keeps the anisotropy, indicating that the structural relaxation is apparently not complete. This suggests that the ultimate equilibration might involve some metastable states.
Thus, binary complex plasmas provide us with crucial new insights into very important dynamical regime of laning, mediating classic undamped fluids and fully damped colloidal suspensions. By combining the experimental studies and the particle-resolved Langevin simulations, we investigated the dynamical onset of lane formation in driven complex plasmas. Furthermore, we proposed a universal order parameter for the characterization of non-equilibrium phase transitions in driven systems. The approach is based on the anisotropic scaling index analysis that is exceptionally sensitive to symmetry changes occurring in particle ensembles. The use of such order parameter could be invaluable in studying the onset of non-equilibrium phase transitions. In particular, this might help us to shed the light into the principal issue about the order of phase transition, characterize possible universality, identify dynamical regimes of structural relaxation, etc. As the immediate next steps, one can think of employing the proposed approach to investigate laning in periodically driven Corte08 and crystalline Roichman07 systems.
We thank J. Dzubiella, R. Monetti, and M. Rex for helpful discussions. This work was supported by DLR/BMWi (grant no. 50WP0203), SFB TR6, and RFBR (grant no. 08-02-00444).
References
- (1) D. Helbing, I. J. Farkas and T. Vicsek, Phys. Rev. Lett. 84, 1240 (2000).
- (2) J. Dzubiella, G. P. Hoffmann, and H. Löwen, Phys. Rev. E 65, 021402 (2002).
- (3) M. E. Leunissen et al., Nature 437, 7056 (2005).
- (4) C. Reichhardt and C. J. Olson Reichhardt, Phys. Rev. E 74, 011403 (2006).
- (5) B. Schmittmann and R. K. P. Zia, Phys. Rep. 301, 45 (1998).
- (6) R. R. Netz, Europhys. Lett. 63, 616 (2003).
- (7) M. Rex and H. Löwen, Eur. Phys. J. E 26, 143 (2008).
- (8) G. E. Morfill et al., New J. Phys. 8, 7 (2006).
- (9) V. E. Fortov et al., Phys. Rep. 421, 1 (2005).
- (10) P. K. Shukla and A. A. Mamun, Introduction to Dusty Plasma Physics (IOP, Bristol, 2001).
- (11) H. M. Thomas et al., New J. Phys. 10, 033036 (2008).
- (12) Droplet formation is governed by different physical mechanisms and will therefore be considered elsewhere.
- (13) Movies of the experiment and simulation can be viewed at http://www.mpe.mpg.de/pke/lane-formation/.
- (14) V. Land and W. J. Goedheer, New J. Phys. 8, 8 (2006).
- (15) A. V. Ivlev et al., Phys. Plasmas 12, 092104 (2005).
- (16) S. V. Annibaldi et al., New J. Phys. 9, 327 (2007).
- (17) A. V. Ivlev et al., Phys. Rev. Lett. 100, 095003 (2008).
- (18) C. Räth et al., Mon. Not. R. Astron. Soc. 337, 413 (2002).
- (19) C. Räth et al., New. J. Phys. 10, 125010 (2008).
- (20) L. Corte et al., Nature Phys. 4, 420 (2008).
- (21) Y. Roichman, V. Wong, and D. G. Grier, Phys. Rev. E 75, 011407 (2007).