Non-LTE modeling of the near UV band of late-type stars
Abstract
We investigate the ability of both LTE and Non-LTE models to fit the near UV band absolute flux distribution, , and individual spectral line profiles of three standard stars for which high quality spectrophotometry and high resolution spectroscopy are available: The Sun (G2 V), Arcturus (K2 III), and Procyon (F5 IV-V). We investigate 1) the effect of the choice of atomic line list on the ability of NLTE models to fit the near UV band level, 2) the amount of a hypothesized continuous thermal absorption extinction source required to allow NLTE models to fit the observations, and 3) the semi-empirical temperature structure, , required to fit the observations with NLTE models and standard continuous near UV extinction. We find that all models that are computed with high quality atomic line lists predict too much flux in the near UV band for Arcturus, but fit the warmer stars well. The variance among independent measurements of the solar irradiance in the near UV is sufficiently large that we cannot definitely conclude that models predict too much near UV flux, in contrast to other recent results. We surmise that the inadequacy of current atmospheric models of K giants in the near UV band is best addressed by hypothesizing that there is still missing continuous thermal extinction, and that the missing near UV extinction becomes more important with decreasing effective temperature for spectral classes later than early G, suggesting a molecular origin.
1 Introduction
Short & Lester (1996) and Short & Lester (1994) presented an assessment of the ability of LTE modeling performed with the ATLAS9 code Kurucz (1992a) to fit the near UV band of the Sun and the K1.5-2 III giant Arcturus ( Boo, HR5430, HD124897), respectively. The former paper included an assessment of the quality of various input line lists, and found that the line list that provided the best match to the detailed high resolution near UV solar spectrum allowed too much flux to escape in the near UV band, making the model too bright compared to absolute spectrophotometric measurements in the near UV. The latter paper made the case for a hitherto undiscovered source of continuum thermal extinction in the near UV band of early K giants on the grounds that LTE models and synthetic spectra computed with any line lists, including the most complete ones, predicted significantly more flux in the near UV band than was observed. In the same year as the latter paper, Bell et al. (1994) also examined the ability of various line lists to provide a fit to the near UV band solar spectrum, and concluded that there may still be missing near UV extinction in models of the solar atmosphere.
The LTE studies of Short & Lester (1996) and Short & Lester (1994) were improved by Non-LTE (NLTE) modeling of Arcturus (Short & Hauschildt, 2003) (hereafter Paper I) and the Sun (Short & Hauschildt, 2005) (hereafter Paper II) carried out with the PHOENIX multi-purpose atmospheric modeling and spectrum synthesis code (Hauschildt & Baron, 1999). The results of Paper I and Paper II were that more realistic NLTE modeling only made the near UV band discrepancies found with LTE models by Short & Lester (1994) and Short & Lester (1996) even worse as a result of NLTE over-ionization of Fe I partially lifting the “iron curtain” of near UV Fe I line extinction, thus making models even brighter in the near UV. That Fe I suffers NLTE over-ionization (or, more properly, LTE under-ionization!) in late type stars is not a new result (for, example, see Rutten (1986)), but Paper I and II presented the first quantitative assessment of the effect on solar near UV levels with atomic models of Fe I and Fe II containing over 1000 atomic levels combined, and accounting for non-local multi-species coupling due to over-lapping transitions (shared radiation fields) among dozens of relatively abundant chemical species.
In this paper we investigate two ways of addressing the problem of atmospheric models of late-type stars being too bright in the near UV band: 1) we revisit the suggestion of Short & Lester (1994) that there may be missing continuum thermal extinction in the near UV, but on the basis of NLTE modeling rather than LTE modeling, and 2) we attempt to construct semi-empirical models of the atmospheric temperature structure that more closely match the observed near UV flux levels. We also attempt to map out the dependence of a possible source of missing continuum extinction by investigating its dependence on stellar parameters among an (admittedly) small set of stars for which there is both high quality spectrophotometry that extends into the near UV band, and high quality high resolution near UV band spectra: namely, the Sun (G2 V), Arcturus (K2 III), and Procyon (F5 IV-V, CMi, HR 2943, HD 61421).
2 Near UV band distributions
2.1 Absolute spectrophotometry
2.1.1 The Sun
We have assembled four relatively recent independent measurements of the solar irradiance spectrum in the visible and near UV bands, which are presented in Fig. 1. The four data sets are most discrepant with each other in the near UV band, as described is greater detail below, and, in the case of the data sets of Neckel & Labs (1984), Burlov-Vasiljev et al. (1995) and Lockwood et al. (1992), this may be because the correction for air mass extinction is more difficult in the near UV than in the visible band. The four data gets were re-sampled at the sampling interval of the highest resolution data set, Å (Thuillier et al., 2003), and then each was convolved to the resolution of the most coarsely sampled data-set, at 3500 Å () Å (Burlov-Vasiljev et al., 1995). For this aspect of our investigation, we are concerned with the fit of models to the overall level on the intermediate-band scale, rather than to finer spectral features.
Neckel & Labs (1984) presents a heavily cited construction of the irradiance based on measurements of the disk center intensity spectrum, , combined with Fourier transform spectrometer (FTS) spectra and center-to-limb variation data obtained with the McMath solar telescope at Kitt Peak, and is the data set to which we compared PHOENIX models in Paper II. Their short wavelength data set spans the 3300 to 6300 Å range in intervals of 10 Å.
Like Neckel & Labs (1984), Burlov-Vasiljev et al. (1995) also constructed the irradiance in bands of Å from measurements made in the 3100 to 6850 Å range with the 0.23 m solar telescope at Peak Terskol. They estimate the uncertainty in their measured values to be in the near UV band. They note that their irradiance values are higher in the 3100 to 4000 Å range than those measured by Neckel & Labs (1984) (notwithstanding high frequency oscillations in the comparison at the wavelengths of the Fraunhofer lines) as seen in their Fig. 11, and they conclude that the values of Neckel & Labs (1984) are too low.
Lockwood et al. (1992) measured the irradiance in the 3295 to 8000 Å range in Å bands with the 0.6 m Morgan telescope at Lowell Observatory using pinhole optics to reproduce a stellar-like image of the Sun, and calibrating their measurements against similar measurements of the standard star Vega. They estimate the internal error of their values to be . They also find that their values on wavelength scales wider than that of Fraunhofer lines in the 3500 to 4500 Å range are as much as larger than those of Neckel & Labs (1984), and this discrepancy can clearly be seen in their Fig. 6.
Thuillier et al. (2003) report space based measurements of the near UV and visible band irradiance made with the UV and VIS spectrometers of the SOLSPEC instrument that was part of the ATLAS payloads and the SOSP instrument on board the EURECA satellite. The UV spectra span the 2000 to 3600 Å range in 4 Å intervals, and in the 3400 to 8500 Å range in 10 Å intervals. Their study includes comparisons between the SOLSPEC and SOSP instruments and other space-based measurements that were made at about the same time, and finds agreement among them at the level of less than . A special advantage of this data set in the near UV band compared to the others compiled here is that the correction for air mass extinction is obviated for space-based observations. Thuillier et al. (1998) reports a comparison between the visible band data described in Thuillier et al. (2003) and the data of Neckel & Labs (1984), and panel e) of their Fig. 2 and their Table V also show that their values are larger than Neckel & Labs (1984) in the 3500 to 4000 Å region.
2.1.2 Arcturus and Procyon
Burnashev (1985) presents a compilation of distributions of a large sample of stars, including 1) their own measurements made at the Crimean Astrophysical Observatory, 2) measurements from the “Sternberg spectrophotometric catalogue” (see Glushneva et al. (1984) and references therein) consisting of data taken from 1970 to 1984 with the 40 cm and 60 cm telescopes of the Crimean Station of the Sternberg Astronomical Institute and the 50 cm telescope of the Fessenkov Astrophysical Institute, and 3) measurements of Kharitonov et al. (1978) taken with the 50 cm Cassegrain telescope and spectrum scanner with a photo-multiplier tube taken at the Fessenkov Astrophysical Institute from 1968 to 1986. These data sets all generally cover the range 3200 to 8000 Å with Å or Å, and have been re-reduced to a common spectrophotometric system (the “Chilean system”) by Burnashev (1985). Glushneva et al. (1984) and Kharitonov et al. (1978) state that the internal accuracy of their measurements is . Arcturus and Procyon are among the stars for which data was reported in all three of these sources.
Additionally, for Procyon, which is the brightest of the three objects in the UV band, we were also able to obtain a mid-UV spectrum recorded with the International Ultraviolet Explorer (IUE) space based observatory in the “long wavelength” band (LWR09108 in the NEWSIPS IUE archive). This data set covers the range from 1850 Å to 3350 Å, and provides a check on the ability of the models to fit the distribution at shorter wavelengths.
2.2 High resolution spectroscopy
Sun
Kurucz et al. (1984) obtained a spectral flux atlas of the Sun with the Fourier Transform Spectrometer at the McMath/Pierce Solar Telescope at Kitt Peak National Observatory (KPNO) in the range of 2960 to 13000 Å. The spectral resolution, , is in the near UV, but we have degraded the data set to by convolution with a Gaussian kernel to reproduce a more typical “high resolution” stellar spectrum, and to aid comparison with synthetic spectra computed with a realistic sampling, . The spectrum is useful for the present investigation as long as is sufficiently large for weak spectral lines to be fully resolved. Wallace et al. (1998) independently obtained a full disk spectrum of the Sun with the same instrument and similar value. We also include the latter in our comparison to assess the variance among data sets. We note that the latter spectrum is darker by about 0.02 to 0.05 (where is the continuum flux level) than the atlas of Kurucz et al. (1984) in the cores of some, but not all, strong features such as the CN band head at (see Fig. 5) and the Ca II H and K lines, although the two spectra are in close agreement for weaker features, and in the pseudo-continuum. This non-systematic variance complicates the assessment of models based on high resolution spectra because it is precisely in the cores of strong features that the role of the continuous extinction manifests itself.
Arcturus
Hinkle et al. (2000) have obtained a high resolution () spectrum with the KPNO Coudé feed telescope and echelle spectrograph. We note that the observed spectrum only covers wavelengths down to Å. Because Short & Lester (1996) concluded that a surprisingly large amount of extra near UV opacity was needed to fit the high resolution photographic spectrum of Griffin (1968), we also incorporate a comparison of the observed spectrum of Griffin (1968) (also of in the near UV) to that of (Hinkle et al., 2000). We find that the two observed spectra are in close agreement, except that in the spectrum of Griffin (1968) strong absorption features tend to be not as deep as those of the spectrum of Hinkle et al. (2000). It should be noted that Griffin (1968) commented on the difficulty and subjectivity of establishing a continuum rectification ( level) in the blue and near UV band as a result of over-blanketing by spectral lines, particularly in the vicinity of the Ca II H and K lines ( and ) as a result of the broad Van der Waals damping wings that affect throughout the 3900 to 4000 Å range. Given the difficulties of calibrating photographic data, and correcting it for background scattered light, as well as the uncertainty in continuum placement, the discrepancy is not surprising. However, given that Short & Lester (1996) based their conclusions on their result that synthetic spectra have spectral absorption features that were too strong, it behooves us to investigate the extent to which that conclusion may be weakened by comparison to the (Hinkle et al., 2000) spectrum.
Procyon
Griffin (1979) have created a high resolution spectral atlas of Procyon in the 3150 to 7500 Å range based on spectra obtained with the Coudé spectrograph of the Mount Wilson 100-inch reflector. We note that, like the spectral atlas of Griffin (1968), the detector was a photographic emulsion. Based on the instrumental profile described in Maeckle et al. (1975), we estimate that in the near UV band (FWHM ). The same difficulty of continuum rectification in the near UV band that was discussed above for the Arcturus spectroscopy also applies to Procyon, as noted in Griffin (1979).
3 Models
3.1 Modeling
We have computed model structures and synthetic spectra for the three program stars that explore a number of variations in the modeling. The details of the modeling are as described in Papers I and II. The same modeling procedure is used for all three objects, except that Arcturus is modeled with spherical geometry because of its lower surface gravity (), whereas the Sun and Procyon are modeled with plane-parallel geometry. We note that our models are in radiative-convective equilibrium (RE), and, thus, do not exhibit chromospheric or coronal heating in their outer atmospheres, which is caused by non-radiative processes. Therefore, our models do not have inversions in the structure, and cannot reproduce near UV spectral features that are chromospheric in origin (eg. the Ca II H & K line cores). However, for Å, the flux in the continuum, and in weak to moderately strong spectral lines, arises from layers of the atmosphere that are well below the depth of temperature minimum, , in semi-empirical chromospheric models of the Sun (see Fontenla et al. (2007) and references therein) and Arcturus (see Ayres et al. (1994) and references therein). Therefore, as long as we avoid any attempt to interpret the fit to the cores of highly opaque lines where the flux arises from the outer atmosphere, then the structure of our models should be relevant to the spectral features being studied. Similarly, our models are static and horizontally homogeneous, and so do not account for the complex spatial and temporal structures on a variety of scales that have been observed in the solar atmosphere. With the exception of sunspots and the granulation pattern, these structures (plages, faculae, Ca II K bright points) exist in the chromospheric layers and are probably related to the non-radiative chromospheric heating mechanism, and, as mentioned above, our models do not account for the chromospheric structure in any case.
3.2 Stellar parameters
In Table 1 we present the values of the stellar atmospheric parameters used in our modeling. Our parameters for Arcturus and the Sun are those of Papers I and II, respectively, and justification for our choices can be found there. We re-iterate here that we have chosen to investigate solar models that are based on the “traditional” abundances, , of Grevesse et al. (1992) rather than the newer abundances of Asplund (2000) derived from horizontally inhomogeneous models for consistency with the horizontally homogeneous solar atmospheric modeling of Kurucz (1992a). Aufdenberg, et al. (2005) recently carried out a simultaneous atmospheric model fit to the spectrophotometric distributions and near IR band interferometry for Procyon, and included multi-component modeling with combinations of synthetic distributions from 1D atmospheric models computed with PHOENIX to approximately simulate the effect of horizontal inhomogeneity. They find best fit values for the stellar parameters of in the range to K, equal to , metallic equal to 0.0, a depth-independent value of the microturbulent velocity dispersion, , equal to km s-1, and a value of the mixing length used in the approximate treatment of convection, , in the range 0.5 to 1.25, where is the pressure scale height. (They also find a value of the radius, , equal to cm.)
3.3 Spectrum synthesis
In every case the modeling is self-consistent in that the atmospheric structure was re-converged before computing the synthetic distribution for that model. For comparison to high resolution spectroscopy, we also produced continuum rectified synthetic spectra by dividing the synthetic distribution by a corresponding synthetic pure continuum distribution computed without line extinction. The synthetic spectra were computed with a sampling, , ranging from 0.015 Å at Å to 0.04 Å at Å , corresponding to a spectral resolution, , of . This ensured that weak spectral lines were at least critically sampled. The spectra were then resampled and convolved with an appropriate kernel to match the value of the observed spectra to which they were being compared.
3.4 Models
Model LTE-big is computed in LTE using the “big” input line list that includes the full set of spectral absorption lines described by Kurucz (1992a), including millions of atomic lines, largely of Fe-group elements, that were theoretically predicted, but have not been observed in the laboratory. Kurucz (1992a) found that this big line list was necessary to provide sufficient line blanketing of the synthetic distribution in the near UV band of a solar atmospheric model to provide a good match to the observed distribution of Neckel & Labs (1984). This is the line list that was used in the LTE modeling presented in Paper II.
Model LTE-small is the same as LTE-big except that the input line list is the “small” list that was used in the ATLAS models of Kurucz prior to the expansion of Kurucz (1992a) described above (see, for example, Kurucz & Peytremann (1975)). This is the line list that was used in the NLTE modeling presented in Paper II, and is the only line list that is consistent with the NLTE models produced with PHOENIX.
Model NLTE is the same as LTE-small except that the coupled NLTE statistical equilibrium rate equations and radiative transfer equation are solved self-consistently for the lowest one to three ionization stages of nineteen astrophysically important light metals up to and including the Fe-group elements. This is the same model as the one designated NLTEFe in Paper II, and the particular species included in the NLTE treatment, and the details of the atomic models used, are those described in Table 1 of that paper.
Model NLTE-extra is the same as model NLTE except that the continuous mass extinction co-efficient, , has been enhanced ad hoc by a factor that differs for each star, as described in Section 3.5.
Model LTE-small-extra is the same as model LTE-small, with the addition of the same amount of extra extinction that was added to the NLTE-extra model. Model LTE-small-extra allows an assessment of NLTE effects in the presence of extra near UV extinction by comparison to the NLTE-extra model with all other variables the same, including the UV sources.
Model NLTE-cool is the same as model NLTE except that the kinetic temperature structure, , has been adjusted, ad hoc, as described in Section 3.6. The Sun was the only object for which this variation was either feasible or necessary.
3.5 Ad hoc extinction enhancement
For each of the program stars, we produce NLTE-extra models by enhancing, ad hoc, the value of the continuous mass extinction co-efficient, , in the wavelength range where the discrepancy with the observed distribution was most severe, which was Å in all cases. The distribution was enhanced in the affected range by adding to the value of , where is the continuum thermal absorption coefficient computed in LTE, and is a -independent ad hoc factor. The expresses the continuum extinction caused by the thermal destruction of photons only, as opposed to scattering extinction; ie. , where, is the continuum scattering extinction coefficient. As a result, this enhancement models the effect of an as yet unaccounted for source of extinction that is purely thermal in that it only destroys and thermally emits photons rather than scattering them. The value of was chosen separately for each program star based on visual inspection of the comparison of the observed and synthetic NLTE distributions, and is reported in Table 2. We note that given the speculative nature of this study, it was not our intention to determine the precise value of that minimizes a statistical measure of the goodness of the fit, but, rather, to investigate whether such an ad hoc enhancement can plausibly improve the fit of NLTE models to both the absolute distribution and the rectified high resolution spectrum.
The models with enhanced were then re-converged before computing the synthetic distribution so that the models are internally consistent. We find that the thermal equilibrium structure of both the Sun and Arcturus, for both LTE and NLTE models, is negligibly affected by enhancement below values of 4200Å because the fraction of the star’s bolometric flux being transferred in the UV band is small. Short & Lester (1994) found the same result for Arcturus with LTE ATLAS9 modeling.
3.6 Ad hoc adjustment
We produce the NLTE-cool model by adjusting the structure of the NLTE model downward in value by an offset, , that has its maximum amplitude, , at the top of the atmospheric model, which effectively has , and decreases linearly in value with increasing standard continuum logarithmic optical depth, , to 0 near standard optical depth unity (), from around which depth the emergent visible and near IR band continuum flux () arises. The temperature offset at each depth in the model is computed as
,
restricted to the range , where the slope, , is given by , and because we are always cooling the atmosphere rather than heating it. The depth range is where alterations to the structure would most clearly amount to changing the de facto value of the model as determined by the measured continuum flux distribution, . Therefore, to maintain some distinction between perturbations of for a model of given and perturbations to the value itself, we restrict alterations to the range. The coupled equation of state (EOS), hydrostatic equilibrium (HSE), and the NLTE statistical equilibrium rate equations, and radiative transfer equation, were reconverged for the resulting model, but with the temperature correction procedure disabled so that a self-consistent model with the new structure was computed, then a synthetic distribution for this model was computed. The value of was chosen by visual inspection of the fit of the resulting synthetic distribution to the observed near UV band values. This procedure is effectively semi-empirical modeling of the atmospheric structure with the near UV band distribution as the sole diagnostic. For the Sun, K. For Arcturus, the most extreme value of that we were able to investigate was 1500 K, and we found that there was no value of that would sufficiently reduce the computed near UV distribution without the structure becoming so extreme that the fit to the well observed visible band distribution was lost, and, for the most extreme values, the population re-convergence became numerically unstable.
4 The Sun
4.1 Spectrophotometric distribution
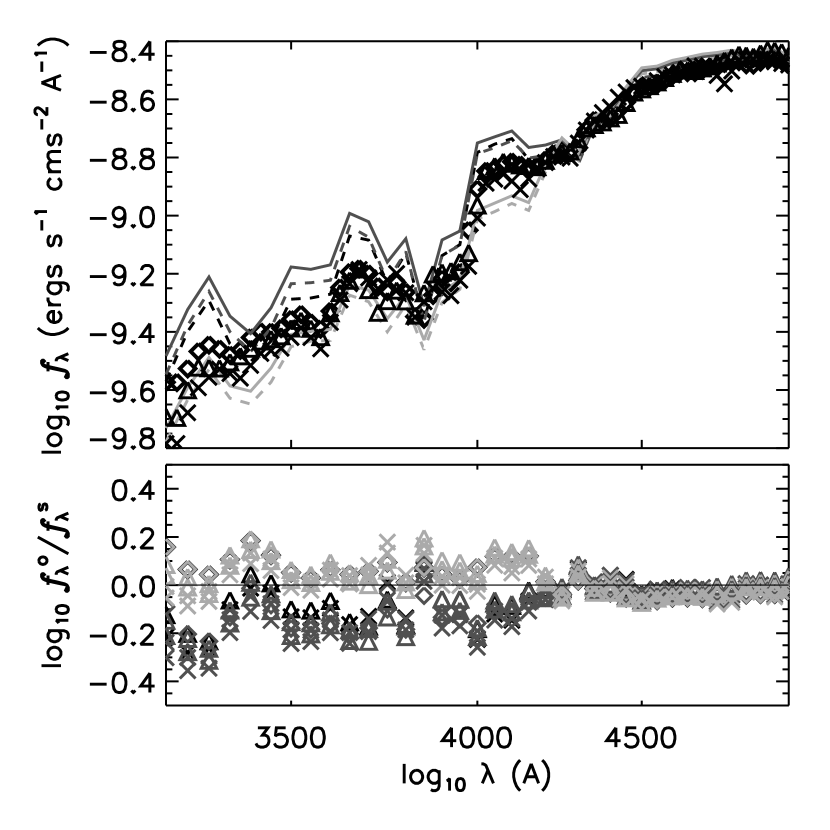
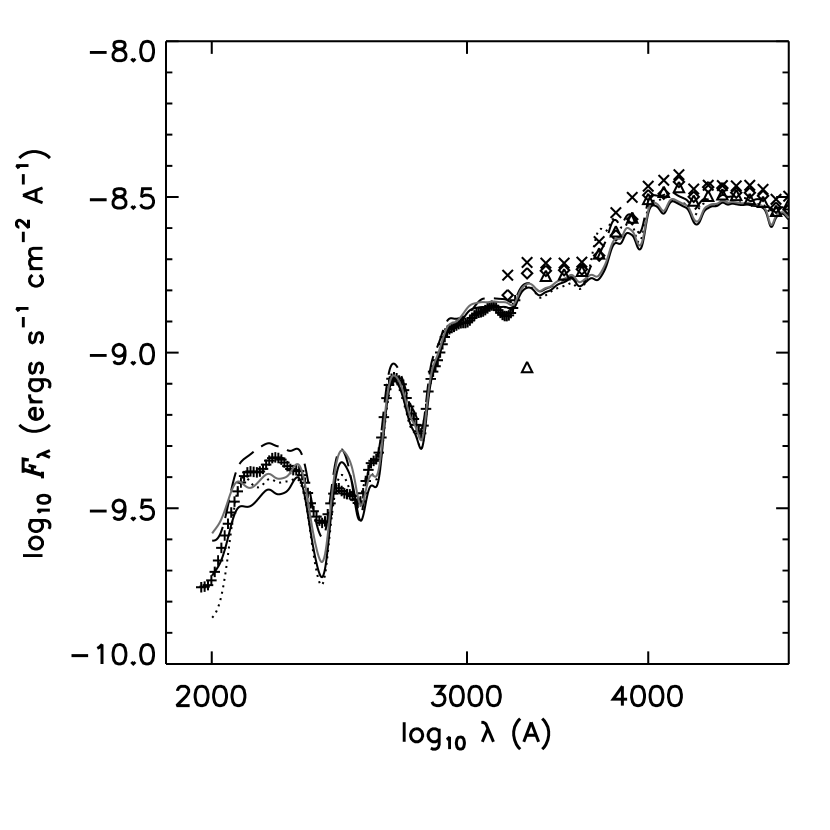
Fig. 1 shows the comparison of all four observed solar distributions with with the computed distributions from models with various treatments of the thermodynamic equilibrium and . Table 3 presents, as a quantitative measure of the relative goodness of fit, the root mean square (RMS) of the deviation of the synthetic from the observed distribution relative to the observed distribution, , computed from interpolated pixel-wise relative deviations in the 3500 to 4000 Å range,
,
where and are the synthetic and observed distributions, respectively, and is the number of elements of the common sampling to which all distributions have been interpolated. The values have been quoted only to the first distinguishing digit.
As reported in Paper II, model LTE-big reproduces the observed relatively well, thus confirming the results of the ATLAS modeling of Kurucz (1992a). Also, as reported in Paper II, the NLTE model significantly over-predicts the values in the near UV band. In Paper II we attributed the entire discrepancy between the values of the LTE-big and NLTE models to NLTE effects, particularly NLTE over-ionization of Fe I by the UV band radiation field. However, a factor that was neglected in Paper II is that their LTE model incorporated the “big” atomic line list of Kurucz (1992a) (ie. their LTE model is the same as our LTE-big model), whereas their NLTE model only incorporates the “small” line list that pre-dated the expansion of Kurucz (1992a). Therefore, some of the difference between the LTE and NLTEFe distributions is caused by the much larger number of lines included in the LTE model compared to the NLTE model.
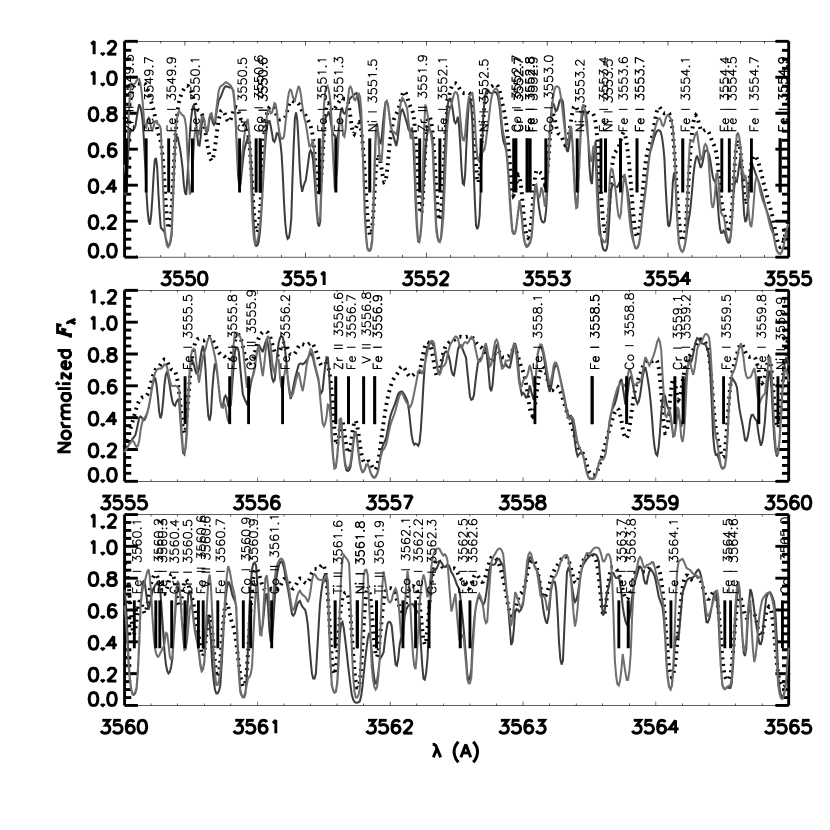
The model atoms used in the calculation of the NLTE line extinction in PHOENIX must be consistent with the line list because any transitions not included in the NLTE statistical equilibrium rate equations are taken from the line list. Therefore, it is not currently possible to compute a NLTE model with the “big” line list with PHOENIX. To remove the choice of line list as a variable, we have computed our LTE-small model, which is more directly comparable to our NLTE model, and to the NLTEFe model of Paper II, than the LTE model of Paper II is. In addition to the requirement of consistency, there is some justification for investigating the fit of models computed with the “small” line list in that the “big” line list has been controversial. The “big” list includes millions of transitions that were theoretically predicted using an approximate treatment of the quantum mechanical atomic physics, and, although these lines improved the broad-band fit to the solar UV distribution, comparison to high resolution solar UV spectra indicate that many of the values and transition energies are inaccurate, and that, moreover, many of the lines in the “big” line list seem to not actually exist (Bell et al., 1994). This very important point is also demonstrated again here in Fig. 2. In general, discrepancies between observed and synthetic spectra may be caused by errors in the values in the line list for individual lines that really exist. However, we note that the careful analysis by Bell et al. (1994) lead them to conclude that the “big” list really does systematically contain many lines of detectable strength that are either unobserved, or are much weaker, in the observed solar near UV and blue spectrum, whereas the reverse is not true, and this is also consistent with our experience. Fig. 2 shows the comparison of the observed rectified high resolution solar spectrum of Wallace et al. (1998) (the spectrum of Kurucz et al. (1984) does not extend down into this range) and synthetic spectra computed with the models LTE-big and LTE-small in the to region. Examples of where the “big” line list leads to synthetic spectra with lines that are either too strong, or are altogether unobserved, are scattered through the near UV band, but this spectral range illustrates a number of easily discernible examples well. This point has been made by both Bell et al. (1994) and Short & Lester (1996), but is important enough to be worth demonstrating here. On the this basis we proceed on the assumption that the “big” line list is less realistic than the “small” line list.
The LTE-small synthetic distribution is also shown in Fig. 1, where it can be seen that it, like the NLTE synthetic distribution, also over-predicts the observed flux, although by not as much. Therefore, the near UV band discrepancy between LTE and NLTE models reported in Paper II is reduced when consistent line lists are used. We conclude that the effect of NLTE Fe I over-ionization, while still significant, is not as large as that reported in Paper II.
In Paper II we concluded on the basis of comparing synthetic distributions to that of Neckel & Labs (1984) that NLTE solar atmospheric models over-predict the near UV band flux by about . However, including other solar irradiance measurements in the comparison weakens this conclusion. Fig. 1 shows that the NLTE synthetic distribution lies at the upper end, but within the range of, the values spanned by the four observed distributions, and is generally consistent with that measured by Lockwood et al. (1992), except for a region around 3500 Å. We also note that the LTE-big distribution, although consistent with the data of Neckel & Labs (1984), is found to lie at the bottom of the range spanned by the four data sets, suggesting that the LTE-big model actually under-predicts the near UV band flux, in contradiction to the conclusions drawn by both Kurucz (1992a) and in Paper II. By contrast, the LTE-small model, being less bright in the UV band than the NLTE model, lies well within the range spanned by the four data sets. This suggests that the “big” line list of Kurucz (1992a) actually contains too much line opacity to reproduce the observed near UV level, which is consistent with the conclusions drawn by Bell et al. (1994) based in high resolution spectroscopy. As a result, given the range spanned by the four data sets, there is no observational basis for claiming that the, presumably more realistic, NLTE model fits better than the LTE-small model, and there is marginal evidence that it provide a worse fit. This speaks to the need for a more precise observational determination of the UV band values. Interestingly, the conclusion of both Kurucz (1992a) and Paper II that the LTE-big model provides the best fit may be due to an unfortunate conspiracy of errors: the observed near UV values of Neckel & Labs (1984) are too low, if one were to assume that the other data sets are more accurate, and, at the same time, the “big” line list contains spurious extra near UV line opacity that produces an LTE synthetic distribution that is also too low, thus apparently providing a good “fit” to the data that under-estimate the true flux level.
As can be seen from Table 3, the NLTE-extra synthetic distribution, by design, provides closer agreement to the dataset of Neckel & Labs (1984), whereas the NLTE model with no additional extinction provides closer agreement to the data sets of Burlov-Vasiljev et al. (1995) and Lockwood et al. (1992). The data set of Thuillier et al. (2003) does not discriminate clearly between the two models. This may be interpreted as marginal evidence for missing near UV band continuous thermal absorption opacity with an enhancement factor, , of approximately 0.15, but, that conclusion depends on which of the observed distributions one uses in the comparison. We note that the NLTE-extra distribution retains the good agreement with observed values at longer wavelengths in the visible band. This is because the fraction of Sun’s bolometric flux passing though the Å region is small enough that the enhancement does not affect the model structure.
For Å, the LTE-small-extra spectrum tracks the LTE-big spectrum closely. This is not surprising given that the value of was tuned to compensate for the lack of line opacity in the ”big” line list so as to restore the good fit to provided by the latter. However, we note that in the region of Å the LTE-small-extra spectrum falls significantly below that of the LTE-big model, indicating that the effect of extra does not exactly mimic that of the additional line opacity in the “big” list. However, we note that we arbitrarily and somewhat crudely made independent of in the 3000 to 4200 Å region, so we should not expect the LTE-small-extra model to reproduce the spectrum of the LTE-big model throughout that entire range.
The existence of additional near UV continuous extinction, if real, could, in principle, affect NLTE models by extinguishing the near UV radiation field that plays such an important role in, among other things, the well-known NLTE over-photo-ionization of Fe I (see, for example, Paper II, Rutten (1986)). An assessment of the impact of on NLTE effects can be made by comparing the synthetic spectra computed with the LTE-small-extra and NLTE-extra models in Fig. 1. We note that, to a first approximation, the difference between the spectra of the NLTE and LTE-small models, and that between the NLTE-extra and LTE-small-extra models, is about the same throughout the 3000 to 4200 Å range. We conclude that the magnitude of is not great enough to significantly alter the character of the NLTE effects on the solar distribution. This may not be surprising given the modest value of (0.15). A more careful and detailed analysis of the impact of on the NLTE equilibrium of the solar atmosphere and on the detailed solar spectrum is beyond the scope of this investigation, but may be warranted if evidence mounts that the source really exists.
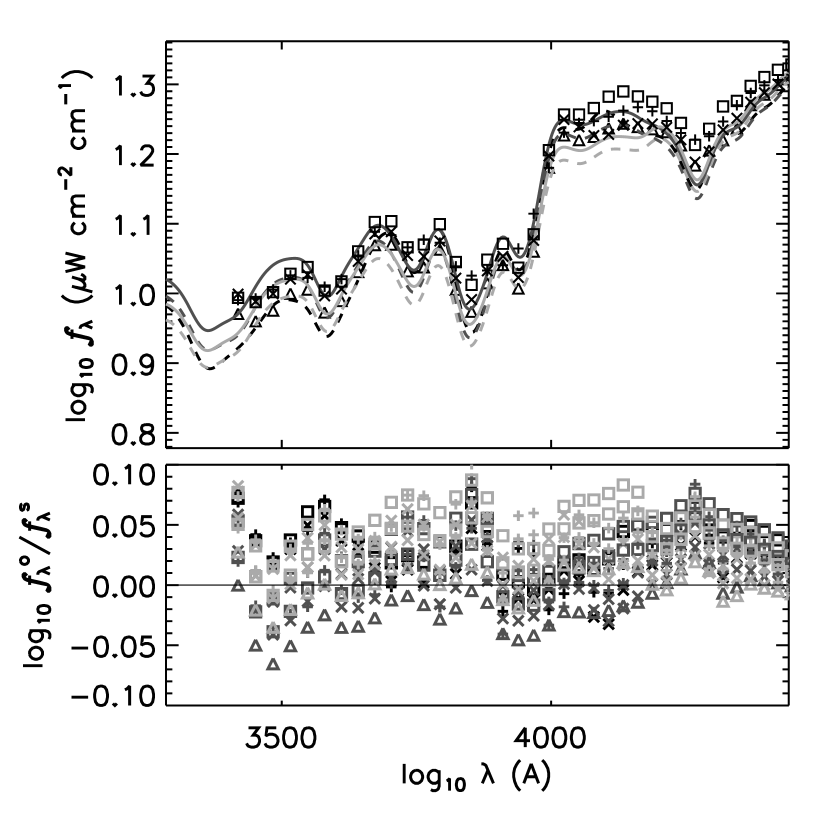
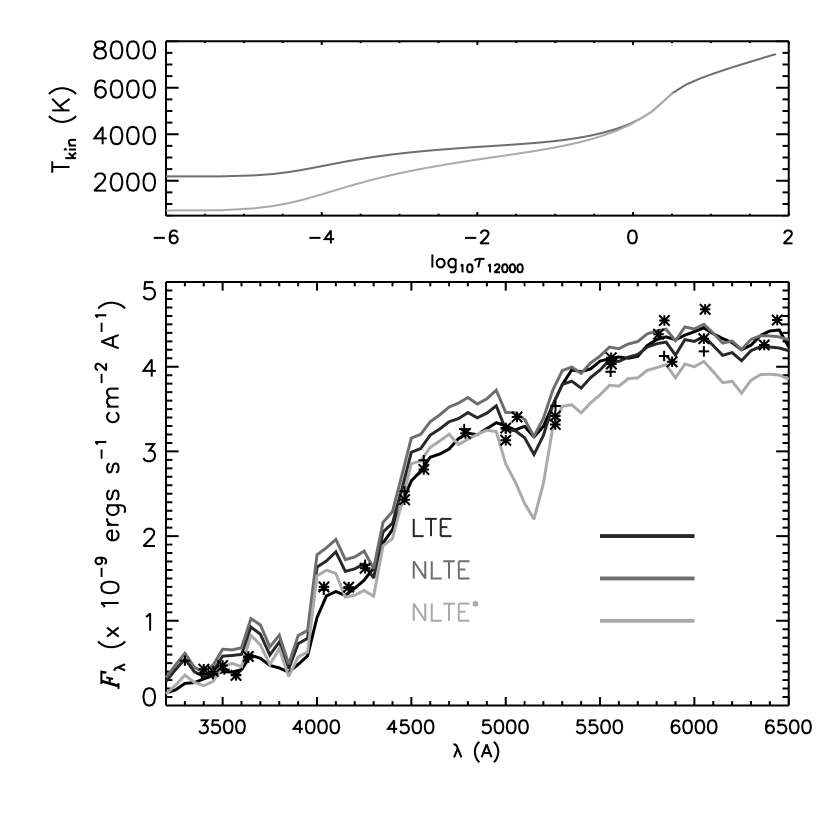
Fig. 3 shows the comparison between observed and synthetic distributions for the LTE-small, NLTE, and NLTE-cool models, and Table 3 also includes values for the comparison of the NLTE-cool distribution to the four data sets. The best fit NLTE-cool model has K, corresponding to a offset from the NLTE model with a slope of K in the range. The NLTE-cool model is, by design, in better agreement than the NLTE model with data of Neckel & Labs (1984), although none of these models is significantly discrepant with the observed values. However at longer values in the visible band the NLTE-cool model significantly under-predicts the observed values, as is expected for a model with a structure that is significantly cooler than standard solar atmospheric models.
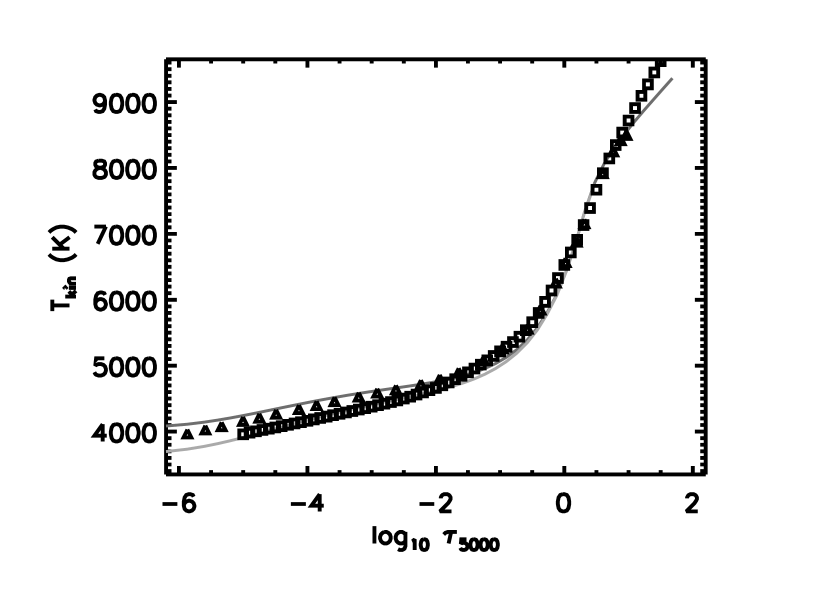
Fig. 4 shows the structures of the NLTE-cool and NLTE models, and, for comparison, the structures of the LTE semi-empirical solar atmospheric models of Holweger & Mueller (1974) and Grevesse & Sauval (1999). The model of Holweger & Mueller (1974) is based on fitting the synthetic high resolution spectrum computed with an LTE model with an ad hoc structure to a variety of spectral features and to the center-to-limb variation of the intensity spectrum, , whereas the model of Grevesse & Sauval (1999) is based on an LTE analysis of the Fe I excitation equilibrium. Note that neither of these models show evidence of the well-known chromospheric inversion that sets in near because both investigators pointedly avoided spectral features that show evidence of chromospheric influence when choosing their fitting diagnostics. Interestingly, the structure of model NLTE-cool is closer to that of Holweger & Mueller (1974) than that of the NLTE model, whereas the the NLTE model structure is closer to that of Grevesse & Sauval (1999).
4.2 High resolution spectroscopy
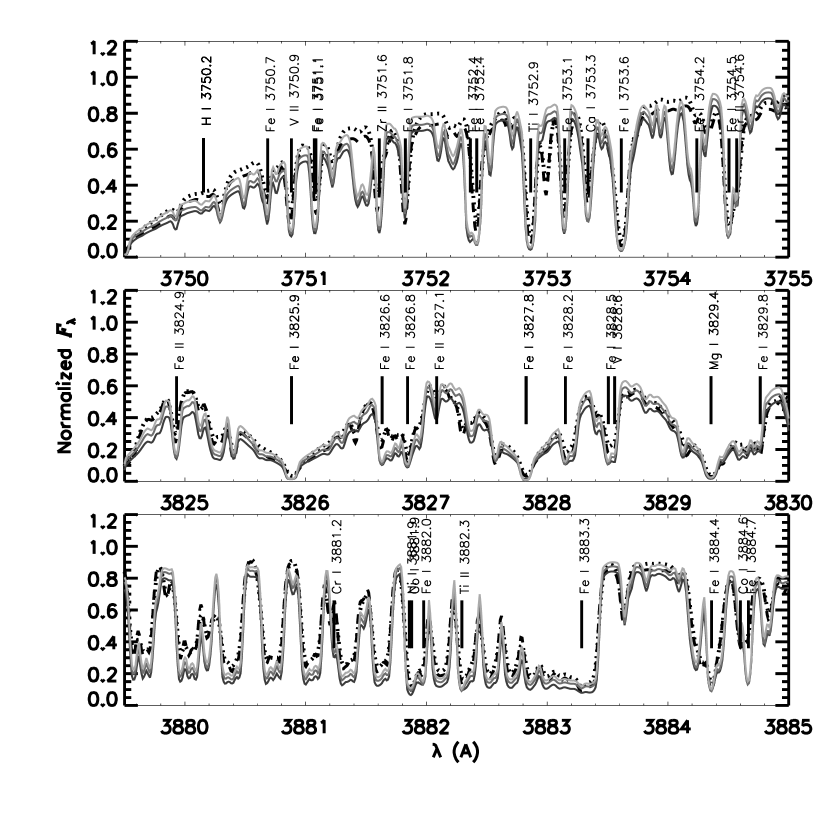
Fig. 5 shows the comparison between the observed rectified high resolution solar spectrum of Kurucz et al. (1984) and synthetic spectra computed with the LTE, NLTE, and NLTE-extra models. We have chosen three regions that demonstrate how varies when varies greatly over a narrow range due to a variety of different opacity sources, such as strongly damped spectral lines from a number of chemical species, and molecular band heads. The value of is small enough that there is only s slight difference between the spectra of the NLTE, and NLTE-extra models, although there is marginal evidence that the latter gives rise to slightly more flux in very strong features, such as some strong atomic lines and the CN band-head.
On balance, the fit to high resolution spectral features does not by itself provide compelling evidence for the existence of missing near-UV band opacity. On the other hand, the addition of continuous opacity in an amount needed to improve the fit to the observed spectrophotometry does not significantly worsen the fit to the high resolution spectrum. Therefore, high resolution spectroscopy does not rule out such missing opacity.
5 Arcturus
5.1 Spectrophotometric distribution
Fig. 6 shows the comparison of the observed distributions to the synthetic spectra computed with models that explore the variation in the treatment of the thermodynamic equilibrium and the value of . Table 4 presents the values for each comparison computed as described in Section 4.1. The synthetic surface flux spectra, , have been geometrically diluted to the flux at Earth, , with an angular diameter for Arcturus, , of 21.0 mas ((Griffin & Lynas-Gray, 1999)), which, as demonstrated in Paper I, provides a good match to the visible and near IR observed distribution. As reported in Paper I, both the LTE-big and NLTE models predict too much flux in the near UV band as compared to all four observed distributions, although the NLTE model is more discrepant with the data than the LTE-big model. As with the Sun, to remove the choice of atomic line list as a variable among the models, we have recomputed the LTE model of Paper I with the “small” line list that the NLTE model also necessarily uses, producing our LTE-small model for Arcturus. As expected, this model is less discrepant with the NLTE model, but, as a result, is even more discrepant with the observed values. As with the Sun, we note that in Paper I we have over-estimated the amount of NLTE UV band brightening by using inconsistent line lists in the LTE and NLTE modeling.
The need for some adjustment to the model that reduces the UV band flux is even more obvious for Arcturus than for the Sun. We have computed a new NLTE model for Arcturus, NLTE-extra, in which the value of is unity, ie. the value of is double that of a standard model. This model provides a close fit to the overall observed level, although the detailed distribution deviates locally from the observed one, most notably around 3400 Å and 4100 Å. NLTE-extra represents a large amount of missing thermal absorption opacity in the near UV band of early K giants. We note that the amount of extra continuous thermal extinction that we require to force NLTE models to agree with observed near UV band spectrophotometry is consistent with the results of Short & Lester (1994), who found on the basis of LTE modeling with the ATLAS9 code that had to approximately double.
The LTE-small-extra spectrum consistently lies just below the NLTE-extra spectrum throughout the 3000 to 4200 Å region, and, as with the Sun, shows a relation to the NLTE-extra spectrum that is similar to that of the LTE-small spectrum to the NLTE spectrum. Again, without performing a detailed analysis of the effect of on the NLTE model, we conclude to a first approximation that the extra extinction does not change the overall character of the NLTE effects on . We note that, in contrast to the solar case, the LTE-small-extra spectrum lies substantially below that of the LTE-big model. For Arcturus, the value of is so large that it more than compensates for the extra extinction provided by the extra lines in the “big” line list. As a result, it is much more clearly the case with Arcturus than with the Sun that the inability of standard models to reproduce the observed near UV flux cannot be addressed by choice of line list.
Peterson et al. (1993) concluded that Arcturus has a non-solar abundance distribution with some -process elements being enhanced by about a factor of two with respect to the overall scaled solar value. We computed NLTE atmospheric models and spectra with the abundances of Peterson et al. (1993) and found that while there were detectable differences among the low resolution distributions computed with the scaled solar and non-solar models, they were much smaller than the the discrepancy between the observed and computed spectra without , and also much smaller than the difference between the flux spectra computed with LTE and equivalent NLTE models. We conclude that the near UV band discrepancy in Arcturus is not caused by inaccurate model abundances.
As with the Sun, we attempted to construct a model, NLTE-cool, for Arcturus, that improves the fit to the observed near UV band values by ad hoc adjustment of the structure. We were able to investigate models with as large as -1500 K, corresponding to a offset from the NLTE model with a slope of K in the range. The K model, shown in Fig. 7, has an upper boundary temperature at of only K, and models with larger values are numerically unstable because the hydrostatic equilibrium solution has negative pressures at some depths. Therefore, the model of K represents the most extreme structure that we were able to produce, and even it does not reduce the predicted values in the near UV to the observed ones, as can be seen in Fig. 7. We conclude that of the two modifications to the model proposed here, an additional source of can more effectively address the discrepancy with observations. Moreover, model NLTE-cool predicts significantly too little flux in the well observed visible band. We note that model NLTE-cool represents the extreme limit of so-called 1.5D modeling of horizontal thermal inhomogeneity in the atmosphere of Arcturus with components that all have K. A semi-empirical component that is significantly cooler than an RE model is still unable to reproduce the observed near UV flux, even when this cool component has a weight of unity in the “1.5D model”. Therefore, we conclude that 1.5D models with a mixture of hotter and cooler components that all have K cannot resolve the near UV discrepancy for Arcturus.
We note that previous authors have also investigated non-radiative cooling in the outer atmosphere of Arcturus to address other observational discrepancies. Ryde et al. (2002) observed H2O vapour lines in the mid-IR spectrum of Arcturus and found that the structure computed with a MARCS model in RE had to be depressed ad hoc by K in the range. However, the model of Ryde et al. (2002) has a boundary temperature of K, 1300 K warmer than our NLTE-cool model, and comes into agreement with the RE model at , at which depth our NLTE-cool model is still K cooler than our RE model. Wiedemann et al. (1994) constructed a semi-empirical structure to account for the observed central flux of the CO near-IR lines. They compared this model to a semi-empirical structure with a chromospheric inversion fitted to chromospheric spectral diagnostics rather than to an RE model. The surprising depth of the CO lines seems to demand a significant alteration to horizontally homogeneous semi-empirical models based on visible and near UV spectral features, yet, even the CO based semi-empirical model of Wiedemann et al. (1994) has a boundary temperature of K at a depth of logarithmic column mass density of (cgs units). This column mass density corresponds to a value of in our model where the value is less than 800 K, which, again, is over 1200 K cooler than the Wiedemann et al. (1994) model. That our NLTE-cool model is so extreme compared to other semi-empirical models with cooled outer atmospheres based on other spectral diagnostics is further evidence that this model is unrealistic.
5.2 High resolution spectroscopy
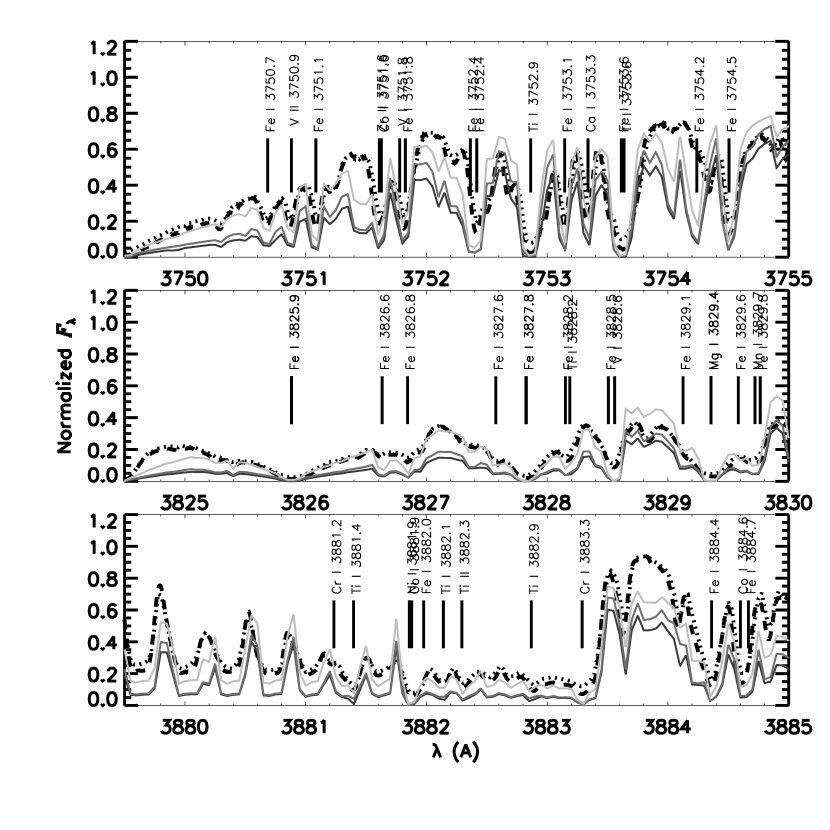
Fig. 8 shows the comparison between the observed high resolution spectra of both Hinkle et al. (2000) and Griffin (1968), and synthetic spectra computed with our LTE, NLTE, and NLTE-extra models for the same spectral regions that were shown for the fit to the Sun. As with the Sun, the strongly damped Fe I lines have slightly brighter wings as a result of NLTE Fe I over-ionization. However, again, the difference is almost negligible for many lines. By contrast with the Sun, the NLTE-extra model produces strong broad spectral features that are significantly brighter, and in much better agreement with the observed spectrum, than either the LTE or NLTE models. This agreement can be seen for strongly damped lines of both Fe I, Mg I, and the CN band head. It is significant that we re-affirm with NLTE modeling the conclusion that Short & Lester (1996) drew with LTE modeling: namely, that the same enhancement of that brings the near UV absolute levels into agreement with the observed values, and also simultaneously brings the strong, broad features in the near UV high resolution spectrum into better agreement with data.
6 Procyon
6.1 Spectrophotometric distribution
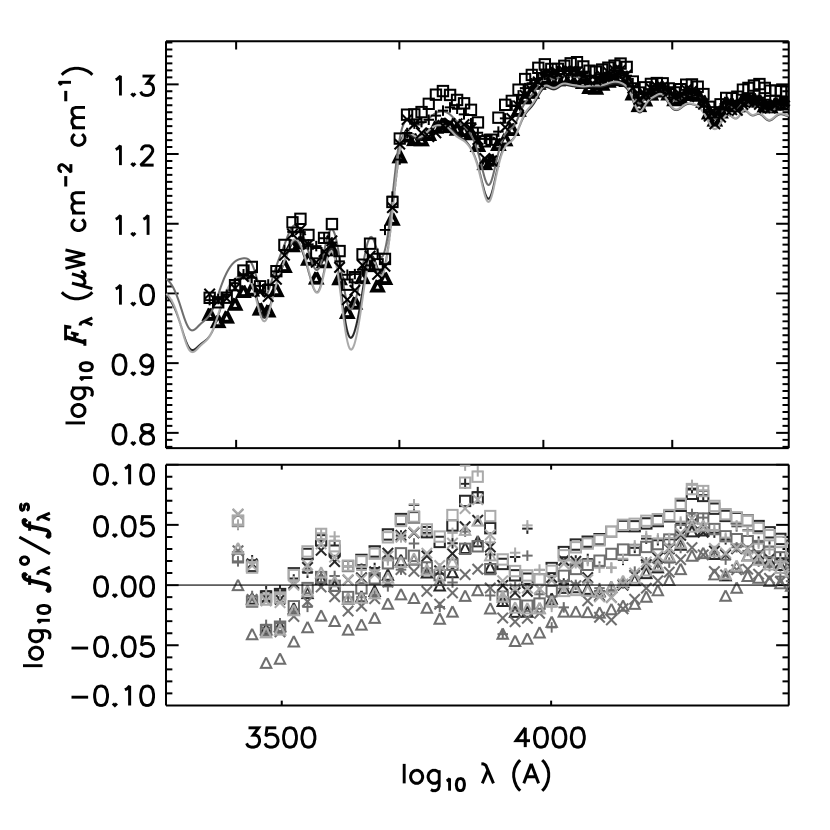
In Fig. 9 we present the comparison between observed and modeled distributions for Procyon. The synthetic spectra have been de-projected to values at Earth using a value of of 5.404 mas Aufdenberg, et al. (2005). The NLTE models agree more closely with the LTE models for Procyon than they do for the Sun or Arcturus, and, by contrast with the results for the Sun and Arcturus, both the LTE and NLTE models match the observed distribution well throughout the near to mid UV band, including the range observed by IUE. If anything, there is marginal evidence that the models predict too little flux in the near UV band. We find no evidence for the need for extra extinction, nor any other adjustment to the modeling, in the case of the hottest program star. We conclude that by values of about that of the Sun, or slightly hotter, the near UV extinction is well reproduced by models, and do not present further discussion of Procyon here.
7 Extinction sources
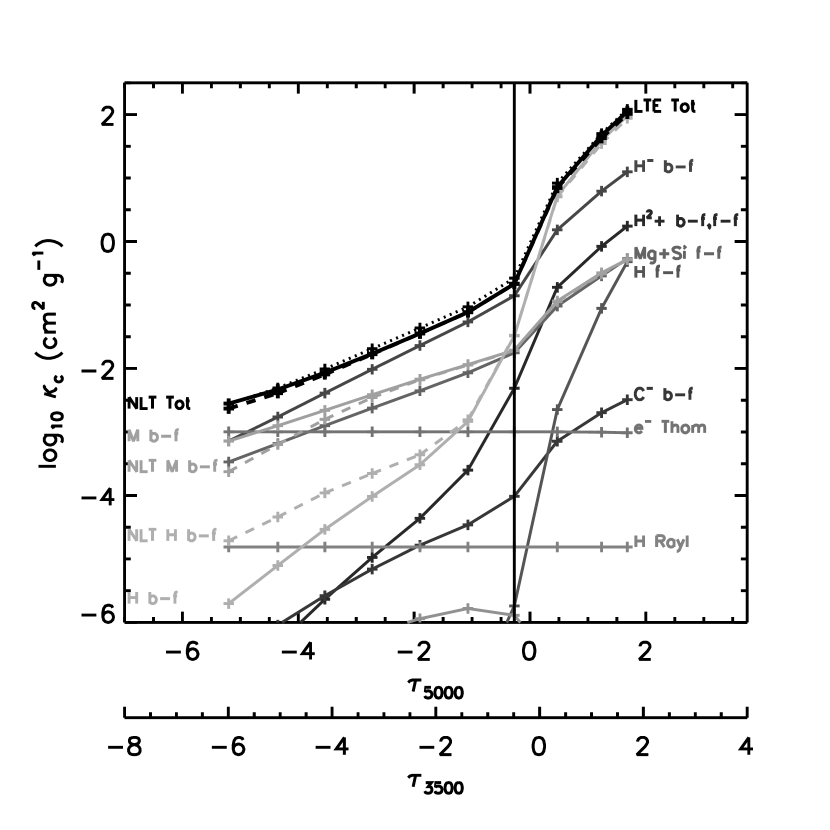
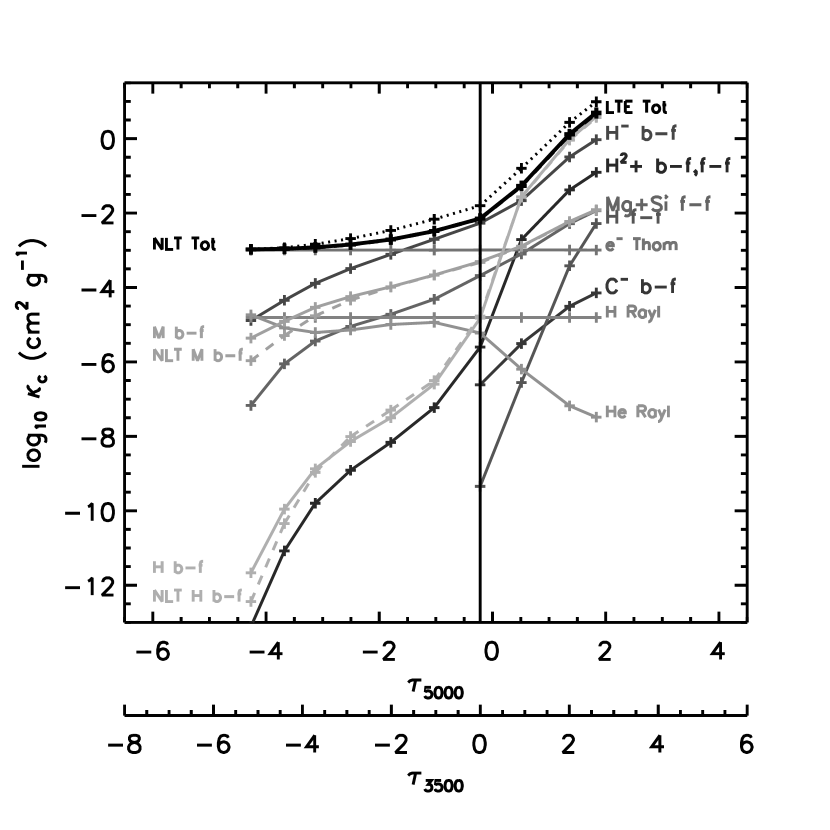
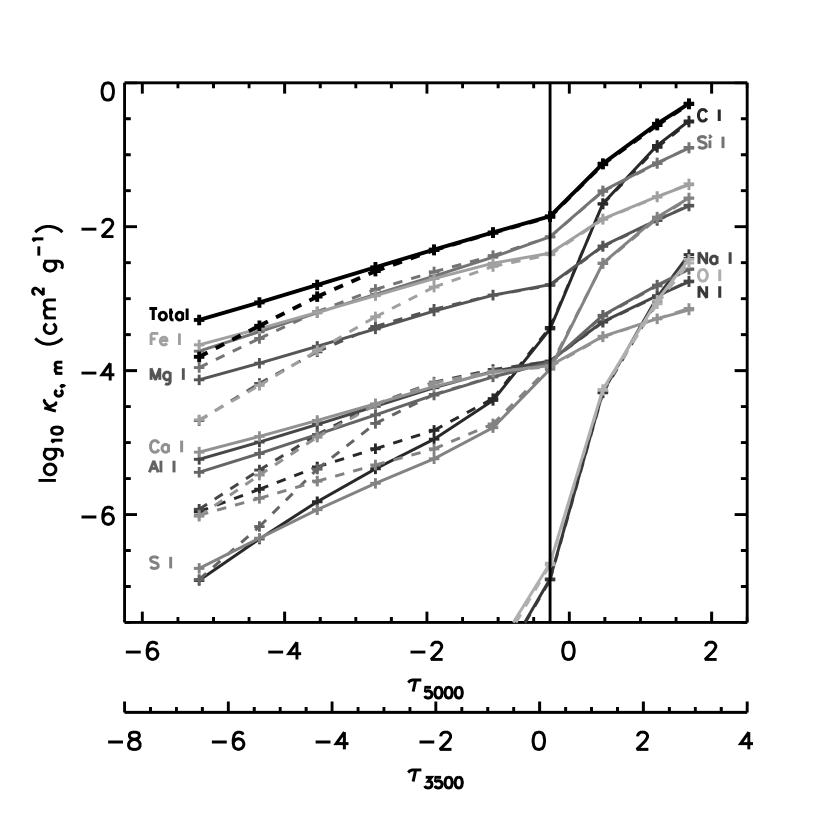
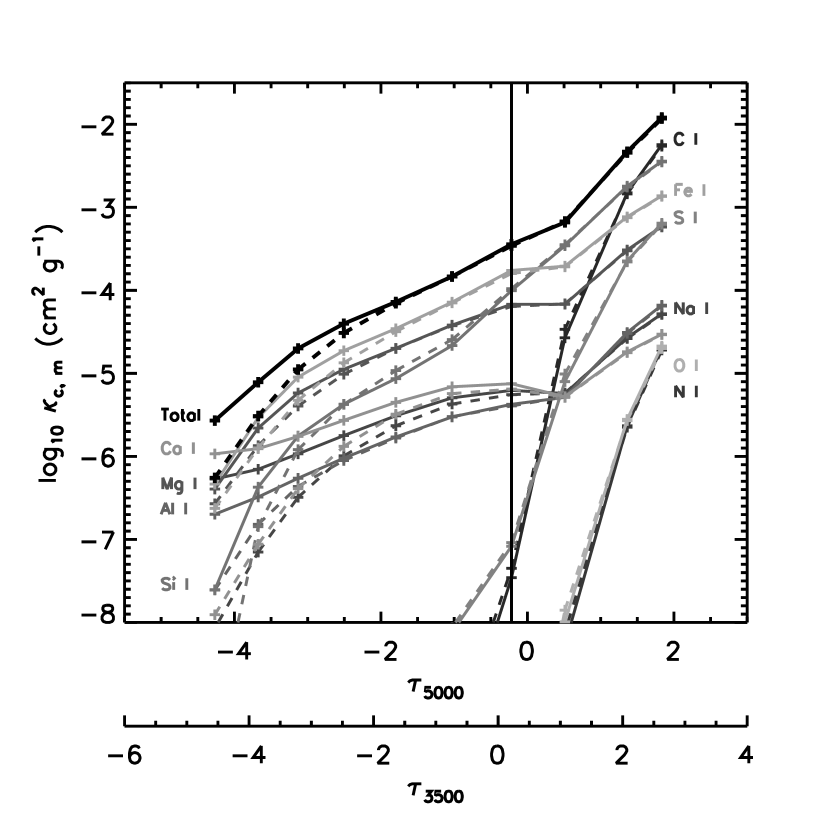
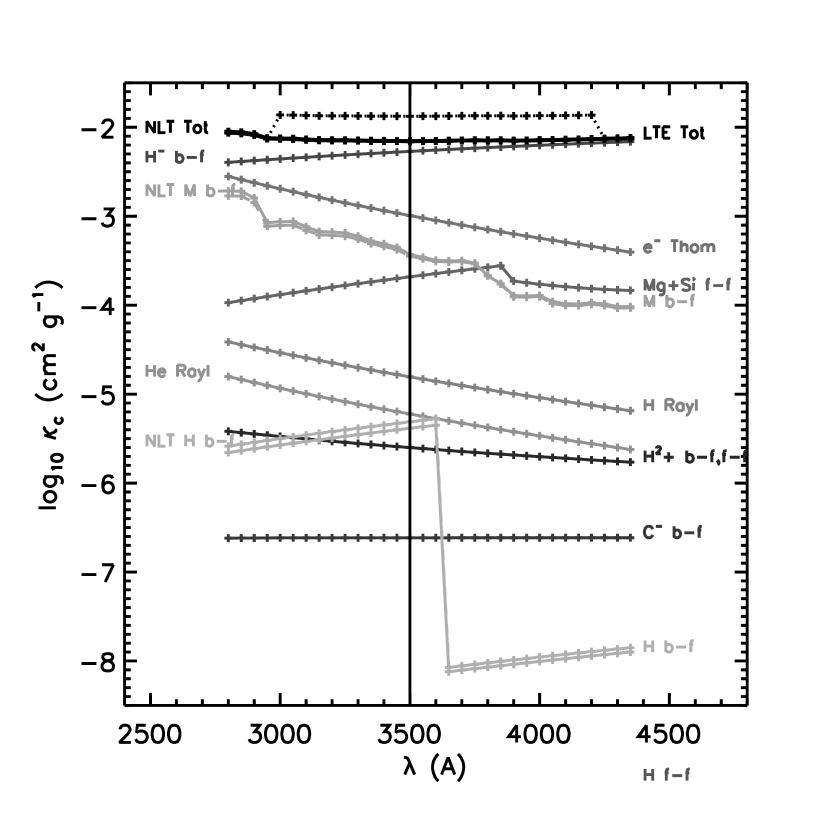
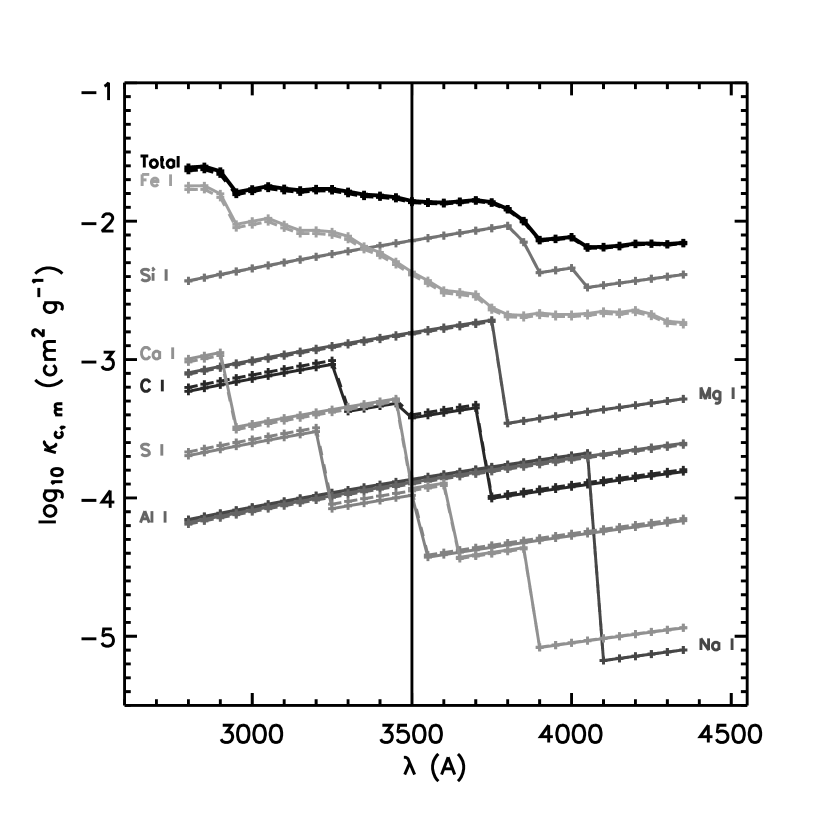
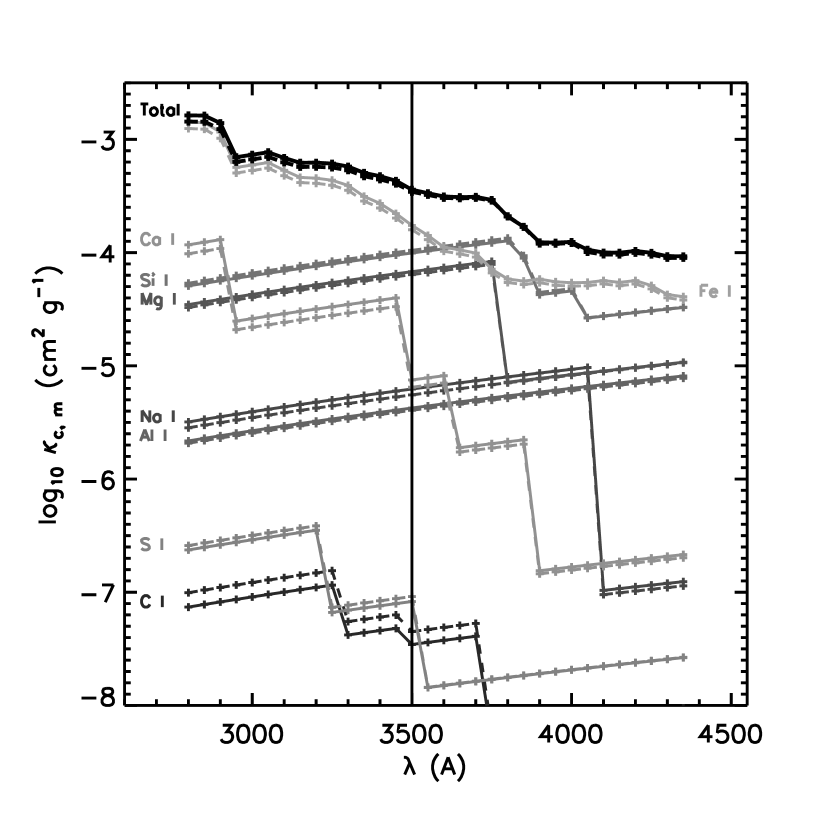
Figs. 10 and 11 show the dependence on the standard depth variable, , of the most important thermal absorption and scattering contributions to for the Sun and Arcturus, respectively, at a value of 3500 Å, near the center of the band for which we are proposing an additional continuous extinction source. We also include the scale among the abscissae so that an assessment of the value of near monochromatic optical depth unity can be made at the relevant wavelength. However, the two scales do not differ greatly for any star. For both scales, we present continuum extinction optical depth, due to both thermal absorption and scattering extinction. To control the size of extinction co-efficient output files, we have only tabulated and plotted the values for ten sample depth points spaced approximately equally at intervals of . To simplify these figures, we have presented the total bound-free (b-f) thermal extinction due to all included metals, (labeled “M b-f”). In Figs. 12, 13 we show the dependence of the contribution of the most important individual metallic species to at the same value for the two stars. Figs. 14 and 15 and Figs. 16 and 17 show the variation of the same quantities with for a value of , close to where the near UV continuum flux arises, with a sampling, , of 25 Å. In all cases, we show the results of both LTE and NLTE calculations for those sources that can be computed in NLTE by PHOENIX. We note that this is the first presentation of continuous extinction by source for a solar or late-type star, computed with thousands of transitions of all astrophysically important light metals and Fe-group elements treated in direct multi-level NLTE.
As expected, for the Sun and Arcturus, both the LTE and NLTE PHOENIX calculations confirm the long known result that the near UV band values are overwhelmingly dominated by H- extinction near continuum optical depth unity. For both the Sun and Arcturus, the H I extinction just begins to rival that of H- at the deepest layer of the model (). For the Sun the total metal extinction, when computed in LTE, and Thomson scattering both rival the H I value at the highest layers of the model (), while for Arcturus, Thomson scattering becomes dominant in the outer atmosphere for . However, these layers are not expected to contribute significantly to the emergent surface flux distribution () in the near UV pseudo-continuum. The H- process is a well understood and accurately computable source, and there seems to be little scope for belief that its value is erroneous by a large enough factor to explain the over-prediction of near UV flux by models.
For those sources that are treatable in NLTE with PHOENIX, we note that, for the Sun, NLTE effects depress the value of the total metal extinction at 3500 Å for by as much as 0.5 dex by , and increase the value of the H I extinction at 3500 Å for by as much as almost one dex by . For Arcturus, the NLTE effects on both the total metal and H values are similar to that for the Sun, except that the NLTE depression of the H extinction begins further out in the atmosphere (). All NLTE values approach the corresponding LTE value near the bottom of the atmosphere, as expected.
Figs. 12 and 13, and 16 and 17, show that the NLTE depression of the total metal extinction in the outer atmosphere is driven by a corresponding depression in the extinction of many, but not all, of the most important individual metallic contributors. For the Sun, these are Si I, C I, and Fe I for . For , they are Fe I and Si I for an LTE calculation, whereas, for a NLTE calculation, Si I is still important, but Mg I rivals Fe I due to the large drop in Fe I extinction in the outer atmosphere as a result of the well-known NLTE Fe I over-ionization. For Arcturus, the important metallic contributors are similar to those for the Sun, except that C I is not important at large depth, and both an LTE and a NLTE calculation show that Fe I and Mg I are important in the outer atmosphere, whereas Si I is not. Paper I and Paper II contain a detailed discussion of NLTE effects on the extinction of metallic elements for Arcturus and the Sun, respectively. However, for both stars, the effect on the total continuum extinction is almost negligible. Therefore, it does not seem likely that the over-prediction of near UV flux is due to the inaccurate or incomplete treatment of NLTE effects in continuum extinction sources (the effect of NLTE on line () extinction, especially that of Fe I, is very significant, as described at great length in earlier literature (see Paper II and references therein), but we are only investigating the role of continuum extinction here). However, as noted above, for none of our models does metallic extinction dominate the near UV total value, so, although these NLTE results for continuum metal extinction may be interesting in their own right, it seems unlikely that inadequacies in their NLTE modeling will be able to account for the failure of NLTE models to correctly predict the observed near UV level in the Sun and Arcturus.
Figs. 10 and 14 show the dependence at Å , and the dependence at , respectively, of the standard continuous extinction, , and the enhanced value, for the Sun, and Figs. 11 and 15 show the same for Arcturus. Because the near UV extinction of both objects is dominated by the same sources, it does not seem likely that the missing source represented by is directly related to any of the extinction sources shown in Figs. 10 through 17. Ie., it does not seem feasible that represents an error in the calculation of any of the standard, well known sources because, presumably, an error of the magnitude required to fit the near UV level of Arcturus () would also have a significant impact on the Sun, whereas for the Sun .
8 Conclusions
One unanticipated conclusion of our investigation is that there is a surprisingly large amount of scatter ( if one includes the Neckel & Labs (1984) data set) in the measured absolute distribution for Å of the Sun. This undermines somewhat our ability to precisely test models of solar type stellar atmospheres, particularly with regard to the calculation of the near UV extinction, . We conclude that a NLTE model based on the ”small” high quality line list with standard extinction is consistent with the observations, and provides an especially good fit to the data of Lockwood et al. (1992) and Burlov-Vasiljev et al. (1995). The fainter near UV band data of Neckel & Labs (1984) can be better fit if one adopts a modest enhancement, , in the Å region. We are unable to compute NLTE models with the “big” line list, but we infer from a comparison of the LTE-small and the NLTE synthetic spectra that such a model would provide a closer match to the observed distribution of Neckel & Labs (1984), thus obviating the need for additional continuum extinction that has been proposed previously on the basis of comparison to that particular data set. However, synthetic spectra computed with the “big” line list have been shown to be more discrepant to with the observed spectrum than those computed with the “small” list. The continuum-rectified high resolution solar spectrum is not sensitive to variations in the value of of the magnitude necessary to reconcile the absolute distribution with observations.
Interestingly, a NLTE model with standard extinction and an ad hoc “semi-empirical” structure that is K cooler at a of , our NLTE-cool model, is also provides a better fit to the observed near UV distribution of Neckel & Labs (1984), and is in good agreement with a much more carefully derived semi-empirical model structure found by Holweger & Mueller (1974). However, the NLTE-cool model provide a worse fit to the well-observed visible band spectrum, and we do not believe that adjustment of the structure of a horizontally homogeneous model is the most compelling resolution of the solar UV flux problem.
The situation is much more clear for the red giant, Arcturus. All models, computed with any line list, grossly under-estimate the observed near UV band absolute distribution in the near UV. The standard must be approximately doubled to match in the Å range. At the same time, the enhancement of also brightens the cores of strong spectra features and the wings of strongly damped spectra lines, thereby improving the fit of the synthetic spectrum to the observed continuum-rectified high resolution spectrum. We conclude that there is compelling evidence that there is still significant extinction missing from the models of early K star atmospheres, and that the missing extinction is probably due to a continuous process rather than line absorption.
Given that the value of in the near UV in both the Sun and Arcturus is dominated by extinction sources that are readily calculated accurately, at least in LTE, namely, H- , and, to a lesser extent at extreme depths or heights, H I , and Thomson scattering, it seems unlikely that the discrepancy between observed and computed near UV levels is due to an inaccuracy in the extinction calculation of known sources, especially in Arcturus where the discrepancy to be accounted for is so large. Although NLTE effects are significant at height for both H I and the total “metal” extinction, the effect of NLTE upon the magnitude of is opposite for these two sources, causing NLTE deviations in the total extinction to cancel out significantly. Moreover, neither of these two sources dominates the near UV level around continuum optical depth unity. Therefore, it seems unlikely that the near UV problem is due to inadequacies in the treatment of NLTE alone, particularly for Arcturus. However, we note that the computation of H- extinction only accounts for NLTE effects indirectly in the contribution of some, but not all, of the H and sources in chemical equilibrium.
By contrast, LTE and NLTE models of Procyon both reproduce the UV band distribution of Procyon down into the IUE LWR range. If anything, there may be marginal evidence that models with standard extinction predict slightly too little flux in the near UV. Admittedly, these three stars provide a sparse set of data points for mapping out the dependence of any inadequacy in standard extinction calculations on stellar parameters. However, what is needed to improve the situation is a much larger set of standard stars for which there is both 1) high quality absolute spectrophotometry, , down to 3500, if not 3000, Å, and high quality high resolution (sufficient to resolve spectral line profiles) continuum-rectified spectroscopy over a broad range in the near UV, at least down to the limit for ground based astronomy ( Å). The sparseness of our stellar sample notwithstanding, comparison of the ad hoc enhancement factor, , for Procyon, the Sun, and Arcturus leads us to conclude that, if the near UV discrepancy is due to an unaccounted for continuum extinction source, then that source becomes increasingly important with decreasing in the MK spectral class range from class mid-F to early K. We note that Short & Lester (1994) did compare the measured distribution of Arcturus with that of two other K1.5-K2 III stars for which good quality data were available (but for which high resolution near UV spectroscopy was not available), and concluded that Arcturus is representative of stars of its spectral class in the near UV band.
The dependence of on suggests a molecular origin, and Short & Lester (1994) proposed the molecular photo-dissociation of metal hydride diatomic molecules that are relatively abundant in the atmospheres of late-type stars and that have lower dissociation energies than more common molecules, often corresponding to values in the 3000 to 4000 Å range. Unlike photo-ionization, photo-dissociation leads to a broad feature without a sharp edge because the upper, pre-dissociation, electronic state has a complex structure. However, this hypothesis is difficult to test quantitatively because values of the cross sections for relevant metal hydride molecules (MgH, SiH, FeH), either measured or calculated, are not reported in the molecular physics literature.
References
- Asplund (2000) Asplund, M., 2000, A&A, 359, 755
- Aufdenberg, et al. (2005) Aufdenberg, J.P., Ludwig, H.-G., Kervella, P., 2005, ApJ, 633, 424
- Ayres et al. (1994) Wiedemann, G., Ayres, T.R., Jennings, D.E., Saar, S.H., 1994, ApJ, 423, 806
- Bell et al. (1994) Bell R.A., Paltoglou G., Tripicco M.J., 1994, MNRAS, 268, 771
- Burlov-Vasiljev et al. (1995) Burlov-Vasiljev, K.A., Gurtovenko, E.A. & Matvejev, Y.B., 1995, Sol. Phys., 157, 51
- Burnashev (1985) Burnashev V.I., 1985, Abastumanskaya Astrofiz. Obs. Bull. 59, 83
- Fontenla et al. (2007) Fontenla, J.M., Balasubramaniam, K. S., Harder, J., 2007, ApJ, 667, 1243
- Glushneva et al. (1984) Glushneva I.N., Voloshina I.B. et al., 1984, Trudy Gosud. Astron. Inst. Shternberga, Vol.54, p.3
- Grevesse et al. (1992) Grevesse, N., Noels, A., Sauval, A.J., 1992, In ESA, Proceedings of the First SOHO Workshop, p. 305
- Grevesse & Sauval (1999) Grevesse, N. & Sauval, A.J., 1999, A&A, 347, 348
- Griffin (1979) Griffin, R. F., 1979, A photometric atlas of the spectrum of Procyon, The Observatory, 99, 140
- Griffin (1968) Griffin, R., 1968, A photometric atlas of the spectrum of Arcturus, Cambridge: Cambridge Philosophical Society
- Griffin & Lynas-Gray (1999) Griffin & Lynas-Gray, 1999, AJ, 117, 2998
- Hauschildt & Baron (1999) Hauschildt, P.H. and Baron, E., 1999, J. Comp. App. Math., 109, 41
- Hinkle et al. (2000) Hinkle, K., Wallace, L., Valenti, J. & Harmer, D., 2000, “Visible and Near Infrared Atlas of the Arcturus Spectrum 3727-9300 A”, San Francisco: ASP
- Holweger & Mueller (1974) Holweger, H. & Mueller, E.A., 1974, Sol. Phys., 39,19
- Kharitonov et al. (1978) Kharitonov, A.V., Tereshchenko, V.M., Knyazeva, L.N., 1978, “Svodniy Spektrofotometricheskiy Catalog Zvezd (Stellar Spectrophotometric Catalog)”, Alma-Ata, “Nauka”, 198pp.
- Kurucz (1992a) Kurucz, R.L., 1992, Rev. Mex. Astron. Astrofis., 23, 181
- Kurucz et al. (1984) Kurucz, R.L., Furenlid, I., Brault, J., Testerman, L., National Solar Observatory Atlas, Sunspot, New Mexico: National Solar Observatory, 1984
- Kurucz & Peytremann (1975) Kurucz, R.L. & Peytremann, E., 1975, SAO Special Rep. 362, pt. 1
- Lockwood et al. (1992) Lockwood, G.W., Tueg, H. & White, N.M., 1992, ApJ, 390, 668
- Maeckle et al. (1975) Maeckle, R., Griffin, R. Griffin, R., Holweger, H., 1975, A&AS, 19, 303
- Neckel & Labs (1984) Neckel, H. & Labs, D., 1984, Sol. Phys., 90, 205
- Peterson et al. (1993) Peterson, R.C., Dalle Ore, C.M., Kurucz, R.L., 1993, ApJ, 404, 333
- Rutten (1986) Rutten, R.J., 1986, in IAU Colloquium 94, Physics of Formation of Fe II lines outside LTE, ed. R. Viotti (Dordrecht: Reidel), p. 185
- Ryde et al. (2002) Ryde, N., Lambert, D.L., Richter, M.J., Lacy, J.H., 2002, ApJ, 580, 447
- Short & Hauschildt (2005) Short, C.I. & Hauschildt, P.H., 2005, ApJ, 618, 926 (Paper II)
- Short & Hauschildt (2003) Short, C. I. & Hauschildt, P. H. , 2003, ApJ, 596, 501 (Paper I)
- Short & Lester (1996) Short, C. I., Lester, J. B., 1996, ApJ, 469, 898
- Short & Lester (1994) Short, C. I., Lester, J. B., 1994, ApJ, 436, L165
- Thuillier et al. (2003) Thuillier, G., Herse, M., Labs, D., et al., 2003, Sol. Phys., 214, 1
- Thuillier et al. (1998) Thuillier, G., Herse, M., Simon, P.C., et al., 1998, Sol. Phys., 177, 41
- Wallace et al. (1998) Wallace, L., Hinkle, K., Livingston, W., 1998, “An atlas of the spectrum of the solar photosphere from 13,500 to 28,000 cm-1 (3570 to 7405 A)”, National Optical Astronomy Observatories: Tucson
- Wiedemann et al. (1994) Wiedemann, G., Ayres, T.R., Jennings, D.E., Saar, S.H., 1994, ApJ, 423, 806
| Object | (K) | (cm s-2) | (km s-1) | ||
|---|---|---|---|---|---|
| Arcturus | 4300 | 2.0 | -0.7 | 2.0 | 2.0 |
| Sun | 5777 | 4.4377 | 0.0 | 1.0 | 1.0 |
| Procyon | 6510 | 3.95 | 0.0 | 2.0 | 1.0 |
| Object | f |
|---|---|
| Arcturus | 1.00 |
| Sun | 0.15 |
| Procyon | 0.00 |
| Data set | |||||
|---|---|---|---|---|---|
| Model | NeckelaaNeckel & Labs (1984) | BurlovbbBurlov-Vasiljev et al. (1995) | LockwoodccLockwood et al. (1992) | ThuillierddThuillier et al. (2003) | All data |
| LTE-big | 0.048 | 0.083 | 0.082 | 0.062 | 0.071 |
| LTE-small | 0.040 | 0.082 | 0.084 | 0.056 | 0.068 |
| LTE-small-extra | 0.059 | 0.118 | 0.123 | 0.093 | 0.102 |
| NLTE | 0.074 | 0.050 | 0.039 | 0.042 | 0.053 |
| NLTE-extra | 0.027 | 0.074 | 0.076 | 0.046 | 0.060 |
| NLTE-cool | 0.048 | 0.092 | 0.093 | 0.066 | 0.077 |
| Data set | ||||
|---|---|---|---|---|
| Model | BurnashevaaBurnashev (1985) | GlushnevabbGlushneva et al. (1984) | KharitonovccKharitonov et al. (1978) | All data |
| LTE-big | 0.25 | 0.32 | 0.34 | 0.30 |
| LTE-small | 0.31 | 0.38 | 0.41 | 0.37 |
| LTE-small-extra | 0.20 | 0.20 | 0.19 | 0.20 |
| NLTE | 0.46 | 0.54 | 0.56 | 0.52 |
| NLTE-extra | 0.12 | 0.15 | 0.14 | 0.14 |