present address: ]Materials Science Division, Argonne National Laboratory, Argonne, Illinois, 60439, USA.
Direct observation of the superconducting gap in phonon spectra
Abstract
We show that the superconducting energy gap can be directly observed in phonon spectra, as predicted by recent theories. In addition, since each phonon probes the gap on only a small part of the Fermi surface, the gap anisotropy can be studied in detail. Our neutron scattering investigation of the anisotropic conventional superconductor YNi2B2C demonstrates this new application of phonon spectroscopy.
pacs:
74.70.-b, 74.72.-h, 63.20.dd, 63.20.kd, 78.70.NxIn their seminal paperAxe and Shirane (1973), Axe and Shirane found that the onset of sueprconductivity in Nb3Sn affects the frequencies and the linewidths of phonons whose energies are comparable to the superconducting energy gap . Similar effects were observed by neutron and Raman scattering in a number of conventional superconductorsShapiro et al. (1975), but also in high- copper oxidesKrantz et al. (1988); Friedl et al. (1990); Pyka et al. (1993); Limonov et al. (1998); Strohm et al. (1998). In many of these cases the authors argued that it was possible to determine whether the phonon energy was above or below from the comparison of phonon frequences and linewidths above and below . Here we show that in the case of strong electron-phonon coupling, the entire phonon lineshape can change dramatically accross allowing a precise determination of .
A few years ago, strong superconductivity-induced changes of the phonon lineshape were reported for a particular phonon in YNi2B2CKawano et al. (1996) and LuNi2B2CStassis et al. (1997), which - for the first time - could not be described by a simple change in the phonon linewidth. This observation stimulated further theoretical workAllen et al. (1997); Kee and Varma (1997). We performed very precise inelastic neutron scattering measurements of many different phonons in YNi2B2C () with a much smaller statistical error covering a much larger region of reciprocal space than in Ref. Kawano et al., 1996.
The neutron scattering experiments were performed on the 1T triple-axis spectrometer at the ORPHEE reactor at LLB, Saclay, and on the PUMA triple-axis spectrometer at the research reactor FRM II in Munich. Double focusing pyrolytic graphite monochromators and analysers were employed in both cases. A fixed analyser energy of allowed us to use a graphite filter in the scattered beam to suppress higher orders. The experimental resolution was obtained from calculations using a formalism checked on phonons with very low coupling strength. The wave vectors are given in reciprocal lattice units of ( ), where Å and Å. The single crystal sample of YNi2B2C weighing 2.26 g was grown by the floating zone method using the 11B isotope to avoid strong neutron absorption. The single crystal sample was mounted in a standard orange cryostat at LLB and in a closed-cycle refrigerator at FRM II, allowing us measurements down to and , respectively.
Figure 1 shows the evolution through of the low temperature lineshape of the phonon at the endpoint of the transverse acoustic branch in the (110) direction. This phonon has never been investigated before but its strong coupling to electrons has been predicted by density functional theoryReichardt et al. (2005). It appears at q = (0.5, 0.5, 0) (the M-point). On cooling from to a temperature just above , this phonon softens by about 10 % and broadens substantially, indicative of a strong electron-phonon coupling (data not shown). However, the lineshape remains Lorentzian to a very good approximation111The theoretical lineshape is not a true Lorentzian, but is very close to a Lorentzian for the case of the M-point phonon.. On further cooling through , the lineshape starts to deviate strongly from a Lorentzian. In particular, a step-like increase at a certain energy appears as the temperature is lowered through (fig. 1, top). increases with decreasing temperature below . According to the theory developed by Allen et al. Allen et al. (1997), a part of the low energy tail which lies below the gap, is pushed up in energy to form a narrow spike at (fig. 1, bottom). The theory is based on the full quantum mechanical treatment of electron-phonon coupling where vibrational and electronic excitations mix into hybrid modes. The finite spectrometer resolution should wash out the spike in experiments resulting in a sharp intensity increase at . The predicted intensity increase corresponds to the one we observe at . We show below that other experimental features are also in an excellent agreement with this scenario. Thus we will interpret our results using the theoretical framework developed in Ref. Allen et al., 1997.
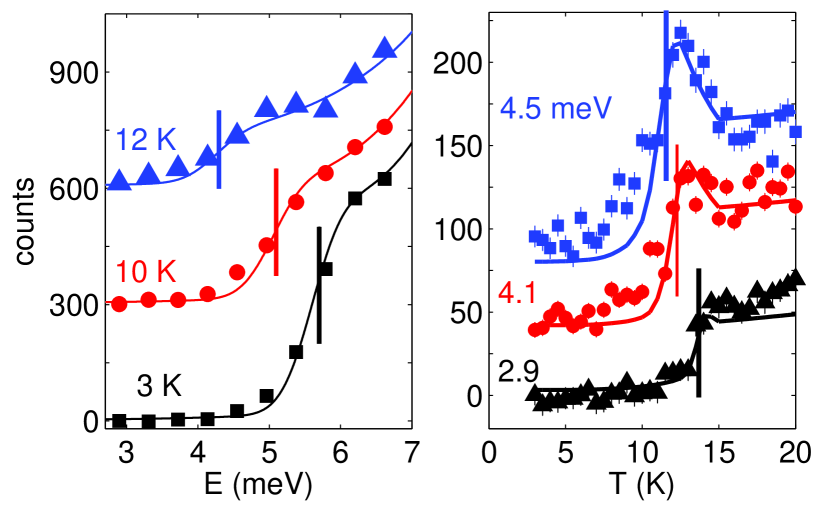
A close comparison of the calculated lineshape with the low energy part of the observed phonon spectral function can give highly accurate values of as a function of temperature (fig. 2, left). Close to , where the step height is small, it is more convenient to scan the temperature at a fixed energy transfer: a sudden intensity decrease on cooling will mark the temperature where the gap is equal to the energy transfer (fig. 2, right).
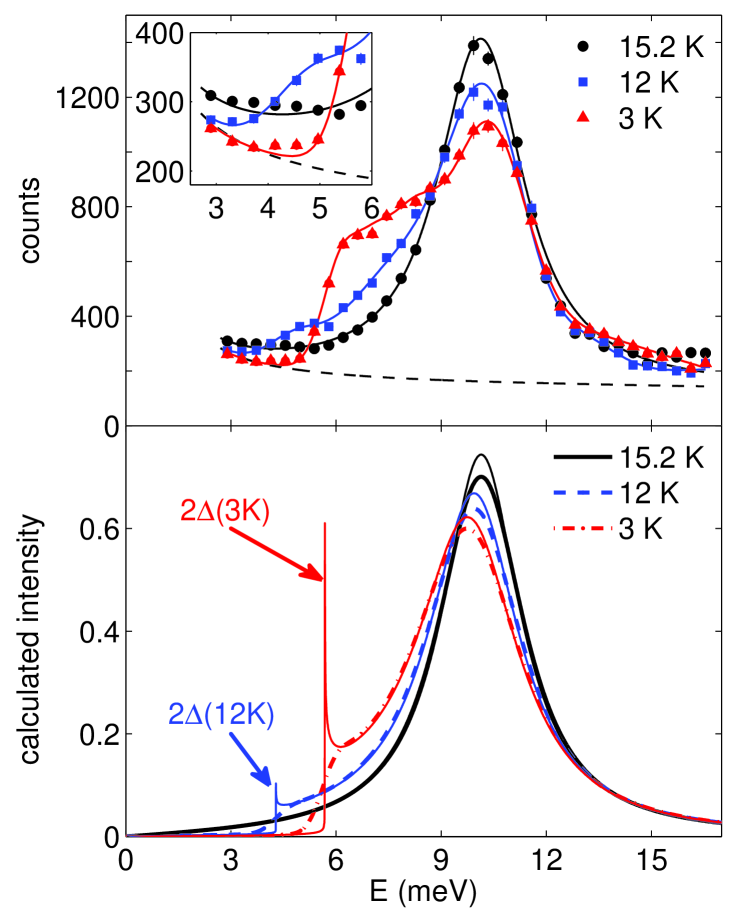
The theory of Allen et al.Allen et al. (1997) predicts not only the suppression of the spectral weight below just mentioned, but also a downward shift of the intensity maximum and an intensity build-up on the low energy side of the peak (fig. 1, bottom). The observed changes are qualitatively similar, but are somewhat stronger than predicted. These discrepancies cannot be remedied by tuning the three parameters of the calculations. Two of them, the phonon energy and the phonon linewidth observed just above , are entirely fixed by the phonon properties in the normal state and the third, the gap value is practically fixed as well by the sharp intensity increase at . Notwithstanding the shortcomings of the actual theory - which might be due to the weak coupling approximation -, it predicts the observed changes with temperature over a wide range of energies remarkably well (fig. 2).
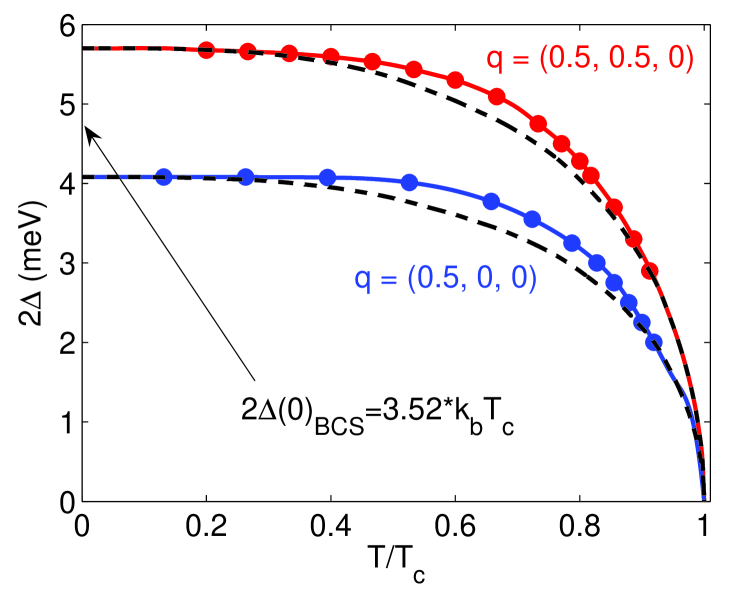
The features in the intensity vs. temperature curves (fig. 2, right) related to the gradual opening of the gap are quite sharp and, therefore, the gap values extracted from the data depend very little on fine details of the model. The temperature dependent gap value deduced in this way is plotted in fig. 4. The experimental curve deviates somewhat from the BCS weak coupling curve, which is not surprising for a superconductor with a as high as . Likewise, the value of the zero temperature gap indicates strong coupling because the ratio ( is the Boltzmann constant) exceeds considerably the weak coupling limit of .
The method of extracting the superconducting gap from phonon lineshapes explained above looks straightforward. Therefore, one might ask why it has not yet been used so far. There are two stringent conditions for making the replica of the superconducting gap clearly visible: the phonon energy has to be considerably larger than but on the other hand, the linewidth in the normal state has to be large enough that the tail of the phonon line extending into the gap region can still be discriminated from the background. One might also think to study phonons with an energy comparable to the gap energy. Here, the superconductivity-induced changes of the phonon lineshape are fairly strong, but extraction of the gap energy is possible only with the help of detailed calculations. An example for such a case is the acoustic phonon in the (100)-direction at wave vector q = (0.5, 0, 0). Profound changes of the lineshape of this phonon were first reported by Kawano et al.Kawano et al. (1996). Puzzled by the appearance of an intense and relatively narrow line below Kawano et al. thought to have found a new sharp excitation. We reinvestigated this phonon and show that the peculiar lineshapes appearing below can be quite naturally understood using again the theory of Allen et al.Allen et al. (1997).
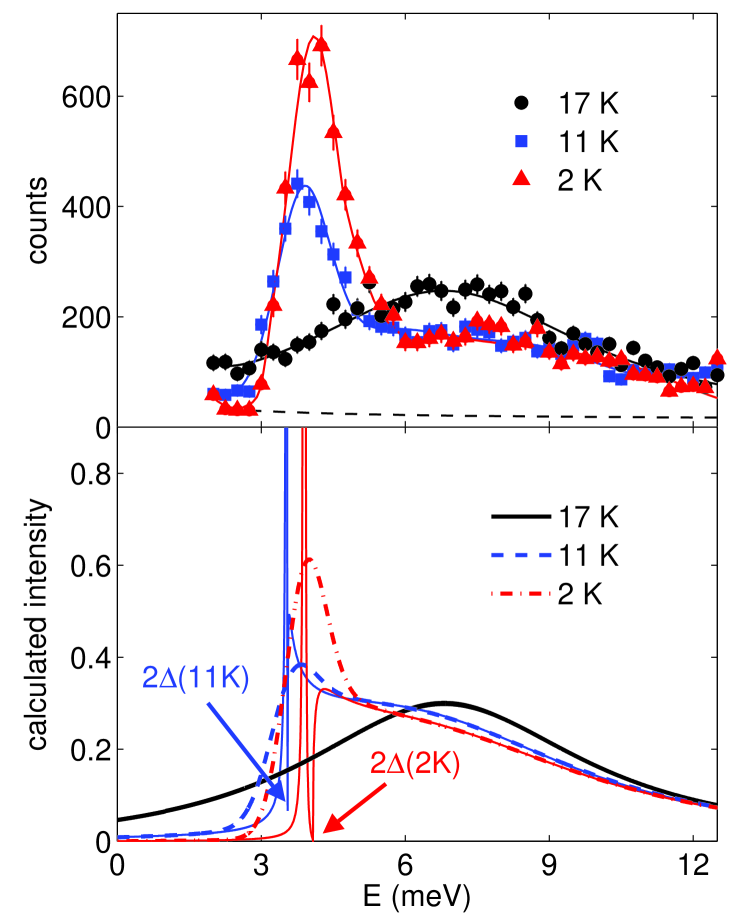
The phonon at q = (0.5, 0, 0) has a significantly lower energy than the M-point phonon discussed above ( as compared to ) and moreover, has a much larger linewidth222The lineshape of this phonon just above is less well described by a Lorentzian because its linewidth is closer to the phonon energy.. As a consequence, the superconductivity-induced redistribution of spectral weight is even stronger, but the superconducting gap cannot be inferred from the data as easily, except for temperatures close to where the gap is still small. For lower temperatures, most of the spectral weight condenses into a fairly sharp peak whose energy is somewhat below the gap. According to Ref. Allen et al., 1997, this resonance can be regarded as a mixed vibrational/superelectronic collective excitation. Its position with respect to has to be determined from calculations for the parameter values of this particular phonon. Again, the theory does not reproduce the observed lineshapes quantitatively, but sufficiently well to precisely determine the gap value (fig. 3).
Previous publicationsAxe and Shirane (1973); Shapiro et al. (1975) observed line narrowing for phonons with an energy smaller than 2. We found that this temperature dependence can be quantitatively accounted for by the theory of Allen et al.Allen et al. (1997). Unfortunately, there are no phonons in YNi2B2C with energies 2, which have a sufficiently strong coupling to search for temperature effects of the linewidth in this compound.
The low temperature lineshapes of the two phonons discussed so far look quite distinct. A study of several phonons along the (100)-direction reveals that the lineshape may take on any intermediate form, depending on the phonon energy relative to the gap and on the normal state phonon linewidth. When going from q = (0.5, 0, 0) towards the zone boundary, the normal state phonon energy increases and the linewidth shrinks. As a result, the low temperature lineshape gradually evolves from that observed at q = (0.5, 0, 0) to that of the M-point phonon (fig. 5, (a)-(c)). Fig. 5 is interesting also for another reason: the superconductivity-induced redistribution of spectral weight involves the optic line at as well with the spectral weight near both peaks transfered to much lower energies near the gap. At these q-points, the acoustic and the optic modes strongly hybridize. Understanding this phenomenon in detail would require a highly nontrivial extension of the theory, which has not yet been made.
When plotting extracted from the various phonons studied
by us, it becomes clear that they probe different energy gaps,
ranging from to more than (figs. 4,
5(d)). Phonons probe the gap on the parts of the Fermi surface
connected by the phonon wave vector. Only theory can tell which
parts are actually involved. Density functional theory
calculations may provide such information, but they require the
technically involved solution of the anisotropic gap equations
including the full momentum dependence of the electron-phonon
coupling, which has not yet been carried out for YNi2B2C. In
special cases, however, the respective parts of the Fermi surface
can be inferred from the Fermi surface topology: for instance, the
extremely large linewidth of the q = (0.5, 0, 0) phonon
can be attributed to a nesting phenomenon predicted by
theoryReichardt et al. (2005).
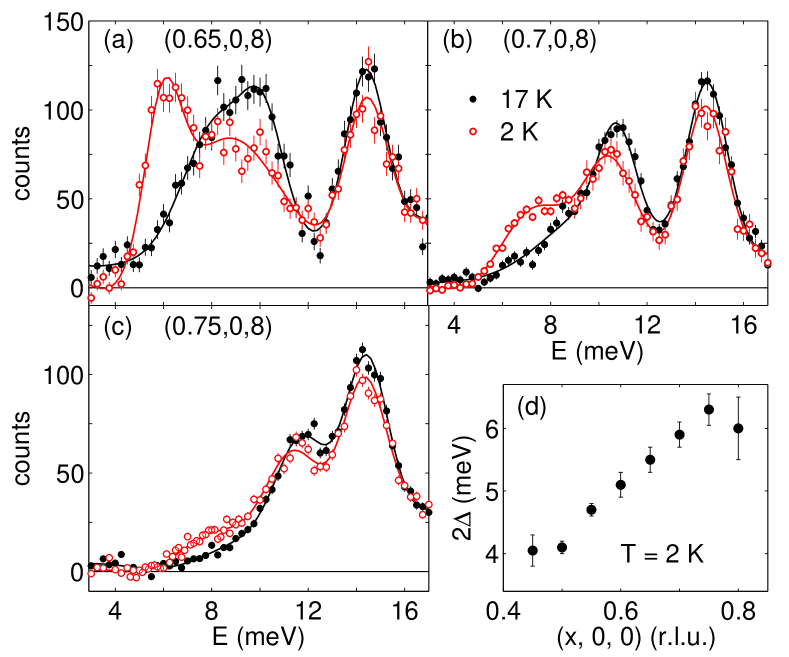
Whereas the intensity step observed at q = (0.5, 0.5, 0) is very sharp, i.e. resolution-limited (), it is significantly broader () at q = (0.7, 0, 0) and (0.75, 0, 0), and therefore cannot be linked to a single, well-defined gap value. In this case the phonon wave vector may connect several different pieces of the Fermi surface probing a superposition of gap values.
Our results for the gap anisotropy in YNi2B2C fit nicely to those extracted from tunnelling data using point-contact spectroscopyBashlakov et al. (2007). Further, the lowest gap seen in our phonon experiments agrees very well with the value derived from critical field dataShulga et al. (1998). On the other hand, we have no evidence that the gap goes below anywhere on the Fermi surface and possibly even to zero, as was proposed on the basis of field-angle-dependent heat capacity measurementsPark et al. (2003) and field-angle dependent thermal conductivity dataIzawa et al. (2002). Extensive energy and wave vector resolved density functional theory calculationsReichardt et al. (2005), which are in very good agreement with experimentWeber et al. , did not show any other suitable phonons in order to further probe the possible presence of nodes.
To conclude, we confirm the prediction of Allen et al. that the phonon line may acquire very peculiar shapes with prominent features directly related to the superconducting energy gap . In contrast to a theoretical propositionKee and Varma (1997), this effect is not restricted to phonons with wave vectors close to an extremum vector of the Fermi surface but may appear throughout the Brillouin zone. The gap value can be directly inferred from the lineshape, often without recourse to a fit. This allows extraction of the gap values as a function of temperature with high accuracy. By studying phonons of different wave vectors, even the gap anisotropy can be explored by phonon spectroscopy. Thus phonon spectroscopy can be a much richer source of information on the superconducting properties than hitherto assumed.
References
- Axe and Shirane (1973) J. D. Axe and G. Shirane, Phys. Rev. Lett. 30, 214 (1973).
- Shapiro et al. (1975) S. M. Shapiro, G. Shirane, and J. D. Axe, Phys. Rev. B 12, 4899 (1975).
- Krantz et al. (1988) M. Krantz, H. J. Rosen, R. M. Macfarlane, and V. Y. Lee, Phys. Rev. B 38, 4992 (1988).
- Friedl et al. (1990) B. Friedl, C. Thomsen, and M. Cardona, Phys. Rev. Lett. 65, 915 (1990).
- Pyka et al. (1993) N. Pyka, W. Reichardt, L. Pintschovius, G. Engel, J. Rossat-Mignod, and J. Y. Henry, Phys. Rev. Lett. 70, 1457 (1993).
- Limonov et al. (1998) M. F. Limonov, A. I. Rykov, S. Tajima, and A. Yamanaka, Phys. Rev. Lett. 80, 825 (1998).
- Strohm et al. (1998) T. Strohm, V. I. Belitsky, V. G. Hadjiev, and M. Cardona, Phys. Rev. Lett. 81, 2180 (1998).
- Kawano et al. (1996) H. Kawano, H. Yoshizawa, H. Takeya, and K. Kadowaki, Phys. Rev. Lett. 77, 4628 (1996).
- Stassis et al. (1997) C. Stassis, M. Bullock, J. Zarestky, P. Canfield, A. Goldman, G. Shirane, and S. M. Shapiro, Phys. Rev. B 55, R8678 (1997).
- Allen et al. (1997) P. B. Allen, V. N. Kostur, N. Takesue, and G. Shirane, Phys. Rev. B 56, 5552 (1997).
- Kee and Varma (1997) H.-Y. Kee and C. M. Varma, Phys. Rev. Lett. 79, 4250 (1997).
- Reichardt et al. (2005) W. Reichardt, R. Heid, and K.-P. Bohnen, J. Superconductivity 74, 0896 (2005).
- Bashlakov et al. (2007) D. L. Bashlakov, Y. G. Naidyuk, I. K. Yanson, G. Behr, S.-L. Drechsler, G. Fuchs, L. Schultz, and D. Souptel, J. Low Temp. Phys. 147, 335 (2007).
- Shulga et al. (1998) S. Shulga, S.-L. Drechsler, G. Fuchs, K.-H. Mueller, K. Winzer, M. Heinecke, and K. Krug, Phys. Rev. Lett. 80, 1730 (1998).
- Park et al. (2003) T. Park, M. B. Salamon, E. M. Choi, H. J. Kim, and S.-I. Lee, Phys. Rev. Lett. 90, 177001 (2003).
- Izawa et al. (2002) K. Izawa, K. Kamata, Y. Nakajima, Y. Matsuda, T. Watanabe, M. Nohara, H. Takagi, P. Thalmeier, and K. Maki, Phys. Rev. Lett. 89, 137006 (2002).
- (17) F. Weber, L. Pintschovius, A. Kreyssig, W. Reichardt, D. Reznik, and K. Hradil, to be published soon.