Mid-infrared VISIR and Spitzer observations of the surroundings of the magnetar SGR 1806-20††thanks: Based on observations carried out at the European Southern Observatory under programmes ID 075.D-0773 and 077.D-0721 (P.I. S. Chaty).
Abstract
Context. SGR 1806-20 is the soft gamma-ray repeater that exhibited the highest activity since its discovery, including a giant flare in 2004, December 27. Previous studies of this source - which is likely a magnetar - showed that it was associated with a massive star cluster embedded into a gas and dust cloud. Moreover, several stars in the cluster are peculiar hypergiants - luminous blue variable (LBV) and Wolf-Rayet stars - exhibiting strong and likely dusty stellar winds.
Aims. We aimed at studying the mid-infrared emission of the stars associated with the same cluster as SGR 1806-20, to detect variations that could be due to the high-energy activity of the magnetar through interaction with the dust. We also aimed at studying the morphology of the cloud close to the centre of the cluster.
Methods. We carried out mid-infrared observations of SGR 1806-20 and its environment - with the highest spatial resolution in this domain to date - using ESO/VISIR in 2005 and 2006, and we retrieved Spitzer/IRAC-MIPS archival data of the same field. We performed broadband photometry of three stars - LBV 1806-20, a WC9 and an O/B supergiant - on our VISIR images, as well as on the IRAC data. We then built and fitted their broadband spectral energy distributions with a combination of two absorbed black bodies, representing their stellar components, as well as a possible mid-infrared excess, in order to derive their physical parameters.
Results. We show that LBV 1806-20 and the WC9 star exhibit a mid-infrared excess, likely because of the presence of circumstellar dust related to their winds. We also show that only LBV 1806-20 had a variable flux over a period of two years, variability which is due to its LBV nature rather than to a heating of the gas and dust cloud by the high-energy emission of SGR 1806-20. Finally, differences in the intrinsic absorptions of the three stars show an inhomogeneous structure of the density of the gas and dust cloud in the massive star cluster.
Key Words.:
stars: neutron – infrared: stars – dust, extinction – open clusters and associations: general – stars: early-type – stars: individual: SGR 1806-20, LBV 1806-20 – supergiants1 Introduction
Soft gamma-ray repeaters (SGRs) represent a small group - four known objects, three in the Galactic centre and one in the Large Magellanic Cloud - of highly-magnetized exotic pulsars presenting no evidence of binarity. They are characterised by a spin period clustered in the range 6-12 s, and a persistent soft X-ray emission around erg . Their spectra are well-fitted by a combination of a black body (kT0.5-0.6 keV) and a power-law tail (), and they also exhibit short and intense bursts (duration of a few hundred milliseconds) of soft -rays and hard X-rays. Giant flares have also been observed for three of them: SGR 0526-66, SGR 1806-20 and SGR 1900+14. Recently, persistent hard X-ray emission has been detected on SGR 1806-20 (Mereghetti et al. 2005).
As for anomalous X-ray pulsars (AXPs) - proposed to be strongly related to SGRs due to their similar characteristics (Gavriil et al. 2002) - the likely source of their radiative emission is not accretion like for other neutron stars but their very strong magnetic field ( G) (see e.g. Mereghetti et al. 2002; Woods & Thompson 2006, for recent reviews). It is now commonly accepted that SGRs and AXPs are magnetars, i.e. neutron stars whose high-energy emission (persistent and transient) is powered by the decay of a very strong dipole-like magnetic field (Duncan & Thompson 1992; Thompson & Duncan 1995, 1996).
SGR 1806-20 is the SGR that exhibited the highest activity since its discovery (Atteia et al. 1987; Laros et al. 1987). It is located towards the Galactic centre, exhibits 7.47 s pulsations (Kouveliotou et al. 1998) and an 8.3 s s-1 spin-down rate. It entered in an active phase in 2003 and exhibited bursts up to late 2004. Finally, a giant flare (corresponding to erg s-1 for a distance between 8 and 15 kpc) occurred in 2004 December 27 (Hurley et al. 2005), and a remnant radio afterglow allowed an accurate localisation of the source (Gaensler et al. 2005).
LBV 1806-20, a luminous blue variable (LBV), was long believed to be its near-infrared (NIR) counterpart (Kulkarni et al. 1995), but Kaplan et al. (2002) showed that the SGR was 12 away from the LBV using Chandra observations. The accurate localisation of the source, as well as an exhaustive monitoring finally led to the detection of the NIR counterpart of SGR 1806-20 (Israel et al. 2005; Kosugi et al. 2005) by observing a variability correlated to the high-energy emission, as for AXPs, which strengthens the connection between both objects.
The environment of SGR 1806-20 is very young and dusty, and it is then
relevant to observe it at mid-infrared (MIR) wavelengths and search for variabilities correlated to the
high-energy emission. Indeed, Fuchs et al. (1999) and
Eikenberry et al. (2001) showed that it was associated with a massive star
cluster, along with LBV 1806-20. Moreover, this cluster is located
inside the radio nebula G10.0-0.3, powered by the very strong winds of
the LBV (Gaensler et al. 2001). Finally, this radio nebula itself is
associated with the giant molecular complex W31
(Corbel et al. 1997). Corbel & Eikenberry (2004) showed that W31 was resolved into two components, one
at kpc with , and another one at
kpc with ,
and that LBV 1806-20 (and
consequently the massive star cluster, and SGR 1806-20) belonged to the
further component of W3, suggesting a distance of kpc.
Nevertheless, Bibby et al. (2008) recently performed high-resolution near-infrared spectroscopy of O/B and
Wolf-Rayet stars in the cluster to derive their accurate spectral classification. This allowed them -
using both synthetic photometry and isochrone fitting - to derive a distance modulus of mag
for the cluster, which corresponds to a distance of kpc.
In this paper, we report MIR observations - with the highest spatial resolution in this domain to date - of SGR 1806-20 and its environment, carried out at ESO/VLT with VISIR in June 2005 and 2006. We also report archival data obtained at three different epochs between 2004 and 2006 with IRAC and MIPS mounted on Spitzer. Our goal was to detect any MIR variability which could be due to the high-energy activity of the SGR, as well as to study the morphology of the gas and dust cloud in which all sources are embedded.
In section 2, we describe these observations and their analysis. In section 3, we present the broadband spectral energy distributions (SEDs) we built for three sources using the VISIR and IRAC fluxes obtained in 2005 and 2006. For each year, there were no more than three months between the VISIR and the IRAC observations, which allowed us to fit these SEDs to derive the physical parameters of the stars with contemporaneous data from 3.6 m to 11.25 m. In section 4, we analyse the results and discuss the MIR variability, the intrinsic absorption, and the distance of these stars, as well as the MIR emission of SGR 1806-20.
2 Observations and data reduction
2.1 ESO/VISIR data
The MIR observations were carried out on 2005 June 20-22 and 2006 June 29-30 using VISIR (Lagage et al. 2004), the ESO/VLT mid-infrared imager and spectrograph, composed of an imager and a long-slit spectrometer covering several filters in N and Q bands and mounted on Unit 3 of the VLT (Melipal). The standard “chopping and nodding” MIR observational technique was used to suppress the background dominating at these wavelengths. Secondary mirror-chopping was performed in the north-south direction with an amplitude of 16 at a frequency of 0.25 Hz. Nodding technique, needed to compensate for chopping residuals, was chosen as parallel to the chopping and applied using telescope offsets of 16. Because of the high thermal MIR background for ground-based observations, the detector integration time was set to 16 ms.
We performed broadband photometry in three filters, PAH1 (=8.590.42 m), PAH2 (=11.250.59 m), and Q2 (=18.720.88 m), using the large field in all bands (325325 and 0127 plate scale per pixel) in June 2005. In June 2006, we used the large field in PAH1 and PAH2 and the small one (192192 and 0075 plate scale per pixel) in Q2. All the observations were bracketed with standard star observations for flux calibration and PSF determination. The weather conditions were good and stable during the observations.
Raw data were reduced using the IDL reduction package written by E. Pantin. The elementary images were co-added in real-time to obtain chopping-corrected data, then the different nodding positions were combined to form the final image. The VISIR detector is affected by stripes randomly triggered by some abnormal high-gain pixels. A dedicated destriping method was developed (Pantin 2008, in prep.) to suppress them.
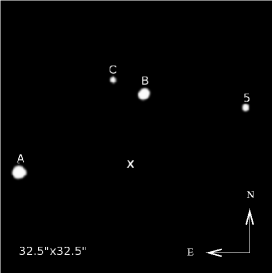
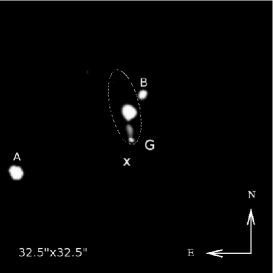
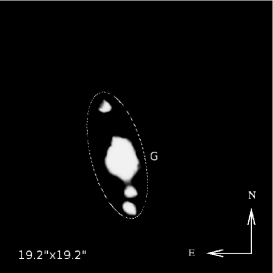
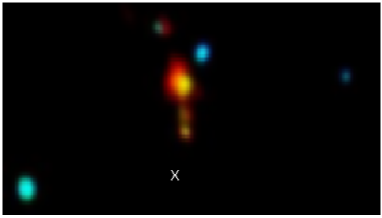
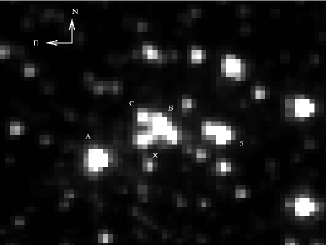
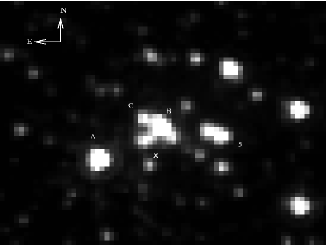
The filtered reduced images of 2006 are displayed in Fig 1. These images were cleaned using the multiresolution software package written by J.L. Starck111http://thames.cs.rhul.ac.uk/multires/mr4-software/index.html and presented in Starck & Murtagh (1998), which performs background and noise modelling, as well as noise subtraction using multiresolution tools. Nevertheless, we performed photometry on the unfiltered images using aperture photometry, and the fluxes in all bands are listed in Table 1. We kept the same labels as Eikenberry et al. (2004, EML04 hereafter) and Figer et al. (2005) for all the detected stars. A is therefore LBV 1806-20, B is a WC9 star, C is an O/B supergiant, and 5 is a Red Giant. Finally, G is a hot and dense part of the gas and dust cloud which is the likely birth site of the massive star cluster, and is only visible in the MIR domain. On June 2005, the exposure time was 600 s in all bands while it was 1200 s in PAH1 and PAH2 and 2400 s in Q2 in June 2006, which explains why we did not detect neither C in PAH1 nor G in PAH2 in June 2005, their fluxes being too low compared to the sensitivity we were able to reach (see Table 1). A three-color image (made with PAH1, PAH2, and Q2 images) is also displayed in Fig 2 and we clearly see that the gas and dust cloud emits mostly beyond 11 m.
 |
 |
 |
 |
2.2 Spitzer/IRAC-MIPS archival data
We searched for MIR public data of the star cluster in the archives of the Spitzer space telescope. We found photometric data taken at three different epochs, 2004 October 29, 2005 September 27, and 2006 April 10, in the Spitzer’s Galactic Legacy Infrared Mid-Plane Survey Extraordinaire (GLIMPSE, Benjamin et al. 2003), survey of the Galactic plane ( and between l=10∘ and l=65∘ on both sides of the Galactic centre), using the IRAC camera in four bands, 3.60.745 m, 4.51.023 m, 5.81.450 m and 8.02.857 m. IRAC plate scale is 12 per pixel and the field of view is 5252. We also found archival MIPS data of the same field at 24 m.
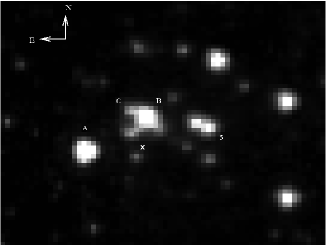
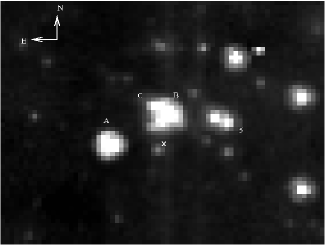
We performed photometry of the stars A, B and C we had detected with VISIR on the post-Basic Calibration Data (post-BCD) using the software StarFinder, part of the Scisoft package from ESO, well-suited for point-source photometry in crowded fields. Post-BCD data are raw data on which the Spitzer pipeline performs dark subtraction, multiplexer bleed correction, detector linearization, flat-fielding, cosmic ray detection, flux calibration, pointing refinement, mosaicking, and coaddition. The images taken in September 2005 are displayed in Fig 3, and fluxes for each epoch are listed in Table 2. Moreover, Fig 4 displays the MIPS image of the same field at 24 m.
3 Absorption and SEDs
3.1 Absorption
The absorption at wavelength , , is a crucial parameter to fit the SEDs, especially in the MIR. Indeed, non accurate values can lead to a false assessment of the dust emission. The visible absorption was a free parameter of the fits. An accurate interstellar absorption law - i.e. the wavelength dependence of the ratio in the line of sight - was then needed to properly fit the SEDs.
From 1.25 m to 8.0 m, we used the analytical expression given in Indebetouw et al. (2005). They derived it from the measurements of the mean values of the color excess ratios from the color distributions of observed stars in the direction of the Galactic centre. They used archival data from the GLIMPSE catalogue, which is relevant in our case. Beyond 8.0 m, where absorption is dominated by the silicate features at 9.7 m and 18.0 m, we used the extinction law from Lutz et al. (1996), which includes the interstellar silicate absorption at 9.7 m. The values we used in each band are listed in Table 3.
3.2 SEDs
With all the observational and archival data from NIR to MIR wavelengths, we built the 2005 and 2006 SEDs of these sources. We fitted them ( minimisation) using a combination of two absorbed black bodies, one representing the companion star emission and one representing a MIR excess, if there was any:
| (1) |
We added to the data uncertainties systematic errors as following:
-
•
a 2 systematic error in each IRAC band as given in the IRAC manual222http://ssc.spitzer.caltech.edu/documents/som/som8.0.irac.pdf,
-
•
comparing the variations of the flux calibration values obtained from the standard stars with VISIR during our observation nights, we figured out that systematic errors were about 5 at 10 and 10 at 20 .
The free parameters of the fits were the absorption in the V band , the companion star black body temperature and its radius-to-distance ratio , as well as the MIR excess spherical component black body temperature and radius and . The best-fitting parameters for individual sources, as well as the corresponding are listed in Table 4, and fitted SEDs of objects A, B and C are displayed in Fig 5.
4 Results and discussion


4.1 The variability of LBV 1806-20
The fluxes listed in Tables 1 and 2 show that LBV 1806-20 is variable in the MIR, in all bands from 3.6 m to 11.25 m. Indeed, The IRAC fluxes substantially increased from October 2004 to September 2005, and then decreased from September 2005 to April 2006 to reach a similar level as in October 2004. Concerning the VISIR fluxes, we unfortunately do not have any data taken in 2004. Nevertheless, the same decrease in the MIR flux is observed from June 2005 to June 2006 in both PAH1 and PAH2.
In a previous spectroscopic and photometric study of LBV 1806-20, EML04 confirmed the likely LBV nature of this star (van Kerkwijk et al., 1995) with spectral classes 09-B2, and showed that there were strong anticorrelated variations of the equivalent widths of He i 2.112 m and Br lines, which led to correlated variations of the star temperature and the number of ionising photons. Moreover, comparison with previous photometry (Kulkarni et al. 1995) showed that the variation of temperature did not result in the variation of the K band magnitude of the star. As a possible explanation, they proposed either an anticorrelated variation of the star temperature and radius, which is typical of some LBV stars (Humphreys & Davidson 1994; Morris et al. 1996), or an increase in the stellar wind density, resulting in more absorbed ultraviolet continuum photons and consequently, more emission lines.
To investigate the origin of the MIR flux variation of LBV 1806-20, and to find out whether it was related to one of the previously described mechanisms or to the heating of the gas and dust cloud by the high-energy emission of SGR 1806-20, we built its broadband SED using 2005 and 2006 IRAC and VISIR data - as well as the NIR magnitudes from EML04, the NIR flux being marginally variable - and fitted it. The best-fitting parameters are listed in Table 4.
The presence of warm circumstellar dust around LBV stars is common (see e.g. McGregor et al. 1988, about AG Car), as they are often associated with ejected dusty nebulae, and a component of warm dust is necessary to explain the huge MIR excess LBV 1806-20 exhibits.
Moreover, the fits suggest a change from a B1 ( K) to a B3 ( K) spectral type, and at least a 20% increase in the stellar radius ( to ) from 2005 to 2006. Meanwhile, the dust temperature decreased by about 10% ( K to K) while the dust radius (decrease of about 7.5% from to ) was roughly constant, considering the uncertainties on the star radius and distance (about 17%).
Under the assumption that a dust grain is a perfect black body - i.e. it fully absorbs the received flux - and that the star emission is not absorbed before reaching the dust, the equation of thermodynamical equilibrium between a dust grain and the star can be written:
| (2) |
where is the dust grain black body emission at the frequency , and the dust grain emissivity, approximated as , where is a constant and (Draine & Lee 1984).
The expected grain temperature can therefore be written:
| (3) |
where and are the Planck and the Boltzmann constants, respectively, the gamma function, and the Riemann zeta function.
By studying the properties of the warm dust around the LBV HD168625, Robberto & Herbst (1998) give - where is the dust grain radius - and find m, consistent with LBVs having large dust grains ( m) in their winds, as shown in Mitchell & Robinson (1986) for Car, and McGregor et al. (1988) and Shore et al. (1996) for AG Car, respectively.
With given in Robberto & Herbst (1998), a large dust grain size m, and as given in Rouleau & Martin (1991), we find K in 2005, and K in 2006, i.e. a decrease of about 6%, in good agreement with what we obtain in our best fits. This is therefore consistent with a MIR flux variation of LBV 1806-20 due to the anticorrelated variations of the star temperature and radius rather than to a heating or a cooling of the gas and dust cloud due to the high-energy activity of SGR 1806-20.
4.2 Stars B and C
B was classified as a WC9 Wolf-Rayet (EML04), and the fluxes listed in
Table 1 and 2 show that its MIR emission was constant in all bands
from 3.6 m to 11.25 m.
We then fitted its SED using the MIR fluxes of 2006 and the NIR magnitudes found in EML04, and the best-fitting parameters are listed in Table 4. Our results suggest that B is extremely
reddened and that it exhibits a very large MIR excess. The presence of such
excess is typical of WC9 stars, whose C rich stellar winds allow the creation of
circumstellar dust. Moreover, Fig 5 shows that beyond 1.6 m (H
band), the star barely contributes to the emission,
which is also common for WC9 stars (van der Hucht et al. 1996; Crowther et al. 2006). All the fits with a more balanced contribution of the stellar and
the dust components (reduced ), or with a
stellar component only (reduced ) failed to reproduce the
SED. Moreover, we point out that although is high, it is still below the sublimation temperature of amorphous carbon found
around WC9 stars (2000 K, see for instance Laor & Draine 1993; Preibisch et al. 1993).
C was found to be either an O/B supergiant or an hypergiant through spectroscopy (EML04), then Figer et al. (2005) performed higher resolution spectroscopy and derived an O/BI spectral class, with narrower lines than previously found. Their result is confirmed by Bibby et al. (2008) who derive a B1B3I spectral type through high-resolution NIR spectroscopy. We unfortunately did not detect C during our first VISIR run in June 2005 as our exposure time was not sufficient, preventing us to perform a comparison with the flux of June 2006. Nevertheless, the IRAC fluxes listed in Table 2 point out towards a constant MIR flux from 2004 to 2006 in all bands. Using the NIR magnitudes given in EML04, as well as the IRAC and the VISIR fluxes of 2006, we fitted its SED and the best-fitting parameters are listed in Table 4.
The best-fitting temperature is typical of an earlyB supergiant star. Moreover, if we assume that the star C is associated with the cluster, it is then possible to get its radius by multiplying the best-fitting radius-to-distance ratio derived from our fit by the distance of the cluster. If we use a distance of kpc given in Corbel & Eikenberry (2004), we derive a radius , while we find for a distance of kpc (Bibby et al. 2008). The latter is more consistent with the expected radius of a normal B1B3 supergiant star, therefore favouring the distance given in Bibby et al. (2008).
Finally, we would like to point out that the three-color image displayed in Fig 2 interestingly suggests that C is associated with the northern part of the gas and dust cloud, since the cloud emission reappears at the supergiant position. If this were confirmed, it would mean that the cloud is heated by C.
4.3 SGR 1806-20
High-energy emission of magnetars is believed to be powered by the magnetic energy of their very strong magnetic field. Moreover, five AXPs and SGR 1806-20 have been detected in the optical bands and/or the NIR, and all of them were found to exhibit a variable NIR emission correlated to the X-ray emission. This optical/NIR emission is explained either as the non-thermal radiation by particles in the magnetosphere, or as the irradiation by the X-ray emission of a fossile passive dust disk around the neutron star.
The second explanation recently received some credit as the AXP
4U 0142+61 has been detected in the MIR using IRAC at 4.5 m and 8
m (Wang et al. 2006). It is shown that its IR
emission can be understood by the presence of an X-ray heated
disk. This disk would have formed from the fallback material of a supernova, and
would emit mostly in the IR consequently to the irradiation by the
high-energy emission of the neutron star. Moreover, the authors derive an
unabsorbed MIR to X-ray flux ratio
, where
FX is the unabsorbed 2-10 keV X-ray flux.
SGR 1806-20 was never detected in the MIR domain, neither with IRAC nor with VISIR, as shown in the images displayed in this paper. Indeed, considering that the MIR emission of SGR 1806-20 would be due to an irradiated fallback disk, and that the unabsorbed MIR to X-ray flux ratio derived in Wang et al. (2006) is typical of dust disks around young neutron stars, we can expect the SGR 1806-20 absorbed flux at 4.5 m to be below 10 Jy, one order of magnitude below the sensitivity of about 200 Jy at 5 of the GLIMPSE survey.
4.4 Absorption
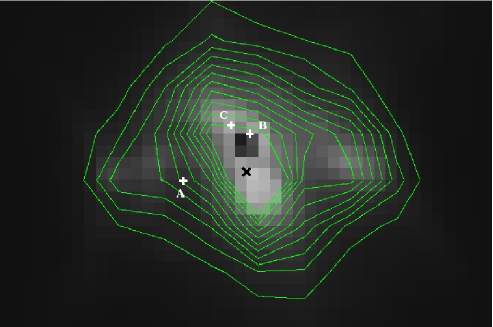
All the intrinsic absorptions derived from our fits show that stars B and C are likely more absorbed than LBV 1806-20, as they are embedded in a hotter and denser part of the associated cloud of dust and gas visible on our VISIR images in PAH2 and Q2 (see Fig 2). Indeed, Fig 4 displays a MIPS image of the environment of SGR 1806-20 at 24 m with contour plots. The Spitzer sensitivity being far better, a larger part of the cloud is visible. We see that LBV 1806-20 (A) is located in a colder and less dense zone than the WC9 star (B) and the B supergiant star (C), which both are closer to the core of the cloud. Note that the image is saturated, and the saturated pixels correspond to the zone of the cloud detected with VISIR (taking into account the difference of plate scale per pixel in both images, 0075 for VISIR and 25 for MIPS). B is then likely very close to the hottest and densest zone of the dust cloud, which is why it exhibits the highest intrinsic absorption. We nevertheless point out that a limitation to this conclusion is that we only see the cloud integrated along the line of sight.
5 Conclusions
We reported the mid-infrared photometry of three stars and the gas and dust cloud associated with the same massive star cluster as SGR 1806-20, using ESO/VISIR and Spitzer/IRAC-MIPS data obtained at different epochs between 2004 and 2006.
We show that LBV 1806-20 is the only object to exhibit a likely MIR variability, and that this flux variation is probably the consequence of its LBV nature rather than a heating of its circumstellar dust by the giant flare exhibited by SGR 1806-20. We also show that the stars in the central zone of the massive star cluster appear more absorbed, as they are closer to the hottest and densest part of the gas and dust cloud in which all of them are embedded.
Finally, we recommend further high-sensitivity and long exposure MIR observations of SGR 1806-20 in order to try to detect it, and perhaps constrain the origin of the AXPs and SGRs optical/IR emission.
Acknowledgements.
We are pleased to thank the anonymous referee for useful comments, as well as E. Pantin for his IDL code - part of the ESO/VISIR reduction pipeline - we used to reduce our VISIR data, and J.L. Starck for his wavelets package we used to clean our images. FR acknowledges the CNRS/INSU for the funding of the third year of his ESO/CEA studentship. This research has made use of NASA’s Astrophysics Data System, of the SIMBAD and VizieR databases operated at CDS, Strasbourg, France, of products from, as well as products from the Galactic Legacy Infrared Mid-Plane Survey Extraordinaire, which is a Spitzer Space Telescope Legacy Science Program.References
- Atteia et al. (1987) Atteia, J.-L., Boer, M., Hurley, K., et al. 1987, ApJ, 320, L105
- Benjamin et al. (2003) Benjamin, R. A., Churchwell, E., Babler, B. L., et al. 2003, PASP, 115, 953
- Bibby et al. (2008) Bibby, J. L., Crowther, P. A., Furness, J. P., & Clark, J. S. 2008, MNRAS, 386, L23
- Corbel & Eikenberry (2004) Corbel, S. & Eikenberry, S. S. 2004, A&A, 419, 191
- Corbel et al. (1997) Corbel, S., Wallyn, P., Dame, T. M., et al. 1997, ApJ, 478, 624
- Crowther et al. (2006) Crowther, P. A., Morris, P. W., & Smith, J. D. 2006, ApJ, 636, 1033
- Draine & Lee (1984) Draine, B. T. & Lee, H. M. 1984, ApJ, 285, 89
- Duncan & Thompson (1992) Duncan, R. C. & Thompson, C. 1992, ApJ, 392, L9
- Eikenberry et al. (2001) Eikenberry, S. S., Garske, M. A., Hu, D., et al. 2001, ApJ, 563, L133
- Eikenberry et al. (2004) Eikenberry, S. S., Matthews, K., LaVine, J. L., et al. 2004, ApJ, 616, 506
- Figer et al. (2005) Figer, D. F., Najarro, F., Geballe, T. R., Blum, R. D., & Kudritzki, R. P. 2005, ApJ, 622, L49
- Fuchs et al. (1999) Fuchs, Y., Mirabel, F., Chaty, S., et al. 1999, A&A, 350, 891
- Gaensler et al. (2005) Gaensler, B. M., Kouveliotou, C., Gelfand, J. D., et al. 2005, Nature, 434, 1104
- Gaensler et al. (2001) Gaensler, B. M., Slane, P. O., Gotthelf, E. V., & Vasisht, G. 2001, ApJ, 559, 963
- Gavriil et al. (2002) Gavriil, F. P., Kaspi, V. M., & Woods, P. M. 2002, Nature, 419, 142
- Humphreys & Davidson (1994) Humphreys, R. M. & Davidson, K. 1994, PASP, 106, 1025
- Hurley et al. (2005) Hurley, K., Boggs, S. E., Smith, D. M., et al. 2005, Nature, 434, 1098
- Indebetouw et al. (2005) Indebetouw, R., Mathis, J. S., Babler, B. L., et al. 2005, ApJ, 619, 931
- Israel et al. (2005) Israel, G., Covino, S., Mignani, R., et al. 2005, A&A, 438, L1
- Kaplan et al. (2002) Kaplan, D. L., Fox, D. W., Kulkarni, S. R., et al. 2002, ApJ, 564, 935
- Kosugi et al. (2005) Kosugi, G., Ogasawara, R., & Terada, H. 2005, ApJ, 623, L125
- Kouveliotou et al. (1998) Kouveliotou, C., Dieters, S., Strohmayer, T., et al. 1998, Nature, 393, 235
- Kulkarni et al. (1995) Kulkarni, S. R., Matthews, K., Neugebauer, G., et al. 1995, ApJ, 440, L61
- Lagage et al. (2004) Lagage, P. O., Pel, J. W., Authier, M., et al. 2004, The Messenger, 117, 12
- Laor & Draine (1993) Laor, A. & Draine, B. T. 1993, ApJ, 402, 441
- Laros et al. (1987) Laros, J. G., Fenimore, E. E., Klebesadel, R. W., et al. 1987, ApJ, 320, L111
- Lutz et al. (1996) Lutz, D., Feuchtgruber, H., Genzel, R., et al. 1996, A&A, 315, L269
- McGregor et al. (1988) McGregor, P. J., Hyland, A. R., & Hillier, D. J. 1988, ApJ, 334, 639
- Mereghetti et al. (2002) Mereghetti, S., Chiarlone, L., Israel, G. L., & Stella, L. 2002, in Neutron Stars, Pulsars, and Supernova Remnants, ed. W. Becker, H. Lesch, & J. Trümper, 29–+
- Mereghetti et al. (2005) Mereghetti, S., Götz, D., Mirabel, I. F., & Hurley, K. 2005, A&A, 433, L9
- Mitchell & Robinson (1986) Mitchell, R. M. & Robinson, G. 1986, MNRAS, 222, 347
- Morris et al. (1996) Morris, P. W., Eenens, P. R. J., Hanson, M. M., Conti, P. S., & Blum, R. D. 1996, ApJ, 470, 597
- Preibisch et al. (1993) Preibisch, T., Ossenkopf, V., Yorke, H. W., & Henning, T. 1993, A&A, 279, 577
- Robberto & Herbst (1998) Robberto, M. & Herbst, T. M. 1998, ApJ, 498, 400
- Rouleau & Martin (1991) Rouleau, F. & Martin, P. G. 1991, ApJ, 377, 526
- Shore et al. (1996) Shore, S. N., Altner, B., & Waxin, I. 1996, AJ, 112, 2744
- Starck & Murtagh (1998) Starck, J.-L. & Murtagh, F. 1998, PASP, 110, 193
- Thompson & Duncan (1995) Thompson, C. & Duncan, R. C. 1995, MNRAS, 275, 255
- Thompson & Duncan (1996) Thompson, C. & Duncan, R. C. 1996, ApJ, 473, 322
- van der Hucht et al. (1996) van der Hucht, K. A., Morris, P. W., Williams, P. M., et al. 1996, A&A, 315, L193
- Wang et al. (2006) Wang, Z., Chakrabarty, D., & Kaplan, D. L. 2006, Nature, 440, 772
- Woods & Thompson (2006) Woods, P. M. & Thompson, C. 2006, Soft gamma repeaters and anomalous X-ray pulsars: magnetar candidates (Compact stellar X-ray sources), 547–586