SN 2001em: Not so Fast
Abstract
SN 2001em is a peculiar supernova, originally classified as Type Ib/c. About two years after the SN it was detected in the radio, showing a rising radio flux with an optically thin spectral slope, and it also displayed a large X-ray luminosity (). Thus it was suspected to harbor a decelerating (by then, mildly) relativistic jet pointing away from us. About years after its discovery the optical spectrum of SN 2001em showed a broad H line, and it was therefore reclassified as Type IIn. Here we constrain its proper motion and expansion velocity by analyzing four epochs of VLBI observations, extending out to 5.4 years after the SN. The supernova is still unresolved 5.4 years after the explosion. For the proper motion we obtain (23,00030,000) km s-1 while our 2 upper limit on the expansion velocity is 6000 km s-1. These limits are somewhat tighter than those derived by Bietenholz & Bartel, and confirm their conclusion that late time emission from SN 2001em, a few years after the explosion, is not driven by a relativistic jet. VLA observations of the radio flux density, at 8.46 GHz, show a decay as starting years after the SN. Collectively, the observations suggest interaction of the SN ejecta with a very dense circumstellar medium, though the implied opacity constraints still present a challenge.
1 Introduction
On September 15, 2001, Papenkova & Li (2001) reported the discovery of an apparent Supernova (SN) in the galaxy UGC 11794, also mistakenly called NGC 7112 (RA: 21h42m22.9s DEC: 12d29m54s; z=0.019493 J2000.0). Throughout the paper we use H0 = 70 km s-1 Mpc-1, and (Hinshaw et al., 2008), for which the measured redshift corresponds to a proper distance of Mpc and an angular distance of Mpc. Early spectral line data suggested it was of type I b/c (more likely Ic) (Filippenko & Chornock, 2001). It was detected in the radio about years after the explosion (Stockdale et al., 2004), initially displaying a rising flux together with an optically thin spectral slope (GHz). It also showed a high X-ray luminosity of at 0.58 keV (Pooley & Lewin, 2004). This made it a good candidate for harboring a bipolar relativistic jet pointing away from our line of sight (Granot & Ramirez-Ruiz, 2004), which has by then decelerated to mildly relativistic velocities. Such late time radio emission is expected in some Type Ib/c SNe that may be associated with gamma-ray bursts (Paczyński, 2001; Granot & Loeb, 2003) or alternatively produce only mildly relativistic bipolar outflows, and could naturally produce a rising radio flux in the optically thin regime (Granot et al., 2002), as the jets interact with the circumstellar medium (CSM) and are decelerated.
Later observations, about years after the explosion Soderberg et al. (2004), showed broad H (FWHM 40 Å = 1800 km s-1) lines that are not typical of Type Ib/c SN. Observations using Very Long Baseline Interferometry (VLBI) were proposed to resolve the source or detect proper motion if it is powered by decelerating relativistic jets (Granot & Ramirez-Ruiz, 2004). However, despite several attempts with various instruments the source has not been resolved (Paragi et al., 2005; Bietenholz & Bartel, 2005, 2007; Stockdale et al., 2005). An alternative explanation was suggested by Chugai & Chevalier (2006), who developed a model in which regular Newtonian ejecta from the supernova explosion collides with a dense, massive circumstellar shell (CS).
In addition to previously published VLBI observations, we add the most recent High Sensitivity Array (HSA) observation from February 2007 (about 5.4 years after the explosion). In order to provide the most accurate measurements and a conclusive picture for the proper motion, as well as the expansion velocity of SN 2001em, we use our observation in combination with those of Stockdale et al. (2004) and Bietenholz & Bartel (2005, 2007).
2 Observations & data reduction
We observed SN 2001em with the HSA, which consists of NRAO’s Very Long Baseline Array (VLBA), the phased Very Large Array (VLA), the Robert C. Byrd Green Bank Telescope (GBT), the Arecibo Radio Telescope (AR), and the Effelsberg Radio Telescope (EB). The observation was conducted on February 5th, 2007 with a total time of 10 hours at 8.4 GHz (bandwidth 32 MHz, total recording bit rate 256 Mbit s-1). VLBI data was correlated with the NRAO VLBA processor at Socorro. Analysis was done with NRAO’s Astronomical Image Processing System (AIPS) and Caltech’s Difmap for modeling. In addition we also used the VLA (in A configuration) observation on February 18th 2007, which observed the continuum of SN 2001em in L, C and K-Band over a total time of about an hour. The three previous VLBA/HSA observations from July 2004 (Stockdale et al., 2004), November 2004 (Bietenholz & Bartel, 2005) and May 2006 (Bietenholz & Bartel, 2007) were re-reduced in a consistent fashion. A summary of the observations is presented in Table 1 including important parameters of these observations.
The data was corrected for ionospheric delay, Faraday rotation, and parallactic angle as well as for Earth’s orientation. We used fringe fitting to calibrate the data for group delay and phase rate. The three datasets from previous VLBI observations have been treated equally, to ensure comparable results. Our VLBI observation of SN 2001em was phase-referenced to JVAS J2145+1115 (1.4∘ away) and J2139+1423 (2.1∘ away). The switching intervals were 180 s for J2145+1115, 93 s for SN 2001em, and 39 s for J2139+1423, which was observed in addition about every 5th cycle. We used J2145+1423 to check our phase reference (J2145+1115) to get a measure for the quality of our phase referencing as well as a position fixed to the International Celestial Reference Frame (ICRF). In addition we used J2139+1423 to check astrometry and over results for possible motion within J2145+1115.
3 Results
3.1 Position and Proper Motion
We obtained the results for absolute position, thus for proper motion, by fitting the fully calibrated and phase-referenced (,) plane data, of the observations from 4 epochs, to a circular Gaussian model. This is a good fit for a point source, as we did not see any resolved extended emission. However, the first VLBI observation from July 2004 does not use J2139+1423 as phase reference check as described above, instead it uses J2139+1316 which is 1.0∘ away from our pointing center. Furthermore only the VLBA was used in this initial observation.
We plot the position including errorbars in Fig. 1. We find a circle with a radius of 0.170 mas that encompasses all the observed positions. This suggests that SN 2001em shows little or no proper motion.
To get an estimate for the error of the proper motion, we plotted the positions of J2139+1423 phase referenced to J2145+1115 as shown in Fig. 2 and Fig. 3, which shows according to our data a proper motion of 0.45 mas year-1 in the northwest direction. Piner et al. (2007) give a relative motion of the 4 components between 0.108 and 0.593 mas year-1 separated up to 3.5 mas from the core. This can be explained by changes in the extended emission of J2139+1423, which shows an extremely curved jet (Savolainen et al., 2006), in combination with any proper motion of the phase check calibrator. The intrinsic motion of J2139+1423 has been determined to be 40 as year-1 (Feissel-Vernier, 2003). We also assume our reference source J2145+1115 to be stationary. Using a linear relationship between the stationary phase center and the apparently moving J2139+1423, that are 3.49∘ apart from each other, we find an error for the proper motion of SN 2001em of 0.184 mas year-1.
This high error is not very satisfactory and yielded unreasonably small values. As shown by Pradel et al. (2006), the linear approach is not reliable. Thus we had to find a better way to obtain a reasonable error for the positions. Using the discussion of astrometric accuracies of VLBA observations by Pradel et al. (2006) and the value of the weighted least squares fit, we were able to reduce the position errors to 0.013 mas and 0.051 mas in R.A. and Dec. respectively. Using a weighted least squares fit for the motion in R.A. and Dec. separately (Fig. 4), we get an error of 0.037 mas year-1 in R.A. and 0.071 mas year-1 in Dec.
We obtained a proper motion of (0.030 0.037) mas year-1 in R.A. and (0.053 0.071) mas year-1 in Dec., which gives a total proper motion of
| (1) |
The proper distance to SN 2001em is 83.14 Mpc, then the proper motion gives us a projected velocity on the sky of
| (2) |
Bietenholz & Bartel (2007) report a proper motion, based on two epochs, of (0.089 0.093) mas year-1 or (33,000 34,000) km s-1, respectively, where for the cosmological parameters we use the latter becomes (35,000 37,000) km s-1.
3.2 Size Limits of the Radio Emitting Region
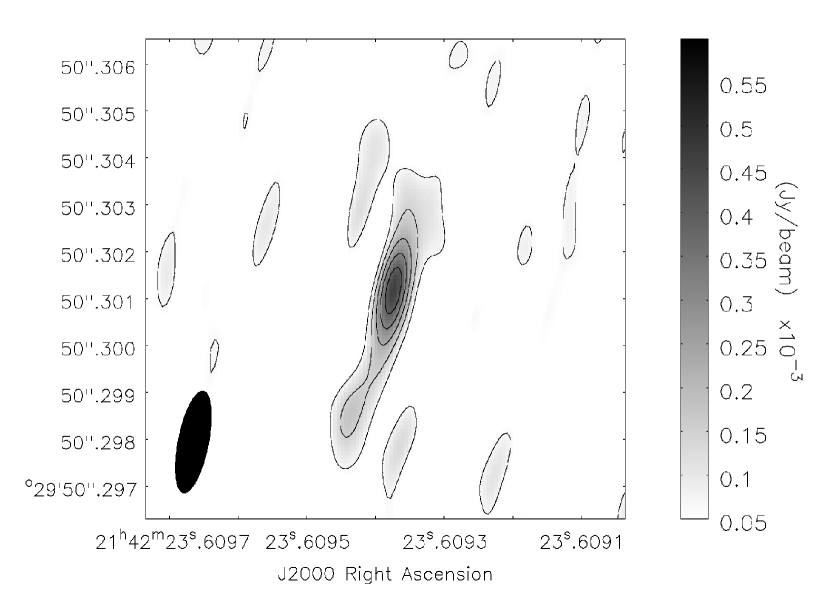
Again we used the fully calibrated and phase-referenced to J2145+1115/J2139+1423 (,) plane data, to image the SN using Difmap. Fig. 5 shows the VLBI image of SN 2001em on 2007, February 5. The source is not resolved. The resolution of our observation was (2.02 0.858) mas at .
A precise determination of the upper limit for the size of SN 2001em was obtained using Monte-Carlo simulation. We again used model fitting in the (,) plane with a circular Gaussian model. We created 100 (,) datasets for a range of sizes for each epoch based on flux density and corresponding image RMS noise using AIPS task UVMOD. This creates simulated datasets with similar properties to the actual data. We found the minimum for each simulated dataset and examined the Gaussian distribution of modelfit sizes depending on the simulated source diameter defined in UVMOD. This has been done for all 4 epochs and a range of simulated source sizes. The combined results of the upper limits for size (FWHM diameter of the circular Gaussian) with a confidence of 95% are listed in Table 2. This means that 95% of the Gaussian distribution is below the upper size limit thus giving us a 2 upper limit.
In Fig. 6 we show a plot of the upper limit radii vs. time and the linear fit to obtain an upper limit for the expansion velocity. Assuming this linear expansion behavior since its discovery on 2001.704, we find a 2 upper limit for the expansion velocity of 0.015 mas year-1, which corresponds to
| (3) |
Bietenholz & Bartel (2007) report a 2 upper limit for the average expansion velocity since the explosion of 25,800 km s-1, at 4.6 years after the SN. For that same epoch, when reanalyzing the same data we obtain a 2 upper limit of 8,100 km s-1. In contrast to Bietenholz & Bartel (2007) we used a circular Gaussian model for model fitting instead of an elliptical one which already reduces the size limit by a factor of about . In addition, we fit directly to the visibility data and used the Monte Carlo simulation method which in the case of an unresolved source improves results further compared with image plane fitting the elliptical Gaussian using the AIPS task JMFIT.
3.3 Radio Lightcurve and Spectrum
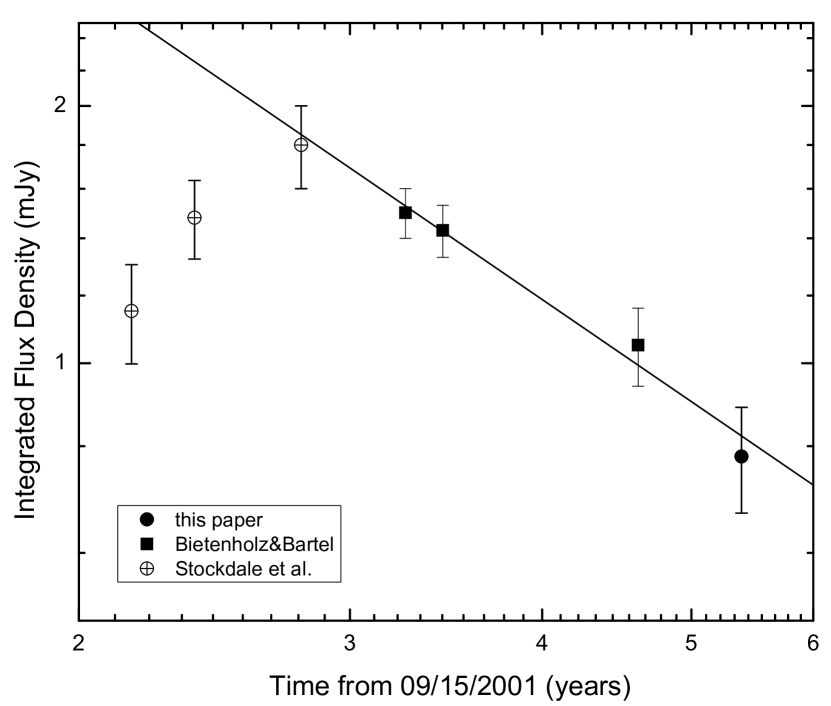
Many multifrequency observations of SN 2001em have been conducted with the VLA since 2003. We present the published values and the observations from February 2007. In Fig. 7 we show the 8.46 GHz detections plotted over time since the supernova explosion. From the peak brightness the 8.46 GHz peak luminosity is (1.54 0.10) erg s-1 Hz-1. We see a power law decay in the flux densities since its peak around 2004 (or yr since the SN) with an index of , i.e. .
Fig. 8 shows the spectrum at the time of our observations () where our measurements are at 1.46 GHz, 4.9 GHz, 8.4 GHz and 22 GHz, the values are listed in Table 3. The 22 GHz point is a 5 detection. The spectral index () at the cut-off between 8.4 GHz and 22 GHz is and between 4.9 and 8.4 GHz it is .
4 Discussion
The lack of any apparent proper motion is consistent with other VLBI measurements of SNe. Some of these other VLBI monitored SNe include SNe 1986J (IIn), 1987a (II peculiar), 1993J (IIb), 2001gd (IIb), and 2004et (IIP) (Pérez-Torres et al., 2002; Manchester et al., 2002; Marcaide et al., 2008; Pérez-Torres et al., 2005; Martí-Vidal et al., 2007). With a fourth epoch, we have further constrained the value reported to (24,00032,000) km s-1. While such constraints on the proper motion may sometimes indicate a symmetric blast-wave centered on the supernova position, in our case the 2 upper limit on the average proper velocity (87,000 km s) is much larger than that on the average expansion velocity (6000 km s-1), and therefore no proper motion is expected to be detected even for a reasonably asymmetric supernova (i.e. given the limit on the expansion velocity, we would expect to detect proper motion only for an extremely asymmetric explosion, which has not yet been observed in ordinary supernovae).
The constraint on the proper motion does, however, rule out a relativistic jet pointing away from us (Granot & Ramirez-Ruiz, 2004) as the source of the radio (and X-ray) emission. In such a scenario, the current limit on the size of the emitting region allows only for a very compact emission region, and rules out a double sided jet where both sides are visible (even if the emission from each side is from a compact region). Moreover, the limit on the proper motion also rules out the possibility that only one side of the jet is visible, since for a compact relativistic emission region moving at an angle relative to our line of sight, the observed limit on the apparent velocity implies, e.g., rad for . Such a small angle relative to our line of sight would not produce an optically thin rising flux years after the SN (since by that time the Lorentz factor is no more than a few and our line of sight would be well within the beaming cone of the radio emission), which was the original motivation for suggesting such an explanation.
Comparing results for SN 2001em to SN/GRB pairs 1998bw, 2003lw and 2006aj, peak luminosities at first suggest a possible GRB event of SN 2001em, but its peak late in time does not match the pattern of SN/GRB pairs (Kaneko et al., 2007). In addition GRB SN show much larger expansion velocities, 100,000 km s-1, than what we obtained (Pihlström et al., 2007). Moreover, our results rule out even a mildly relativistic outflow with an energy comparable to that of the SN ejecta (which is erg), which would not be capable of producing a GRB, and may potentially be much more common in core collapse SNe compared to highly relativistic outflows of similar energy (Granot & Ramirez-Ruiz, 2004).
Our 1 limiting value for the velocity of the radio-emitting region of a blastwave of 3,000 km s-1 is unusually low (see Table 4) and is close to the lowest measured velocity of the radio emitting region of any SN, reported for SN 1987A by Manchester et al. (2002) of 3,500 km s-1. Martí-Vidal et al. (2007) report a minimum, measured expansion velocity of (15,700 2,000) km s-1 for the radio emitting region of the type IIP SN 2004et. Pérez-Torres et al. (2005) reported an upper limit for the expansion velocity for the radio emitting region of the type IIb SN 2001gd of 23,000 km s-1. Marcaide et al. (2008) report an evolving velocity for the radio-emitting region with the outer velocity of the radio emitting shell to be 10,000 km s-1 and the inner velocity to be 7,000 km s-1 occurring between days 1063 and 1399 since explosion. The only other type IIn SN with a measured velocity of its radio emitting region was SN 1986J, Pérez-Torres et al. (2002) report an average expansion velocity that dropped from 7,500 km s-1 in 1988 to 6,300 km s-1 in 1999.
What is of particular interest is that SN 2001em, originally classified as s type Ic SN, has such a low average expansion velocity. Soderberg et al. (2003) estimate that the radio emitting region’s expansion velocity if similar to the type Ic SN 2003L, should exceed 16,000 km s-1 and likely be as high as 30,000 km s-1. Assuming the early optical classification of Filippenko & Chornock (2001) to be valid, we might expect the blastwave of SN 2001em to have been resolved near the limit we establish had it undergone a period of rapid expansion prior to hitting a very dense CSM. Preliminary models of VLA observations suggest an average mass-loss of M⊙ year-1, assuming wind-driven, clumpy/filamentary CSM (Weiler et al., 2002; Stockdale et al., 2007). Weiler et al. (2002) indicates that such a radio-derived mass-loss rate is slightly higher than values determined for other type IIn SNe, 1.14 M⊙ year-1 for SN 1988Z and 4.28 M⊙ year-1 for SN 1986J. However, depending on when this shell of material was ejected, the actual mass-loss event was likely much higher than this average value. Due to a lack of any radio observations within the first two years following the explosion, we are unable to place any reasonable upper-bound on this mass-loss rate.
We obtained a 2 upper size limit of the radio emitting region of cm after 5.4 years, which is marginally consistent with the model of Chugai & Chevalier (2006), in which the ejecta collides with a dense circumstellar shell at a radius of cm after yr (note that a thin emitting shell, that is more relevant for their model, gives an upper limit on the radius and average expansion velocity that is smaller by compared to the circular Gaussian that we have used). Our results support the picture that at a very early epoch, this supernova has evolved from a type Ib/c SN with little circumstellar interaction to a type IIn with strong circumstellar interaction. The classification as type IIn SN was in part due to the late-time observation of a narrow H line (Soderberg et al., 2004). This detection indicates the existence of cool shocked circumstellar gas (Chugai & Chevalier, 2006).
The large X-ray luminosity of at days implies a radiated energy in the X-ray range (–keV) of the order of erg (assuming the typical time for variation in is ). This sets a strict lower limit on the energy that was dissipated and converted into internal energy by that time, of erg. However, the true value of is most likely significantly higher than this lower limit, due to the combination of various inefficiencies in the conversion of the dissipated energy into radiation in the X-ray range within the dynamical time. First, the total radiated energy is probably somewhat larger than the measured value, since is still rising within the observed energy range (; Pooley & Lewin, 2004) and should therefore peak at higher energies. Second, not all of the dissipated energy is given to the electrons, and most of it can go into protons (or other ions; both the thermal population or cosmic rays) or magnetic fields, and thus would not be radiated away. Finally, even the energy that does go into electrons is not always radiated away efficiently on the dynamical time. Given all the above, we consider erg to be a more realistic estimate of the energy that has been dissipated by time (although a somewhat lower value might still be possible under some circumstances). This would suggest a deceleration time of days, i.e. that by that time the ejecta had interacted with a surrounding mass comparable to its own mass (Granot & Ramirez-Ruiz, 2004; Chevalier, 2007).
Moreover, the radio light curve also suggests a deceleration time of days, while our limits on the source size imply that the typical initial velocity of the mass that has decelerated by is . For an external density this implies that corresponds to a mass-loss rate of where is the stellar wind velocity of the progenitor star, assuming a quasi steady wind during the relevant time scale. Such a high mass loss rate may suggest an episodic mass ejection event, rather than a steady wind, that would result in a dense CSM shell. The required mass of such a CSM shell is at least comparable to that of the SN ejecta that was decelerated until , . Now, let us consider the opacity of this part of the original SN ejecta, of mass and initial velocity , at earlier times. Assuming one free electron per proton mass, its Thompson optical depth at would be , while additional opacity from other parts of the ejecta could only add to the total optical depth. This opacity is somewhat large for the time near the peak of the supernova optical light curve (days), and may become a more severe problem if turns out to be lower than the current upper limit on it.
5 Summary & future observations
It is clear that SN 2001em exhibits radio properties consistent with a type II SN with a significant CSM/blastwave interaction. Future VLBI monitoring is recommended. As the blastwave expands we will be able to further constrain or eventually determine the average velocity of the blastwave. SN 2001em has faded considerably at 8 GHz over the last few years but is still readily detectable with a estimated flux density at the end of 2008 of 0.55 mJy. With HSA recording rates expected to increase to 4096 Mbps by 2011, the thermal noise level of the HSA at 8 GHz should decrease to 1.40 Jy beam-1 at an integration time of 8 hours, thus keeping pace with the fading of SN 2001em which is expected to follow a power law decay. At the end of 2008 an HSA observation (512 Mbit s-1) would have a signal to noise ratio (SNR) of 139 and by 2011 with 4096 Mbit s-1 bandwidth a SNR of 288 based on 1 using natural weighting.
References
- Bietenholz & Bartel (2005) Bietenholz, M. F., & Bartel, N. 2005, ApJ, 625, L99
- Bietenholz & Bartel (2007) Bietenholz, M. F., & Bartel, N. 2007, ArXiv e-prints, 706, arXiv:0706.3344
- Chevalier (2007) Chevalier, R. A. 2007, Revista Mexicana de Astronomia y Astrofisica Conference Series, 30, 41
- Chugai & Chevalier (2006) Chugai, N. N., & Chevalier, R. A. 2006, ApJ, 641, 1051
- Feissel-Vernier (2003) Feissel-Vernier, M. 2003, A&A, 403, 105
- Filippenko & Chornock (2001) Filippenko, A. V., & Chornock, R. 2001, IAU Circ., 7737, 3
- Granot et al. (2002) Granot, J., Panaitescu, A., Kumar, P., & Woosley, S. E. 2002, ApJ, 570, L61
- Granot & Loeb (2003) Granot, J., & Loeb, A. 2003, ApJ, 593, L81
- Granot & Ramirez-Ruiz (2004) Granot, J., & Ramirez-Ruiz, E. 2004, ApJ, 609, L9
- Hinshaw et al. (2008) Hinshaw, G., et al. 2008, ArXiv e-prints, 803, arXiv:0803.0732
- Kaneko et al. (2007) Kaneko, Y., et al. 2007, ApJ, 654, 385
- Marcaide et al. (2008) Marcaide, J. M., Martí-Vidal, I., Alberdi, A., Pérez-Torres, M. A., Ros, E., Diamond, P. J., Guirado, J. C., Lara, L., Shapiro, I. I., Stockdale, C. J., Weiler, K. W., Mantovani, F., Preston, R. A., Schlizzi, R. T., Sramek, R. A., Trigilio, C., Van Dyk, S. D., & Whitney, A. R. 2007, in prep.
- Martí-Vidal et al. (2007) Martí-Vidal, I., Marcaide, J. M., Alberdi, A., Guirado, J. C., Lara, L.,Pérez-Torres, M. A., Ros, E., Argo, M. K., Beswick, R. J., Muxlow, T. W. B., Pedlar, A., Shapiro, I. I., Stockdale, C. J., Sramek, R. A., Weiler, K. W., & and Vinko, J. 2007, A&A, 470, 1071
- Manchester et al. (2002) Manchester, R. N., Gaensler, B. M., Wheaton, V. C., Stavely-Smith, L., Tzioumis, A. K., Bizunok, N. S., Kesteven, M. J., & Reynolds, J. E. 2002, Publications of the Astronomical Society of Australia, 19, 207
- Paczyński (2001) Paczyński, B. 2001, Acta Astron., 51, 1
- Papenkova & Li (2001) Papenkova, M., Li, W. D., Wray, J., Chleborad, C. W., & Schwartz, M. 2001, IAU Circ., 7722, 1
- Paragi et al. (2005) Paragi, Z., Garrett, M. A., Paczyński, B., Kouveliotou, C., Szomoru, A., Reynolds, C., Parsley, S. M., & Ghosh, T. 2005, Memorie della Societa Astronomica Italiana, 76, 570
- Pérez-Torres et al. (2002) Pérez-Torres, M. A., Alberdi, A., Marcaide, J. M., Guirado, J. C., Lara, L., Mantovani, F., Ros, E., Weiler, & K. W. 2002, MNRAS, 335, L23
- Pérez-Torres et al. (2005) Pérez-Torres, M. A., Alberdi, A., Marcaide, J. M., Guirado, J. C., Lara, L., Mantovani, F., Ros, E., Weiler, K. W., & Stockdale, C. J. 2005, MNRAS, 360, 1055
- Pihlström et al. (2007) Pihlström, Y. M., Taylor, G. B., Granot, J., & Doeleman, S. 2007, ApJ, 664, 411
- Piner et al. (2007) Piner, B. G., Mahmud, M., Fey, A. L., & Gospodinova, K. 2007, AJ, 133, 2357
- Pooley & Lewin (2004) Pooley, D., & Lewin, W. H. G. 2004, IAU Circ., 8323, 2
- Pradel et al. (2006) Pradel, N., Charlot, P., & Lestrade, J.-F. 2006, A&A, 452, 1099
- Savolainen et al. (2006) Savolainen, T., Wiik, K., Valtaoja, E., Kadler, M., Ros, E., Tornikoski, M., Aller, M. F., & Aller, H. D. 2006, ApJ, 647, 172
- Soderberg et al. (2003) Soderberg, A. M., Kulkarni, S. R., Berger, E., Chevalier, R. A., Frail, D. A., Fox, D. B., & Walker, R. C. 2003, ApJ, 621, 908
- Soderberg et al. (2004) Soderberg, A. M., Gal-Yam, A., & Kulkarni, S. R. 2004, GRB Coordinates Network, 2586, 1
- Stockdale et al. (2004) Stockdale, C. J., Van Dyk, S. D., Sramek, R. A., Weiler, K. W., Panagia, N., Rupen, M. P., & Paczynski, B. 2004, IAU Circ., 8282, 2
- Stockdale et al. (2004) Stockdale, C. J., Van Dyk, S. D., Weiler, K. W., Sramek, R. A., Panagia, N., Rupen, M. P., Paczynski, B., & Weiler, K. W. 2004, Bulletin of the American Astronomical Society, 36, 1464
- Stockdale et al. (2005) Stockdale, C. J., et al. 2005, IAU Circ., 8472, 4
- Stockdale et al. (2007) Stockdale, C., Kelley, M. T., Weiler, K. W., Panagia, N., & Sramek, R. A. 2007, American Astronomical Society Meeting Abstracts, 211, #105.21
- Stockdale et al. (2008) Stockdale, C. J., Kelley, M. T., Weiler, K. W., Panagia, N., Sramek, R. A., Marcaide, J. M., Williams, C. L. M., & Van Dyk, S. D. 2008, American Institute of Physics Conference Series, 937, 264
- Weiler et al. (2002) Weiler, Kurt W. Panagia, Nino Montes, Marcos J., & Sramek, Richard A. 2002, ARA&A, 40, 387
| Date | Time after SN | Frequency | Integration | Bandwidth | Polarization | Instrument |
|---|---|---|---|---|---|---|
| Time | ||||||
| (days) | (GHz) | (minutes) | (MHz) | |||
| 2004 Jul 01 …… | 1021 | 8.410 | 178 | 32 | 2 | VLBA |
| 2004 Nov 22 …… | 1165 | 8.410 | 400 | 32 | 2 | VLBA+AR+EB+GBT+Y27 |
| 2006 May 27 …… | 1686 | 8.406 | 423 | 32 | 2 | VLBA+AR+EB+GBT+Y27 |
| 2007 Feb 04 …… | 1969 | 8.410 | 300 | 32 | 2 | VLBA+AR+EB+GBT+Y27 |
| 2007 Feb 18 …… | 1983 | 1.465 | 12 | 50 | 2 | VLA |
| 4.885 | 9 | 50 | 2 | VLA | ||
| 22.485 | 20 | 50 | 2 | VLA |
| Epoch | Flux Density | Offset R.A. | Offset Dec. | RMS | Sizelimit |
|---|---|---|---|---|---|
| (years) | (mJy) | (mas) | (mas) | (Jy/beam) | (mas) |
| 2004.496 | 1.41 | -0.089 | 0.15 | 59 | 0.19 |
| 2004.893 | 0.60 | 0.028 | -0.15 | 36 | 0.23 |
| 2006.401 | 0.52 | 0.083 | 0.061 | 21 | 0.19 |
| 2007.094 | 0.59 | -0.019 | -0.057 | 21 | 0.16 |
| Frequency | Flux Density | Noise |
|---|---|---|
| (GHz) | (mJy) | (mJy) |
| 1.465 | 0.704 | 0.264 |
| 4.885 | 0.812 | 0.070 |
| 22.485 | 0.345 | 0.056 |
| Supernova | Type | Velocity | Reference |
|---|---|---|---|
| ( km s-1) | |||
| 1987A | IIpec | Manchester et al. (2002) | |
| 2004et | IIP | Martí-Vidal et al. (2007) | |
| 2001gd | IIb | Pérez-Torres et al. (2005) | |
| 1993J (outer shell) | IIb | Marcaide et al. (2008) | |
| 1993J (inner shell) | IIb | Marcaide et al. (2008) | |
| 1986J (measured 1988) | IIn | Pérez-Torres et al. (2002) | |
| 1986J (measured 1999) | IIn | Pérez-Torres et al. (2002) | |
| 2001em (measured 2006) | IIn | this manuscript | |
| 2001em (measured 2007) | IIn | this manuscript |