Evidence of stochastic resonance in the mating behavior of Nezara viridula (L.)
Abstract
We investigate the role of the noise in the mating behavior between individuals of Nezara viridula (L.), by analyzing the temporal and spectral features of the non-pulsed type female calling song emitted by single individuals. We have measured the threshold level for the signal detection, by performing experiments with the calling signal at different intensities and analyzing the insect response by directionality tests performed on a group of male individuals. By using a sub-threshold signal and an acoustic Gaussian noise source, we have investigated the insect response for different levels of noise, finding behavioral activation for suitable noise intensities. In particular, the percentage of insects which react to the sub-threshold signal, shows a non-monotonic behavior, characterized by the presence of a maximum, for increasing levels of the noise intensity. This constructive interplay between external noise and calling signal is the signature of the non-dynamical stochastic resonance phenomenon. Finally, we describe the behavioral activation statistics by a soft threshold model which shows stochastic resonance. We find that the maximum of the ensemble average of the input-output cross-correlation occurs at a value of the noise intensity very close to that for which the behavioral response has a maximum.
pacs:
87.18.TtNoise in biological systems and 87.50.ygBiophysical mechanisms of interaction and 05.40.-aStochastic processes1 Introduction
In the last twenty years several experimental and theoretical investigations have been carried out on noise-induced effects in neuronal dynamics, in excitable systems and in threshold physical systems Bra94 ; Mos94 ; Gin95 ; Pei95 ; Pik97 ; Noz98 ; Lon98 ; Sto00 ; Wie94 ; Gam95 ; Wan00 ; Lin04 . In particular, resonant activation, stochastic resonance and noise enhanced stability phenomena in neuronal activation have been recently discussed Lin04 ; Pol05 ; Dua08 .
The functionality of a complex biological system depends on the correct exchange of information between the component parts. In natural systems the environmental noise always affects the signal that carries the information. Usually high levels of noise make difficult to reveal signals, so that in everyday life the noise is generally considered harmful in detecting and transferring information. On the other hand, nature consists of open systems characterized by interactions which are (i) inherently non-linear and (ii) noisy, due to the influence of the environment Spa04 . Under specific conditions, the noise can constructively interacts with the system, so that effects induced by the noise, such as stochastic resonance (SR), can improve the conditions for signal detection.
Stochastic resonance (SR), initially observed in the temperature cycles of the Earth Benzi , is a counterintuitive phenomenon, whereby the addition of noise to a weak periodic signal causes it to become detectable or enhances the amount of transmitted information through the system Mos94 ; Gin95 ; Pei95 ; Noz98 ; Lon98 ; Sto00 ; Wie94 ; Gam95 ; Wan00 ; Lin04 ; Vil98 ; Dou93 ; Rus99 ; Fre02 ; Gre00 ; Lon91 ; Bul91 ; Nei02 ; Bah02 ; Gam98 ; Man94 ; Gai97 . When SR occurs, the response of the system undergoes resonance-like behavior as a function of the noise level. In spite of the fact that initially this phenomenon was restricted to bistable systems, it is well known that SR appears in monostable, excitable, and non-dynamical systems.
Non-dynamical stochastic resonance refers to a situation where the mere addition of noise can improve the system sensitivity to discriminate weak information-carrying signals Mos94 ; Gin95 ; Vil98 . The age of SR in biology started in the early 1990s with benchmark publications wherein SR was revealed in sensory neurons affected by external noise. In particular, Moss and collaborators set up an experiment to study the neural response of mechanoreceptor cells of crayfish Dou93 , and the enhancement of electrosensory information in paddlefish for prey capture Rus99 ; Fre02 ; Gre00 . Such sensory neurons are ideally suited to exhibit SR as they are intrinsically noisy and operate as threshold systems Lon91 ; Bul91 ; Nei02 ; Bah02 .
In this paper we report on experiments conducted on the response of Nezara viridula (L.) (Heteroptera Pentatomidae) individuals to sub-threshold signals. Specifically we investigate the role played by the noise in the communication between individuals of opposite sex of N. viridula through the recognition of mechanical vibrations transmitted in the substrate Cok99 ; Cok03 ; Cok07 . Nezara viridula, the southern green stink bug, is a cosmopolitan insect, occurring throughout tropical and subtropical regions of Europe, Asia, Africa and America. This species is highly poly-phagous and it’s one of the most important pentatomid insect pests in the world Tod89 ; Pan00 . Nezara viridula has up to five generations per year Bor87 ; Kir64 ; Fuc03 .
The mating behavior of N. viridula can be divided into long-range attraction and short-range courtship. The first one includes those components of the behavior that lead to the arrival of females in the vicinity of males. The long range attraction mediated by male attractant pheromone enables both sexes to reach the same plant. Short-range courtship includes those components that coordinate the interaction of both sexes once they are in strong proximity. In this last condition the acoustic stimuli (improperly called songs) have an important role in the sexual communication between male and female individuals Cok99 .
The sound generating organ is the tymbal organ across the back, present in adult bugs Cok03 . These animals produce vibrations at the frequency of about Hz. These vibrations are transmitted through the legs into the plant stem and detected by vibro-receptors sited in the legs of the receiving bug Bag08 . Because of its essential role during the mating behavior, the reception of these signals has been studied in N. viridula populations from Slovenia, Florida, Japan and Australia Cok00 .
Due to the importance of acoustic communication in mating behavior, a possible control of N. viridula populations can be achieved by devising traps that work emitting vibratory signals. In this context, because of the strong interaction between species and environment, the role played by external noise in acoustic communication becomes relevant.
In section 2 we describe the experimental equipment and methods used in measurements of the mechanical vibrations emitted by N. viridula individuals. In order to find a threshold level for the insect behavior we have performed directionality tests on N. viridula male bugs by using different amplitudes of calling signal. In the presence of a sub-threshold signal mixed with an external noise, we have investigated the insect response as a function of different noise intensities. The results, reported in section 3, suggest the presence of noise-induced neuronal activation for a sub-threshold signal. Therefore, in section 4 we discuss the experimental results within the framework of the soft threshold model which shows stochastic resonance (TSR) phenomenon. In the final section we draw our conclusions.
2 Materials and methods
All experiments have been performed by using N. viridula collected in fields around Palermo, and reared in laboratory condition Col04 . Adult males have been tested at least ten days after the final moult to ensure their sexual maturity and a period of isolation of three days from the other sex Cok07 ; Cok00 .
The vibratory signal of our interest is the sexual calling song of female sex. This signal has been recorded by the membrane of a conic low-middle frequency loudspeaker (MONACOR SPH 165 C CARBON with a diameter of ) and stored in a computer for sound analysis. For the acquisition, processing and analysis of the sounds a commercial software has been used. The speaker has been used as ”inverse” microphone, namely an acoustic-electric transducer: the sounds have been recorded from the non-resonant membrane of a speaker, carefully chosen to get a good frequency response starting from . The sound acquisitions have been made inside an anechoic chamber (sound insulated) at C, of relative moisture and in presence of artificial light. The choice of this recording set-up has been decided after a comparative analysis with a recording system based on the use of a stethoscope. In particular, the speaker membrane shows greater sensitivity at medium-low frequencies, which are crucial in our experiment.
The sound has been sampled from the analogic signal source ( samples per second at -bit) and then it has been filtered by a order Tchebychev filter (type I) with band-pass from to Hz. This filtering has been done to cut: (i) the low frequencies due to the electric network () and the conic loudspeaker, and (ii) the high frequencies due to the electronic apparatus. Spectral and temporal properties of the measured non-pulsed female calling songs (NPFCS) have been compared with those of North America, observing that the sounds produced by adults of N. viridula collected in Sicily have similar spectrum of that produced by N. viridula adults collected in USA with a slightly different frequency range Cok07 ; Cok00 ; Cok05 .
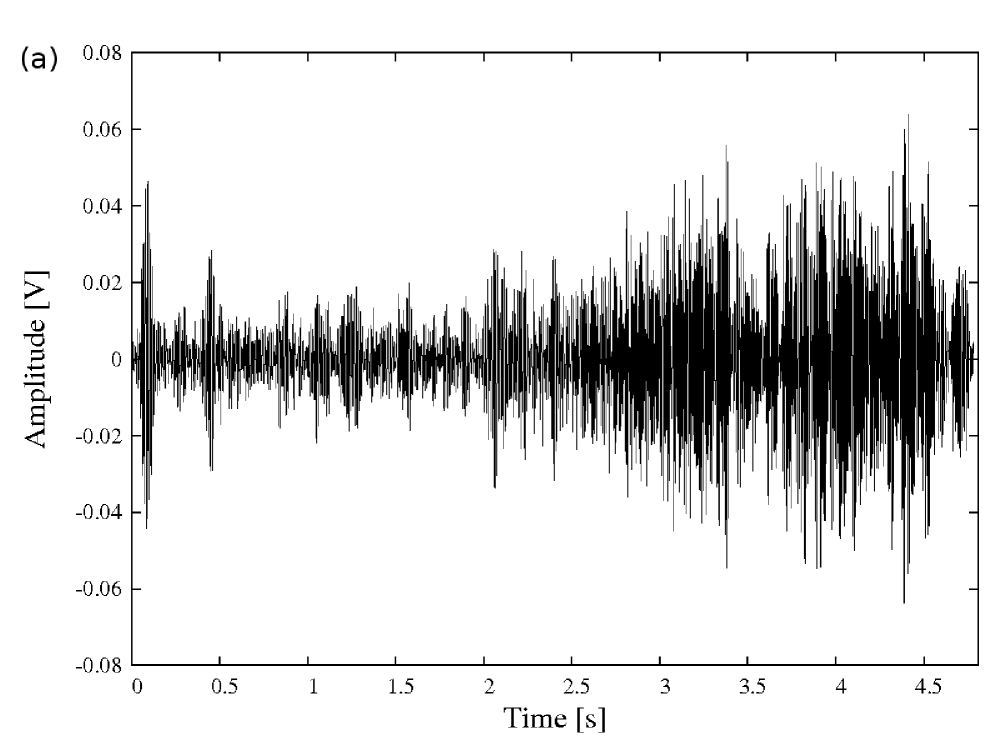
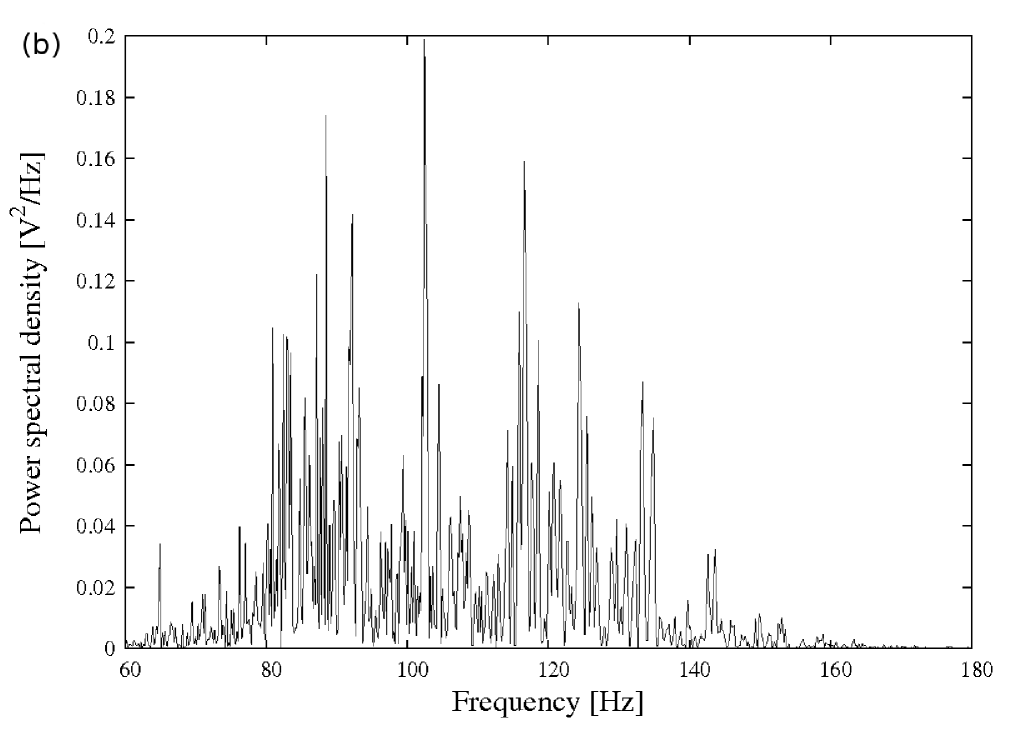
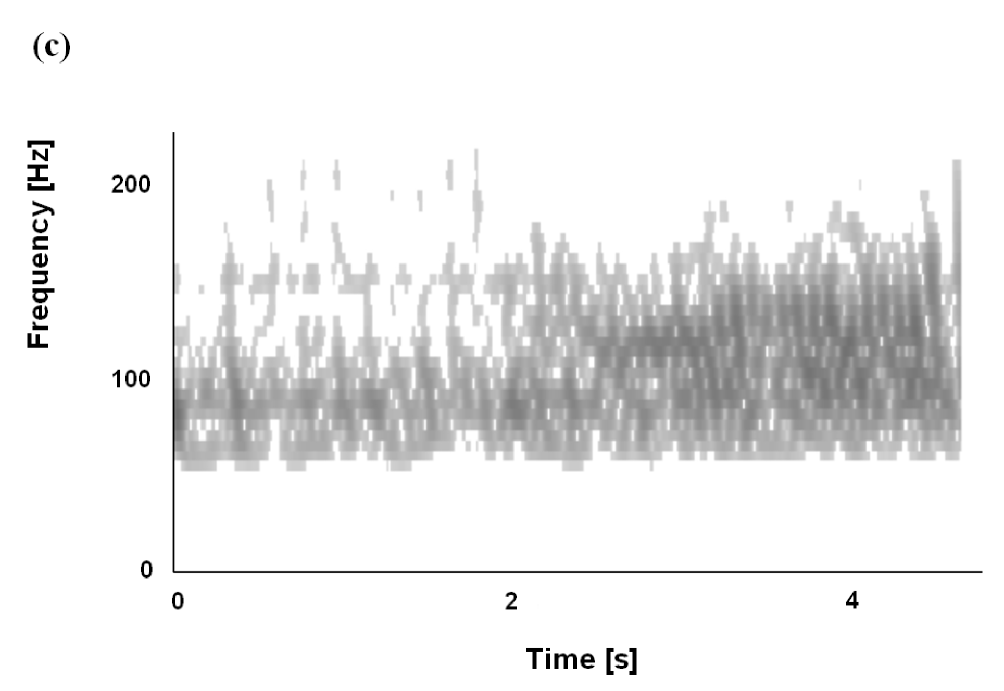
In Fig. 1(a), the oscillogram of NPFCS is shown. The signal is characterized by a short pre-pulse followed by a longer one, according to previous experimental findings Cok00 . In Fig. 1(b), the power spectrum density (PSD) of NPFCS is presented. The time length of the NPFCS is s. In this spectrum the dominant frequencies range from to Hz and the subdominant peaks do not exceed Hz. The maximum peak occurs at Hz. In Fig. 1(c) we report the relative sonagram, achieved by the Short Time Fourier Transform (STFT) method. The STFT maps a signal providing information both about frequencies and occurrence times. It shows that during the first two seconds (short pre-pulse), the dominant frequency interval is narrower than the range observed in the successive time window. In particular in the first time interval the highest frequency doesn’t cross Hz, whereas in the final one it reaches almost Hz.
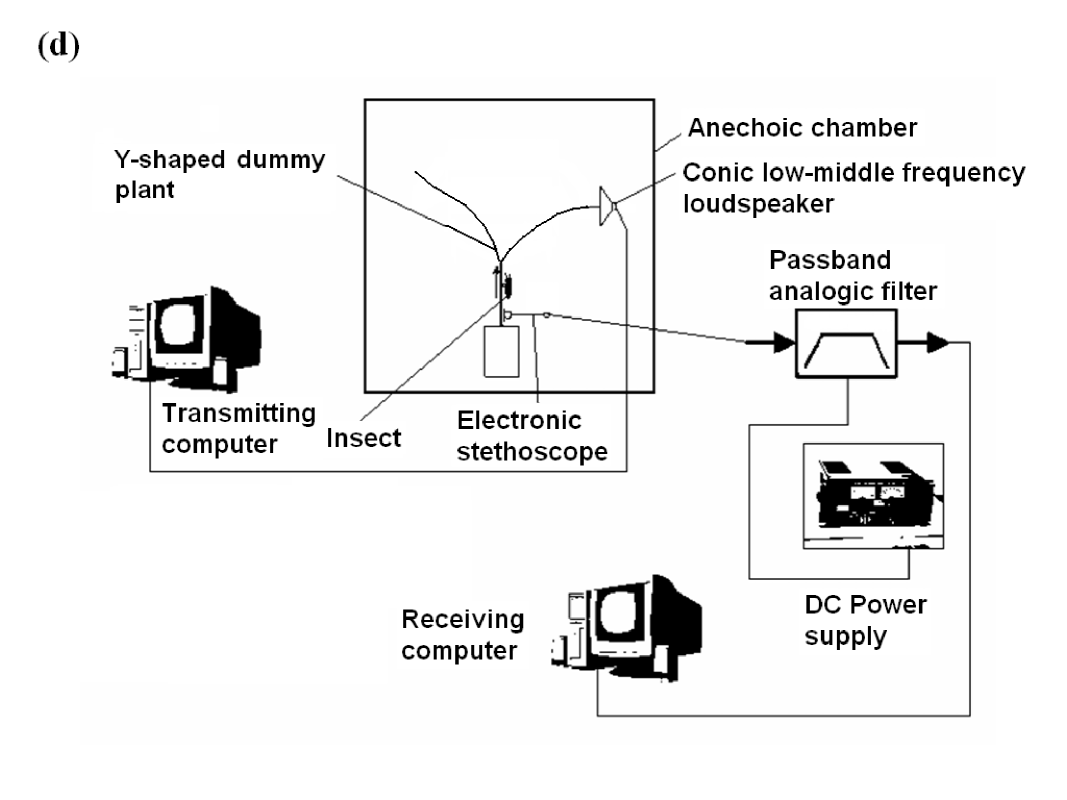
Afterwards, in view of investigating the role of the noise in the N. viridula mating behavior, we have designed an experimental setup to analyze the ability of male individuals to locate the source of vibratory signals generated by female insects. In particular, in order to perform directionality tests, we have prepared an Y-shaped dummy plant inside an anechoic chamber. This Y-shaped substrate is constituted by a wood vertical stem, 10 cm long, and 0.8 - 0.9 cm thick at the top of which there are two wood branches 25 cm long, and 0.4 cm thick, as shown in Fig. 1(d). The angle between two branches is .
The experiment consists of sending a signal on one branch of the Y-shaped dummy plant and observing the behavior of single male individuals initially placed at the center of the vertical stem Cok99 . In Fig. 1(d) the block diagram of our experimental set-up is shown. We have sent the vibrational signal at the right apex of Y-shaped plant. The two lateral branches are not in contact with the vertical stem. The distance between each branch and the vertical stem is 0.3 cm. At this stage of the experiment the cone has been used as electro-acoustic transducer. A response to our test is achieved when the bug, before choosing one direction in the Y-shaped structure, has touched the lower end of both branches. According to this procedure, we have performed more trials for each fixed intensity (see section 3 for details), counting and recording the left and right choices of the insects. We have observed the behavior of the insects in the cross point for different intensities of the mechanical stimulus. The obtained statistical data on the directionality choices have been used to determine the intensity threshold value at which the bugs start to ”hear” the calling song.
3 Experimental results
The presence of an ”oriented” behavior, namely that the insects tend to choose the branch with the signal source, is revealed by performing directionality tests on a group of male individuals. When we observe a percentage of insects higher than going towards the acoustic source, Source-Direction Movement (SDM), we consider that the signal has been revealed by the insects. In Fig. 2(a) we plot the relative frequency of SDMs, that is the number of SDMs divided by the total trials, at different signal intensities. The exact number of trials, performed for each intensity, is reported beside the corresponding point in the graph. For every trial actually we used one insect at a time. Specifically for the experiments related to Fig. 2(a) we used individuals, of which have moved towards the sound source. For the experiments related to Fig. 2(b) we used animals, of which have shown the SR phenomenon. For small values (lower than V) of the signal power, a percentage approximately corresponding to the of the insects chose one direction, the remaining the other one.
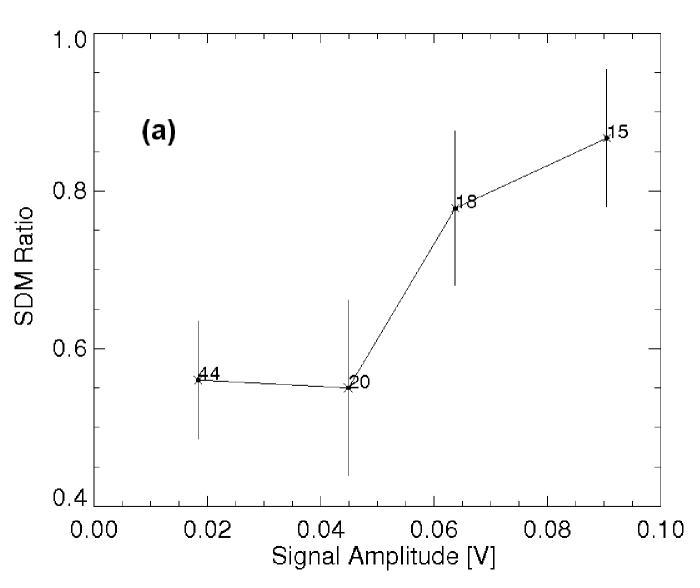
Conversely, for values greater than 0.063786 V, the insects show a preferential behaviour, choosing the direction from which the signal originates in the of the trials or more. Because of this, we have chosen the value V of the signal amplitude as the threshold level for the signal detection.
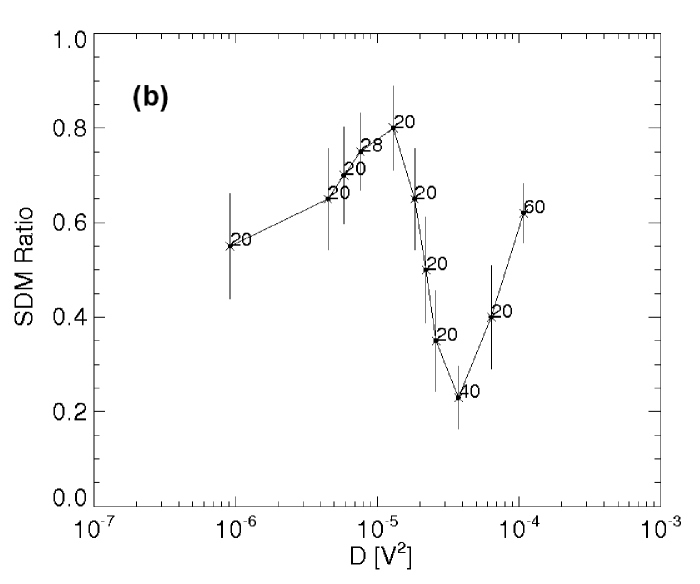
Then, by using a sub-threshold signal plus a Gaussian ”white” noise we have investigated the response of the test insect for different levels of noise intensity . The ”white” noise that we used in our experiments, to simulate the environmental noise, is generated numerically by software Matlab. This noise signal has a flat spectrum up to Hz, with a correlation time of about s. However our cone reproduces the sound up to kHz. This means that our cut-off frequency is kHz, which is more than two order of magnitude greater than the highest frequency emitted by adults of N. viridula. In other words the insect ”feels” white noise. In Fig. 2b we report the percentage of SDMs as a function of , finding the optimal noise intensity that maximizes the recognition between individuals of opposite sex. The graph shows a maximum for . For values of the percentage of individuals going towards the acoustic source decreases below reaching for . The other values of the SDM ratio close to , indicate that the individuals of N. viridula have chosen randomly the direction of their motion, that is no oriented behaviour occurs. The non-monotonic behaviour of SDM, with a maximum at , indicates that in the presence of a sub-threshold deterministic signal, the environmental noise can play a constructive role, amplifying the weak input signal and contributing to improve the communication among individuals of N. viridula. The occurrence of a minimum in the SDM behaviour at , will be subject of further investigations. One possible conjectural explanation is as follows: when the noise intensity is so great that the signal received from the vibro-receptors is significantly modified, the male insects are unable to recognize the female calling song, and they could exchange it for the song of some rivals.
A further increase of the noise intensity causes the spectrum of the received signal to become indistinguishable from a pure environmental noise and therefore the insect is unable to recognize any signal of N. viridula individuals. This implies that no significative response is observed in terms of percentage of source-direction movements (SDMs ). The non-monotonic behaviour of SDM, as a function of the noise intensity (see Fig. 2(b), can be considered the signature of the threshold stochastic resonance.
4 Threshold Stochastic Resonance
The presence of a maximum in the behaviour of SDM percentage vs in Fig. 2(b) can be explained by the phenomenon of the soft threshold stochastic resonance. Soft thresholds are ubiquitous in living systems, in particular in mechanisms of neurons and neural network such as sensory systems. In fact, biologic systems, under ordinary conditions, usually don’t exhibit Heaviside-type threshold (”hard” threshold) function as information transmission function, but rather respond to weak signals gradually Gree04 .
The experimental results of Fig. 2(a) clearly show that the individuals of N. viridula exhibit ”soft” threshold, which can be represented by a logistic or sigmoid function. In Fig. 3 we compare this sigmoid curve with the experimental data of Fig. 2(a), rescaled in such a way that the value of 50% of SDM corresponds to zero level. In fact this level indicate that insects choose randomly the direction of their motion, without any oriented behaviour. We rescale the experimental values of the Source-Direction Movement Ratio as: , where is the amplitude of the stimulus, so that of SDM ratio of Fig. 2a corresponds to zero value of the function f in Fig. 2 and the value for . In human and animal psychophysics, the relationship between an organism’s sensitivity and a sensory stimulus is called ”psychometric function” Gree04 . As best fitting of the experimental data we used as psychometric function the logistic function
| (1) |
where , , and .

We have simulated our biological system by a weak signal of maximum amplitude , obtained by the recorded female calling song as the input signal, and by using the following model
| (4) |
with . Here is the weak input signal, is the input noise signal and is the output signal. Because of the aperiodicity and the broad spectrum of the input signal, the signal to noise ratio is not an adequate measure of stochastic resonance phenomenon. We used a cross-correlation measure as introduced in Refs. Coll95 ; Dutta
| (5) |
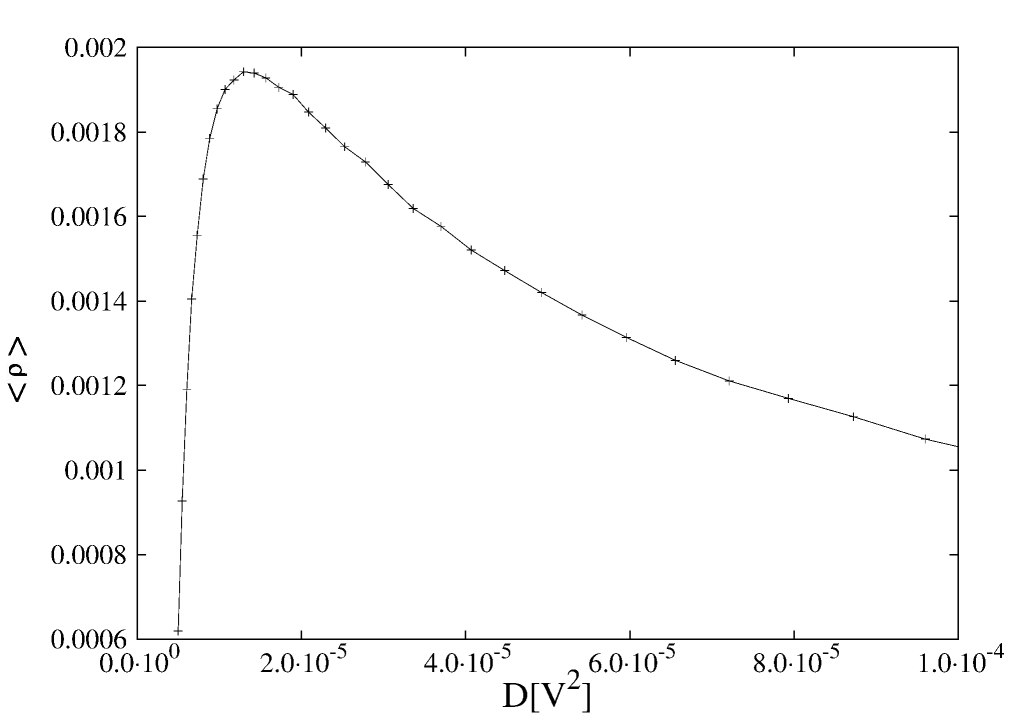
where the overbar denotes an average over time ( s.), and the brackets mean ensemble average. The ensemble average of the input-output cross-correlation coefficient as a function of the noise intensity is reported in Fig. 4. For each value of the noise intensity we have performed numerical realizations. The ensemble averaged cross-correlation coefficient takes its maximum at , which is very close to the value of the noise intensity that maximizes the SDM ratio (see Fig. 2(b)).
Concerning the role of the internal noise, as reported in the paper by Gailey et al. Gai97 , the peculiar nonmonotonic behaviour reported in our Fig. 2(b) suggests the possibility of the presence of a second maximum in the curve, for noise intensity values greater than . The presence of this second maximum indicates that the first one could be ascribed to the internal noise always present in biological systems. We will investigate in more detail the behaviour of the SDM Ratio as a function of the external noise intensity in a forthcoming paper.
The results obtained from our model suggest that in the biological system analyzed, the stochastic resonance plays a key role, since it permits to extract information from a weak deterministic signal, thanks to the constructive action of the environmental noise. In other words there is a suitable noise intensity which maximizes the behavioural response of the green bugs and this effect can be described by a soft threshold model which shows stochastic resonance.
5 Conclusions
In this work we have investigated the role of the noise in the vibrational communications occurring during the mating of N. viridula. In our experiments, by analyzing the response of the insects to a deterministic signal (calling song), we have determined the threshold for the neural activation in insect individuals. By using a sub-threshold signal we have analyzed the insect response in the presence of an external noise source. We have found that the behavioural activation of the green bugs, described by the Source-Direction Movement Ratio, has a nonmonotonic behaviour as a function of the noise intensity , with a maximum at . This value represents the optimal noise intensity since it maximizes the efficiency of the sexual communication between individuals of N. viridula.
This appears as the signature of the soft threshold stochastic resonance (TSR) Gree04 . By using a soft threshold model we are able to compare through Figs. 2(b) and 4 the optimal noise intensities obtained in experiment and in numerical simulations. The ensemble averaged cross-correlation coefficient of the model (4) shows a maximum at a noise intensity value very close to the value that maximizes the SDM ratio, observed in our experiments.
This work was supported by MUR and INFM-CNISM. A.F. acknowledges the Marie Curie TOK grant under the COCOS project (6th EU Framework Programme, contract No: MTKD-CT-2004-517186).
References
- (1) Braun H.A. et al., Nature 367, (1994) 270-273.
- (2) Moss F., Pierson D. and O’Gorman D., Int. J. of Bifurcation and Chaos 4 (6), (1994) 1383-1397.
- (3) Gingl Z., Kiss L. B. and Moss F., Europhys. Lett. 29 (3), (1995) 191-196.
- (4) Pei X., Bachmann K. and Moss F., Phys. Lett. A 206, (1995) 61-65.
- (5) Pikovsky A. S., and Kurths J., Phys. Rev. Lett. 78, (1997) 775-778.
- (6) Nozaki D., Yamamoto Y., Phys. Lett. A 243, (1998) 281-287.
- (7) Longtin A., Chialvo D. R., Phys. Rev. Lett. 81, (1998) 4012-4015.
- (8) Stocks N. G., Phys. Rev E 64, (2001) 030902(4); id., Phys. Rev E 63,(2001) 041114 (9); id., Phys. Lett. A 279, (2001) 308-312; id., Phys. Rev. Lett. 84, (2000) 2310-2314.
- (9) Wiesenfeld K. et al., Phys. Rev. Lett. 72, (1994) 2125-2129.
- (10) Gammaitoni L., Phys. Rev. E 52, (1995) 4691-4698; Phys. Lett. A 74, (1995) 315-322.
- (11) Wannamaker R. A., Lipshitz S. P., and Vanderkooy J., Phys. Rev. E 61, (2000) 233-236.
- (12) Lindner B., Ojalvo J. G., Neiman A., Schimansky-Geier L., Physics Reports 392, (2004) 321-424.
- (13) Pankratova E. V., Polovinkin A. V., Spagnolo B., Physics Letters A 344 (2005) 43-50; B. Spagnolo et al., Acta Physica Polonica B, 38 (5), (2007) 1925-1950.
- (14) Duarte J. R. R., Vermelho M. V. D., Lyra M. L., Physica A 387 (2008) 1446 1454.
- (15) Spagnolo B., Valenti D., Fiasconaro A., Math Biosci. Eng. 1 (2004) 185-211.
- (16) Benzi R., Sutera A., Vulpiani A., J. Phys.: Math Gen. 14 (1981) L453-L457; Benzi R., Parisi G., Sutera A., Vulpiani A., Tellus 34 (1982) 10-16.
- (17) Vilar J. M., Gomila G. and Rubi J. M., Phys. Rev. Lett. 81 (1998) 14-17.
- (18) Douglass J.K. et al., Nature, 365 (1993) 337-340.
- (19) Russell D. F., Wilkens L. A., Moss F., Nature 402, (1999) 291-294.
- (20) Freund J., Schimansky-Geier L., Beisner B., Neiman A., Russell D., Yakusheva T. and Moss F., Journal of Theoretical Biology, 214, (2002) 71-83.
- (21) Greenwood P. E., Ward L. M., Russell D. F., Neiman A. and Moss F., Phys. Rev. Lett. 84, (2000) 4773-4776.
- (22) Longtin A., Bulsara A., Moss F., Phys. Rev. Lett., 67, (1991) 656-659.
- (23) Bulsara A., Jacobs E. W., Zhou T., Moss F., Kiss L., J. Theor. Biol., 152, (1991) 531-555; Chialvo D. R., Apkarian A. V., J. Stat. Phys., 70, (1993) 375-391.
- (24) Neiman A., Russell D., Phys. Rev. Lett. 88, (2002) 138103(4).
- (25) Bahar S., Neiman A., Wilkens L., Moss F., Phys. Rev. E, 65, (2002) 050901(R).
- (26) Gammaitoni L., Hnggi P., Jung P., Marchesoni F., Rev. Mod. Phys. 70, (1998) 223-287.
- (27) Mantegna R. N., Spagnolo B., Phys. Rev. E 49, (1994) R1792-R1795; Mantegna R. N., Spagnolo B. and Trapanese M., Phys. Rev. E 63, (2001) 011101 (8).
- (28) Gailey Paul C., Neiman Alexander, Collins James J., and Moss Frank, Phys. Rev. Lett. 79, (1997) 4701.
- (29) okl A., Virant Doberlet M., McDowell A., Anim. Behav. 58, (1999) 1277-1283.
- (30) okl A., Virant Doberlet M., Annual Review of Entomology 48, (2003) 29-50.
- (31) okl A., Zorovi M., Millar J. G., Behavioural Processes 75, (2007) 40 54.
- (32) Todd J. W., Annu. Rev. Entomol. 34, (1989) 273-292.
- (33) Pannizzi A. R., Anais Soc. Entomol. Brasil 29, (2000) 1-12.
- (34) Borges M., Jepson P. C., Howse P.E., Ent. Exp. Appl. 44, (1987) 205-212.
- (35) Kiritani K., Jpn. J. Appl. Entomol. Zool. 8, (1964) 45-53.
- (36) A. Fucarino, Semiochemical relationships in the tritrophic system Leguminous, Nezara viridula (L.) and Trissolcus basalis (Woll.) (Ph.D. thesis, University of Palermo, Italy, 2003).
- (37) Bagwell G. J., okl A., Millar J. G., Ann. Entomol. Soc. Am. 101(1): (2008) 235-246.
- (38) okl A., Virant Doberlet M., Stritih N., Physiol. Entomol. 25, (2000) 196-205.
- (39) Colazza S., Fucarino A., Peri E., Salerno G., Conti E., Bin F., J. Exp. Biol. 207, (2004) 47-53.
- (40) okl A., Zorovi M., uni A., Virant Doberlet M., J. Exp. Biol. 208, (2005) 1481-1488.
- (41) Greenwood P. E., Mller U. U., Ward L. M., Phys. Rev. E 70, (2004) 051110 1-10.
- (42) Collins J. J., Chow Carson C., and Imhoff Thomas T., Phys. Rev. E 52, (1995) R3321-R3324; Park K., Lai Y. C., Liu Z., Nachman A., Phys. Lett A 326, (2004) 391-396.
- (43) Dutta R., Das A., Stocks N. G., Morgan D., Sens. Actuators B 115 (2006) 17-27.