Combined Effects of Galaxy Interactions and
Large-Scale Environment on Galaxy Properties
Abstract
We inspect the coupled dependence of physical parameters of the Sloan Digital Sky Survey galaxies on the small-scale (distance to and morphology of the nearest neighbor galaxy) and the large-scale (background density smoothed over 20 nearby galaxies) environments. The impacts of interaction on galaxy properties are detected at least out to the neighbor separation corresponding to the virial radius of galaxies, which is typically between 200 and 400 kpc for the galaxies in our sample. To detect these long-range interaction effects it is crucial to divide galaxy interactions into four cases dividing the morphology of target and neighbor galaxies into early and late types. We show that there are two characteristic neighbor-separation scales where the galaxy interactions cause abrupt changes in the properties of galaxies. The first scale is the virial radius of the nearest neighbor galaxy . Many physical parameters start to deviate from those of extremely isolated galaxies at the projected neighbor separation of about . The second scale is at kpc, and is the scale at which the galaxies in pairs start to merge. We find that late-type neighbors enhance the star formation activity of galaxies while early-type neighbors reduce it, and that these effects occur within . The hot halo gas and cold disk gas must be participating in the interactions at separations less than the virial radius of the galaxy plus dark halo system. Our results also show that the role of the large-scale density in determining galaxy properties is minimal once luminosity and morphology are fixed. We propose that the weak residual dependence of galaxy properties on the large-scale density is due to the dependence of the halo gas property on the large-scale density.
Subject headings:
galaxies:general – galaxies:formation – galaxies:evolution – galaxies:morphology – galaxies:properties1. Introduction
According to the currently popular CDM model of structure formation, galaxies should form hierarchically. Numerical simulations demonstrate that galaxy-sized objects form through numerous interactions and mergers (e.g. Toomre & Toomre 1972; Hernquist 1992, 1993; Naab & Burkert 2003; Robertson et al. 2006; Maller et al. 2006). Therefore, the outcomes of galaxy-galaxy interactions and mergers are of key importance in understanding the hierarchical picture of galaxy formation. However, the impact of interactions and mergers on galaxy properties is still not known well even though there have been many studies.
One of the earliest works on this problem is Larson & Tinsley (1978) who showed that galaxies selected from the Atlas of Peculiar Galaxies (Arp 1966) have enhanced star formation (SF) rate compared to typical galaxies. Since that time, many studies have shown observational evidence of significant changes in galaxy properties due to interactions and/or mergers, for instance, in SF activity (Kennicutt & Keel 1984; Kennicutt et al. 1987; Bushouse, Werner & Lamb 1988; Barton et al. 2000, 2003, 2007; Lambas et al. 2003; Sanchez & Gonzalez-Serrano 2003; Nikolic, Cullen & Alexander 2004; Hernandez-Toledo et al. 2005; Geller et al. 2006; Li et al. 2008), galaxy structure parameters (Nikolic et al. 2004; Patton et al. 2005; Hernandez-Toledo et al. 2005; Coziol & Plauchu-Frayn 2007; Kacprzak et al. 2007), luminosity ratio (Woods et al. 2006; Woods & Geller 2007), and stellar mass ratio (Ellison et al. 2008). Recent -body simulations have also shown that the general features of the observations can be modeled (e.g. Barnes & Hernquist 1996; Mihos & Hernquist 1996; Tissera et al. 2002; Perez et al. 2006a,b; Di Matteo et al. 2007).
However, previous studies have not always been in agreement with one another. Yee & Ellingson (1995) and Patton et al. (1997) found no significant difference between the mean properties of isolated and paired galaxies. Bergvall et al. (2003) found no clear difference between isolated galaxies and interacting/merging systems in their global SF rate in Optical/near-IR bands. Allam et al. (2004) identified a set of merging galaxies in the SDSS data and found only a weak positive correlation in color for the merging pairs. Hernandez-Toledo et al. (2005) analyzed the images of 42 elliptical/lenticular galaxies, and claimed that the structural effects of interactions on E/S0s are minor, in contrast to disk galaxies involved in interactions. de Propris et al. (2005) analyzed galaxies in the Millennium Galaxy Catalog and found merging galaxies are only marginally bluer than noninteracting galaxies, showing an excess of both early and late types but a deficiency of intermediate type spirals. Smith et al. (2007) did not find any enhancement in Spitzer mid-infrared color depending on pair separation by using pre-merger interacting galaxy pairs selected from the Arp Atlas.
In addition, in terms of the degree and scale of the effects of interactions on galaxy properties, the results also have not always agreed. Lambas et al. (2003) studied the galaxy pairs in the Two Degree Field Galaxy Redshift Survey (2dFGRS) data and reported that SF in galaxy pairs is significantly enhanced over that of isolated galaxies only when the projected separation kpc and radial velocity difference km s-1. Nikolic et al. (2004) reported using the SDSS data that the mean SF rate is significantly enhanced for galaxy pairs with kpc. But for late types, the enhancement extended out to 300 kpc. They also noted that the SF rate slightly decreased with increasing , and the light concentration was lowest at kpc and then increased rapidly inward. Alonso et al. (2006) measured SF rate of the galaxies in the 2dFGRS and SDSS data and found that the SF rate was strongly enhanced when kpc and km s-1, which was more effective in low and intermediate density environments. These discrepancies as listed above are expected mainly because the effects of interactions/mergers between different types of galaxies on their final products are different. Woods & Geller (2007) found that for blue-blue major pair sample in the SDSS, there exists clear correlation between specific SFR and pair separation, and for red-red pair, there is none (cf. Tran et al. 2005; van Dokkum 2005; Bell et al. 2006). Li et al. (2008) found that for the most strongly star-forming systems, tidal interactions are the dominant trigger of enhanced star formation and the enhancement is a strong function of separation less than 100 kpc.
In addition to such small-scale environment, the large-scale environment has been known to be one of the determining factors of galaxy properties. It is now well-known that galaxy properties correlate with the large-scale background density at low redshift (Hogg et al. 2003; Goto et al. 2003; Balogh et al. 2004a,b; Tanaka et al. 2004; Kauffmann et al. 2004; Blanton et al. 2005a; Croton et al. 2005; Weinmann et al. 2006; Park et al. 2007). Deep redshift surveys have extended these studies to high redshift (Cucciati et al. 2006; Elbaz et al. 2007; Cooper et al. 2007, 2008; Poggianti et al. 2008). A number of papers (Kauffmann et al. 2004; Blanton et al. 2005a; Quintero et al. 2006; Ball, Loveday, & Brunner 2008) claimed from an analysis of the SDSS data that structural properties of galaxies are less closely related to the (large-scale) environment than are their masses and SF related parameters such as color and SF rate. However, the structural parameters such as concentration and Sersic index are not true measure of morphology (Bamford et al. 2008) and indeed, van der Wel (2008) pointed that morphology and structure are intrinsically different galaxy properties and structure mainly depends on galaxy mass whereas morphology mainly depends on environment.
Several papers tried to use sophisticated automated morphology classifications for the study of the relationship between morphology and environment (Goto et al. 2003; Park & Choi 2005; Allen et al. 2006; Ball et al. 2008). Many studies reported that the SF rate of galaxies is a strongly decreasing function of the large-scale density and that there is a critical density for SF activity (Gomez et al. 2003; Tanaka et al. 2004).
Park et al. (2007), however, found that this trend was mostly because morphology and luminosity are strong functions of the large-scale density. They made an extensive study of the environmental dependence of various physical properties of galaxies on large- and small-scale densities, and concluded that morphology and luminosity are major fundamental parameters. Once morphology and luminosity are fixed, other galaxy properties are almost independent of the large-scale density. The large-scale density dependence of these properties reported by many previous and current studies merely reflects the correlations of the properties with morphology and luminosity rather than independent correlations with environment. Park et al. (2007) also found that galaxy morphology changes sensitively across the nearest neighbor distance of a few hundred kpc. This work has been extended by Park, Gott, & Choi (2008) who studied galaxy morphology as a function of the nearest neighbor separation at fixed large-scale background density and found that this characteristic scale corresponds to the virial radius of the neighbor galaxy. Park et al. (2008)’s findings and claims can be summarized as follows.
1. The effects of galaxy interactions reach farther than the distance previously thought. They reach at least out to the galaxy virial radius, namely a few hundred kpc for bright galaxies.
2. The result of galaxy interactions can be very different depending on the morphological type of the nearest neighbor galaxy when the pair separation is less than the virial radius. Without separating the neighbor galaxies into different morphological types, one will find the effects of galaxy interactions are diverse but negligible on average. The dependence on neighbor’s morphology disappears at separations farther than the virial radius.
3. The fact that, at fixed large-scale density, the morphology of a galaxy is more likely to be a late type as it approaches a late-type neighbor, suggests that galaxies can transform their morphology from early types to late types through close encounters with cold gas-rich neighbors.
4. In most places of the universe, except for the regions within massive clusters of galaxies, the well-known morphology-density relation originated largely due to the effects of galaxy-galaxy interactions. Galaxy morphology appears to depend on the large-scale density mainly because the mean separation between galaxies is statistically correlated with the large-scale density.
5. A series of close interactions and mergers transform galaxy morphology and luminosity classes in such a way that galaxies on average evolve to become bright early types. The transformation speed depends on the large-scale density.
The fourth result is supplemented by the recent work of Park & Hwang (2008) who found, in the special case of galaxies located within the virial radius of massive clusters, galaxy properties depend on both the distance to the nearest neighbor and clustercentric radius.
The purpose of this paper is to extend Park et al. (2008)’s work by looking at the dependence of various other properties of galaxies, as well as morphology and luminosity, on small and large scale environmental factors. We use a volume-limited sample of the SDSS galaxies whose morphology is accurately classified. The environment is specified by the small-scale (distance to the nearest neighbor galaxy and morphology of the nearest neighbor galaxy) and large-scale (the background density) factors. It is hoped that the effects of galaxy interactions can be understood in fuller detail in this three-dimensional environmental parameter space.
2. Observational Data Set
2.1. Sloan Digital Sky Survey Sample
Our observational sample is one of the subsamples, D3, used by Choi et al. (2007) and Park et al. (2007). It is a volume-limited sample of galaxies extracted from a large-scale structure sample, DR4plus (LSS-DR4plus), of the SDSS data (York et al. 2000) from the New York University Value-Added Galaxy Catalog (NYU-VAGC; Blanton et al. 2005b). This sample is a subset of the spectroscopic Main Galaxy sample of the SDSS Data Release 5 (Adelman-McCarthy et al. 2007).
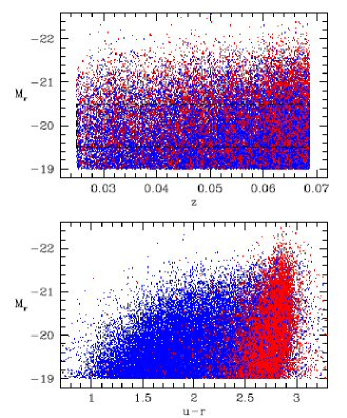
The sample D3, together with other volume-limited samples, has been described in great detail by Choi et al. To summarize it is a sample of galaxies with the -band absolute magnitude (hereafter we drop the term in the absolute magnitude) and redshifts or comoving distance of Mpc Mpc. The SDSS spectroscopic sample has a bright apparent magnitude limit of , but our sample is supplemented by brighter galaxies whose redshifts are obtained from various literature. D3 includes 49,571 galaxies. The rest-frame absolute magnitudes of individual galaxies are computed in fixed bandpasses, shifted to , using Galactic reddening correction (Schlegel et al. 1998) and -corrections as described by Blanton et al. (2003). The mean evolution correction given by Tegmark et al. (2004), , is also applied. We adopt a flat CDM cosmology with and . The useful survey area of this sample, having nonzero angular selection function, is 1.362 sr. All galaxies in D3 are plotted in Figure 1.
2.2. Morphology Classification
Accurate morphology classification is critical in this work since the effects of interaction depend strongly on morphology of the target and neighbor galaxies. We first classify morphological types of galaxies using the prescription of Park & Choi (2005). Galaxies are divided into early (ellipticals and lenticulars) and late (spirals and irregulars) morphological types based on their locations in the color versus color gradient space and also in the -band concentration index space. The resulting morphological classification has completeness and reliability reaching 90%.
Our automatic classification scheme does not perform well when an early-type galaxy starts to overlap with other galaxy. This is because the scheme excludes galaxies with very low concentration from the early-type class and blended images often erroneously give low concentration. Since we are investigating the effects of close interaction on galaxy properties, this problem in the automatic classification has to be remedied. We perform an additional visual check of the color images of galaxies to correct misclassifications by the automated scheme for about galaxies having close neighbors. In this procedure we changed the types of the blended or merging galaxies, blue but elliptical-shaped galaxies, and dusty edge-on spirals. Some non-sense objects like blank fields and substructures of large galaxies, are removed from the samples, and some wrong central positions of merging galaxies are corrected.
After all these procedures our final sample is composed of 19,248 early-type galaxies, and 30,283 late-type galaxies with . Our main target galaxies for which we study the dependence of various physical parameters on environment, are those with . There are 9,434 early types and 14,270 late types satisfying this condition within the sample volume. This subset is marked by a rectangular box in Figure 1. In our analysis we often limit the late-type galaxy sample to those with isophotal axis ratio greater than 0.6. This is to reduce the effects of internal extinction on our results. The absolute magnitude and color of late-type galaxies with are very inaccurate (see Fig. 5 and 12 of Choi et al. 2007), and including them in the analysis introduces a large dispersion in luminosity of the volume-limited sample. Since it is essential to fix luminosity in many of our analyses, it is very important to reduce the internal extinction effects by using nearly face-on late-type galaxies. When we calculate the median values of galaxy parameters in section 3, we will take into account the fact that only a subset of late-type galaxies are being used. There are 8,344 late types with and in our sample. We also often divide our sample into four subsamples: early types having early-type nearest neighbor (the E-e galaxies), early types having late-type nearest neighbor (E-l), late types having early-type nearest neighbor (L-e), and late types having late-type nearest neighbor (L-l). There are 4675, 4759, 3423, and 4921 galaxies in these subsets, respectively, when only those with are counted in the case of late-type target galaxies.
2.3. Local environment
We consider three kinds of environmental factors. One is the mass density described by many neighboring galaxies over a few Mpc scale. This is called the large-scale background density. Another is the small-scale mass density attributed to the closest neighbor galaxy. The third is the morphology of the closest neighbor galaxy.
The background density at a given location of a galaxy is measured by
| (1) |
using the -band luminosity of the closest twenty galaxies in the sample. Here is the mean density of the universe, is the mass-to-light ratio of a galaxy, and is a smoothing filter function. Here the mass associated with a galaxy plus dark halo system is assumed to be proportional to the -band luminosity of the galaxy. The mean mass density within a sample of the total volume is obtained by
| (2) |
where the summation is over all galaxies brighter than in the sample. Only the relative mass–to–light ratios for early and late types are needed in equation (1) since ’s appear both in the numerator and denominator. We assume at the same -band luminosity. This is our choice of the connection of luminosity and morphology with the halo mass. It is based on the results given in section 2.5. We assume is constant with galaxy luminosity for a given morphological type. The mass-to-light ratio of galaxies is actually expected to be a monotonically increasing function of galaxy halo mass over the luminosity range of our sample (; see Figures 3 and 4 of Kim, Park, & Choi 2008). Then the overdensity of the high density regions will be underestimated. However, the relation between our mass density estimate and the true one is still monotonic, and only the labels of and will change. We find the mean mass density
| (3) |
where is the mass of a late-type galaxy with .
We use the spline-kernel weight for the background density estimation. We vary the size of the spline kernel to include twenty galaxies with within the kernel weighting. The spline kernel is adopted because it is centrally weighted, unlike the tophat or cylindrical kernel, and has a finite tail, unlike the Gaussian. Our kernel is also adaptive. An adaptive kernel constrained to include a fixed number of objects, allows more uniform smoothing in the ‘initial’ conditions compared to the method adopting a fixed-scale at the present epoch since the high density regions collapse while the under-dense regions expand as the universe evolves. The methods of calculating and the examination of the results are described in full detail by Park et al. (2008). Interested readers should refer to section 2.3 of the paper.
Our background density estimate spans the large-scale environment from voids to clusters. But the smoothing scale determined by 20 galaxies with is larger than the typical cluster virial radius, which is 1–2 Mpcs. Therefore, in our calculation never exceeds the virialization density , where is the critical density of the universe. Our sample includes massive clusters, and at the locations of cluster member galaxies ranges roughly from 50 to 400. At these densities cluster member galaxies are mixed with those outside clusters. In our forthcoming paper Park & Hwang (2008) we will resolve the virialized regions of Abell clusters, and study the dependence of galaxies within 10 times the cluster virial radius on the clustercentric radius and the nearest neighbor distance.
Our background density estimation is made using a spherically symmetric smoothing kernel and using the redshift space distribution of galaxies. In redshift space some of cluster member galaxies are stretched along the line of sight, appearing as fingers-of-god. This causes smearing of cluster galaxies into low density regions. Even though the fraction of galaxies dislocated by the redshift-space distortion more than our smoothing scale is small, a caution must be given to cases showing a very weak dependence on in our results.
The small-scale density experienced by a target galaxy attributed to its neighbor is estimated by
| (4) |
where is the projected separation of the nearest neighbor galaxy from the target galaxy. The density due to the nearest neighbor used in our work does not represent the galaxy number density at small-scales, but rather the local mass density given by the nearest neighbor itself. The method to find the nearest neighbor is described in the next section.
We will study the dependence of galaxy properties on the nearest neighbor distance normalized by the virial radius of the nearest neighbor. We define the virial radius of a galaxy as the projected radius where the mean mass density within the sphere with radius of is 200 times the critical density or 740 times the mean density of the universe, namely,
| (5) |
Since we adopt , . This is almost equal to the virialized density in the case of our CDM universe (Gott & Rees 1975). This is what Park et al. (2008) used to define the virial radius. According to our formulae the virial radii of galaxies with and are 260, 300, and 350 kpc for early types, and 210, 240, and 280 kpc for late types, respectively.
These sizes are much larger than the visible part of galaxies. Therefore, when we mention a galaxy, we actually mean the galaxy plus dark halo system. In the next section we will see the importance of the galaxy-component of the galaxy-halo systems during interactions. Besides the gravitational effects, the halo determines the size of the virial radius of a system and the domain of hydrodynamic influence. The galaxy determines which kind of hydrodynamic effects to occur.
2.4. The nearest neighbor
We define the nearest neighbor galaxy of a target galaxy as the one which is located closest to the galaxy on the sky and satisfies magnitude and radial velocity conditions. Suppose we are looking for the neighbors of a target galaxy with and with a certain morphological type. Its neighbors are defined as those with the absolute magnitudes brighter than and the radial velocity difference less than . We adopt and 600 km s-1 (early-type target) or 400 km s-1 (late-type target).
Our results below are insensitive to the choice of . But if is too large, the size of target galaxy sample becomes too small because the absolute magnitude limit of the full sample has the limit of and the target sample must have the limit of to be complete in neighbor sampling. We choose as the optimum case making the influential neighbors included and yet yielding good statistics. The galaxies within the rectangular box of Figure 1 is our major target galaxy sample. The reason that we use different limits to for early and late-type targets is explained in the next section.
Instead of the nearest one we have also tried to use the most-influential neighbor that produces the highest local density at the location of the target galaxy. Our results in the following sections are qualitatively the same when we use the most-influential neighbor instead of the nearest neighbor because the majority of the most-influential neighbors are actually the nearest ones.
2.5. Velocity difference between neighboring galaxies

The choice of is based on the pairwise velocity difference between target galaxies and their neighbors (see also section 2.4 of Park et al. 2008). For a given target galaxy with a given morphological type and with we searched for all neighbors with the projected separation of kpc. Figure 2 shows the distributions of the radial velocity difference between the target and neighbor for four cases; early-type target and early-type neighbor (circles), early-type target and late-type neighbor (squares), late-type target and early-type neighbor (crosses), and late-type target and late-type neighbor (stars). It is important to note that the velocity difference distributions for late-type target galaxies are quite different from those for early-type target galaxies. At fixed luminosity late types have smaller velocity difference with their neighbors than early types. A sample of galaxy pairs with small (say, km s-1) will be dominated by late-type galaxies, and that with large (say, km s-1) by early-type galaxies (see the discussion section for its systematic effects).
As can be seen in Figure 2, the velocity dispersion of neighboring galaxies around a dark halo is not simply defined since it depends on the morphology of the neighbors. The distributions can be fit well by the Gaussian function (solid and long-dashed curves) for early-type target galaxies, but by the exponential function (short dashed and dotted curves) for late-type targets. To fit the distributions we used the Gaussian plus constant model for early-type targets, and the exponential plus constant model for late-type targets, namely,
| (6) |
and
| (7) |
respectively. We obtained the best-fit values (E-e), (E-l), (L-e), and km s-1 (L-l). Our choices of the velocity limits km s-1 for early-type targets and 400 km s-1 for late types, take into account this dependence of pairwise velocity on morphology.
should also depend on luminosity, but our choice is a conservative one for galaxies brighter than and it is expected that the dependence is not strong. For example, if we extend the Faber-Jackson (Faber & Jackson 1976) or Tully-Fisher relations (Tully & Fisher 1977) to the kinematics of galaxy pairs and adopt a constant mass-to-light ratio, we obtain . So there will be 26% difference in on average for galaxies with one magnitude difference. For target galaxies brighter than the Gaussian fit gives 326 (E-e), 219 (E-l), 224 (L-e), and 152 (L-l) km s-1, for the four cases, and the ratios of between early and late-type target galaxies are 326/224 and 219/152, both close to 1.4.
Besides the morphology and luminosity dependence the velocity difference is also a function of . For the target galaxies with the neighbor galaxies located at kpc have velocity dispersions of 257, 153, 205, and 147 km s-1 for the four cases, respectively. The velocity dispersion becomes lower for early-type targets, but higher for late-type targets, and correspondingly, the ratio becomes smaller (1.0–1.2).
The relation between the velocity dispersion and the virial mass, , is needed to convert the measured velocity difference dispersion to the halo mass. Dark matter halo virial relation estimated from simulated CDM models yields (Evrard et al. 2008). An NFW halo with no or slightly anisotropic velocities have when the dispersion is measured at kpc (Conroy et al. 2007), and when the dispersion is measured at kpc (Prada et al. 2003). Figure 2 tells that the ratio of for early and late-type targets is about 1.4 for kpc. If we adopt , the ratio of dark halo virial mass for early and late-type targets will be about 2. This is why we adopted . Our main conclusions are essentially independent of this approximation.
3. Results
In this section we study the dependence of galaxy properties on three environmental factors; the nearest neighbor distance , nearest neighbor’s morphology and the large-scale background density . We are going to consider the physical parameters like morphology, -band luminosity, color, color gradient, equivalent width of the line, -band concentration index, central velocity dispersion, and -band Petrosian radius. These parameters reflect most of major physical properties of galaxies from morphology and mass to internal kinematics and SF activity.
In most cases we fix the absolute magnitude of target galaxies in a narrow range between and to examine the pure environmental effects with the effects due to the coupling of a parameter with luminosity taken out. We have also studied a set of brighter target galaxies with , and obtained qualitatively the same results but with much worse statistics. All late-type target galaxies with the -band isophotal axis ratio less than 0.6 are discarded in the following analysis whenever necessary in order to reduce the wrong trends that can be produced by the internal extinction and by the corresponding dispersion in luminosity (Choi et al. 2007).
3.1. Morphology
Park et al. (2008) made an extensive study of the dependence of galaxy morphology on the density attributed to the nearest neighbor and also on neighbor’s morphology. Dependence on the large-scale background density was also studied by analyzing subsets of galaxies located in three different bins of . It was found that, when luminosity is fixed, the probability for a randomly chosen target galaxy to have an early-type, , depends mostly on the projected separation when , the virial radius of the nearest neighbor galaxy. But when , depends on all three environmental factors in the sense that is an increasing function of both and when the neighbor is an early-type galaxy, but that first increases and then decreases as the galaxy approaches a late-type neighbor while it is still an increasing function of (see Figure 3 of Park et al. 2008).
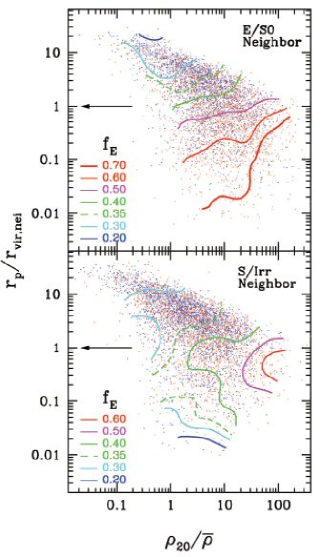
To clarify the morphology dependence on those environmental factors we inspect the behaviour of in the - parameter space in Figure 3. The absolute magnitude of target galaxies is limited to a narrower bin, , in order to reduce the effects of the correlation of morphology and density with luminosity. Figure 20 of Park et al. (2007) showed the same kind of plot, but neighbor’s morphology was not differentiated there.
The upper panel of Figure 3 shows the dependence of on and when the nearest neighbor is an early-type galaxy. The lower panel is the case when the neighbor is a late-type galaxy. Since the mean separation between galaxies decreases as the background density increases, there is a correlation between and . Because of this statistical correlation galaxies are distributed along the diagonal in the figure. But there is a large dispersion in at a given , particularly when or . For example, at a fixed large-scale background density of the separation to the nearest neighbor of an early-type galaxy with can be as small as 0.003 Mpc or as large as 2 Mpc. We will see a large variation in galaxy properties as changes while is fixed. When is very small, however, the correlation is tight and the information in and is rather redundant. When is higher than , most tight pairs with are early-type galaxies.
Smooth distributions of are obtained from the ratio of the sum of weighted number of early types to the sum of weighted number of all galaxies within the smoothing kernel at each point of the parameter space. A fixed-size spline-kernel is used to give the weights. Contours denote the constant levels of and are limited to regions with statistical significance above .
A striking difference between two contour plots is seen where , namely when the target galaxy is located inside the virial radius of its neighbor. If the neighbor is an early-type galaxy, the contours have positive slopes there, meaning that is increasing for decreasing and increasing . But if the neighbor is a late-type galaxy, the contours have negative slopes, telling that decreases for decreasing even though it is still an increasing function of . At a fixed , has a maximum at for the late-type neighbor case. This scale corresponds to kpc for the late types in our sample. Galaxies having their late-type neighbors within this critical distance, start to have significant hydrodynamic effects from neighbor. Sensitivity of to exists mainly within the virialized region with .
When both panels show that galaxy morphology depends mostly on and is nearly independent of background density as can be noticed from nearly horizontal contours. Contours at are slightly contaminated by the trend that the galaxies at the upper edge of the distribution, having the largest at a given , are relatively brighter and tend to be earlier in type (see Fig. 5 below). As we decrease the absolute magnitude bin size, the contours become flatter, and show weaker dependences on in this pair separation range. But a slight dependence of on seems persisting at for the early-type neighbor case.
Figure 3 confirms Park et al.(2008)’s findings that the effects of the nearest neighbors are critically important to galaxy morphology and that the large-scale density matters only when pairs are closer than the virial radius.
The early-type fraction can be very high in very high large-scale density regions even when the neighbor is a late type. On the other hand, for the isolated galaxies with located in very low density regions (), the early-type fraction asymptotically approaches about 0.2, which might be the inborn morphology fraction because the galaxy interaction and merger rates are low there. Gott & Thuan (1976) proposed that galaxy morphology is determined by the amount of gas left over at maximum collapse of the protogalaxy. Primordial elliptical galaxies are expected to form if star formation is finished by the time of maximum collapse. This can happen if the star formation time scale is shorter than the collapse time, which is more likely in high density regions. In reality, according to simulations galaxies continously accrete gas and other objects till the present time, and it is difficult for SF to end in the course of formation.
It is also conceivable that an isolated system of late-type galaxies is formed in low density regions and transforms to an isolate early-type galaxy by consuming all cold gas in the system through a series of close interactions and mergers (Park et al. 2008). These isolated early types cannot be formed by the mechanisms like strangulation because they have no nearby larger halo. This kind of early types is analogous to the central dominant elliptical galaxies in the ‘fossil groups’ which is the end-result of galaxy mergers (Jones et al. 2003; Ulmer et al. 2005; Mendes de Oliveira et al. 2006; D’Onghia et al. 2005; Adami, Susseil, & Durret 2007; von Benda-Beckmann et al. 2008 and references therein). On the other hand, a merged object can become an early-type galaxy due to the AGN heating (Croton & Farrar 2008) and remain isolated.
3.2. Luminosity
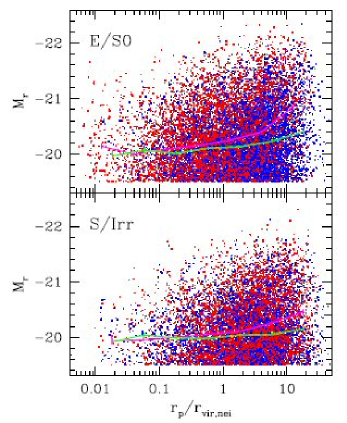
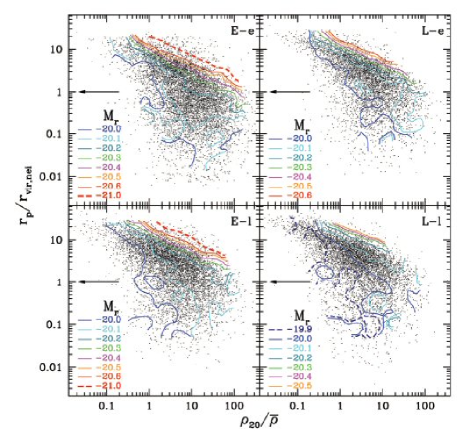
Figure 4 shows the -band absolute magnitude of galaxies as a function of . The lines are the median relations. We use all target galaxies with in this section. Late types with the axis ratio are still discarded because their absolute magnitudes are not reliable. As Figure 6 of Park et al. (2008) showed, more isolated galaxies are brighter on average and such trend is greater for early-type galaxies. Figure 4 also shows that galaxies with an early-type neighbor are much brighter than those with a late-type neighbor when they have relatively large separations from neighbor ().
Figure 5 shows that the dependence of on and . Smooth distributions of are found by the following method (it is applied to all panels in Figs. 5, 7, and 9). At each location of the - space, where a smoothed median value is to be estimated, we first sort the parameter values of the galaxies contained within a certain radius from the location. In the case of the tophat smoothing, these galaxies get a uniform weight and the median would be the value of the -th galaxy when the total number of galaxies within the smoothing radius is . We adopt a spline kernel smoothing for more accurate results. We assign a spline kernel weight to each galaxy within the smoothing radius. The median is given by the parameter value of the -th galaxy in the sorted list, where is the sum of all weights given to the galaxies within the smoothing kernel. The median represents the typical value of a physical parameter more reliably than the mean, when the distribution is very skewed as in the case of in particular.
Figure 5 shows that there is strong environmental dependence of at separations while such dependence fades away at smaller separations. At the absolute magnitude fluctuates within 0.1 magnitude in all panels without showing significant dependence on or . One should note that a single horizontal or vertical contour does not show any environmental dependence. There should be a significant gradient in revealed by a series of parallel contours with different levels in order to claim a dependence. At a given large-scale density the brightest galaxies are those having the largest , namely the most isolated ones. The -dependence of luminosity persists from very high density regions to well-inside the voids. The void galaxies are also participating in luminosity evolution, but the speed of the evolution is slow because of fewer neighbors.
A fact noted from Figure 5 is that such a trend exists in all density environments, all the way from voids to very high density regions with (but note that we cannot resolve the cluster regions where itself is higher than the virialized density). Figure 5 also shows that the luminosity-density relation (the horizontal direction in Fig. 5) is a very strong function of neighbor distance. For example, in the case of the E-e galaxies, luminosity of very isolated galaxies with rises quickly as increases and reaches at the density as low as . But for galaxies with it rises much slowly for increasing and reaches only at . The typical luminosity of the galaxies with neighbors at much closer distances never reaches this magnitude.
It can be also noted from Figure 5 that the early-type galaxies tend not to have late-type neighbors at very small distances. There is almost no E-l galaxy at while many E-e galaxies have close neighbors at these separations (compare the scatter plots in the left column of Fig. 5). This may be because the early-type galaxies having their late-type neighbors at can acquire enough cold gas and transform their own morphology to late type. In fact, there are more such tight L-l galaxies than E-l galaxies as can be seen in the two bottom panels of Figure 5. Evidence for the morphology transformation from an early to a late type has been presented by Park et al. (2008).
3.3. color
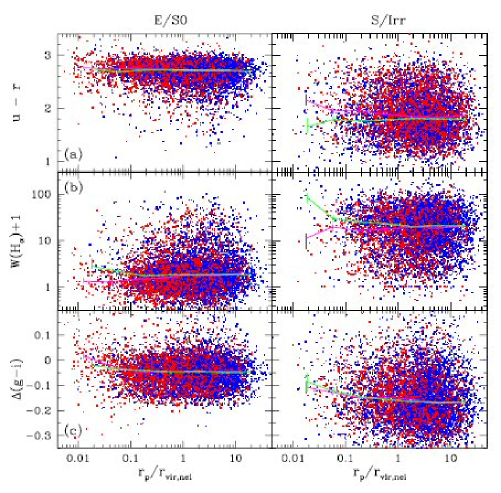
Figure 6 shows variations of three physical parameters of our target galaxies with as a function of pair separation normalized to the virial radius of their nearest neighbor. Left panels are for the early-type target galaxies, and right panels for the late types. In each panel red points are galaxies with early-type neighbors, and blue points are those with late-type neighbors. Their median values are shown by magenta and green lines, respectively.
Top left panel shows that the color of early-type galaxies hardly changes as they approach neighbors. Even when the neighbor is a late-type galaxy, the change is very small, which is surprising because morphology of target galaxies is strongly affected by the neighbor distance and tends to become a late type when the neighbor is a late type. The main reason for this is, of course, because the subsample is already restricted to early types whose color shows a small dispersion. But our subsamples are not simply divided by color, but divided according to morphology as much as possible (Park & Choi 2005) and correspondingly the early-type subsample contains many blue galaxies. For example, among the early types plotted in Figure 6 more than 7% have color bluer than 2.4. One could expect to see some blueing trend for early types interacting with a late type. Even though the total color does not change much, we will see below that the SF activity of early-type galaxies having late-type neighbors is actually enhanced when the separation is much smaller than the virial radius, suggesting cold gas transfer from their neighbors.
The upper right panel of Figure 6 shows that, when the target galaxy is a late type, its color clearly becomes redder as it approaches an early-type neighbor, but does not change much if the neighbor is a late type. The bifurcation occurs at . From Figure 6 one can understand why it has been so difficult to detect the change in color for interacting pairs (de Propris et al. 2005). Early types do not show any significant changes, and the changes in late types depend on neighbor’s morphology. Without dividing the sample according to target’s and neighbor’s morphology one would find little change in color.
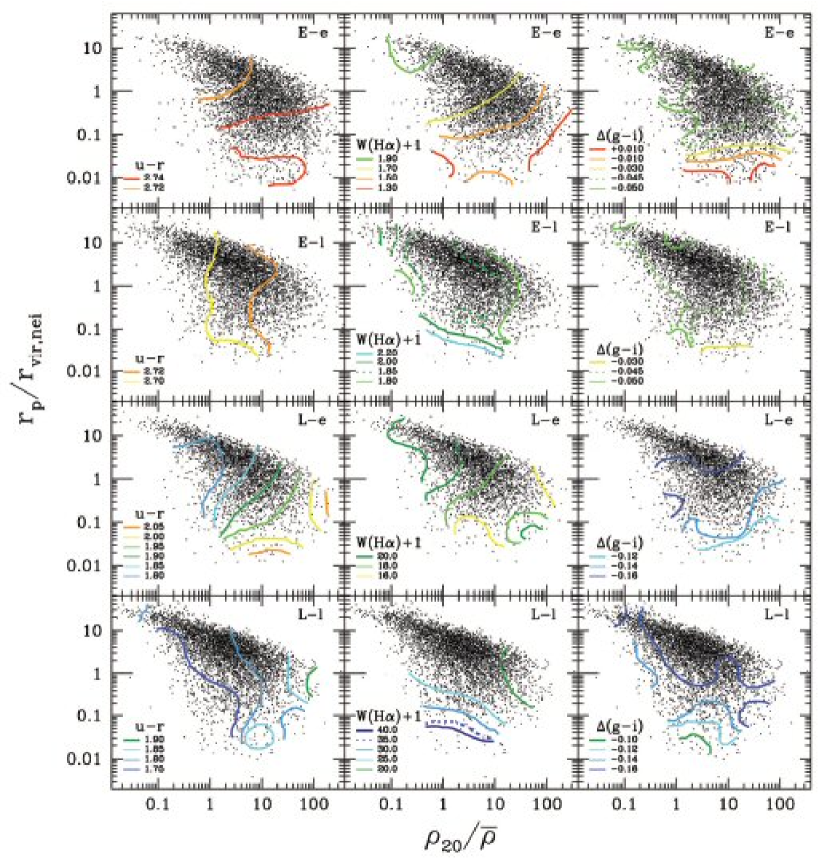
In the left column of Figure 7 the behaviour of the median color in the - space is inspected. We again find that the color of early types is very insensitive to both abd . The median color of the early-type galaxies having an early-type neighbor (the E-e galaxies) or a late-type neighbor (the E-l galaxies) varies only about 0.02 in the - space.
The bottom two panels of the left column of Figure 7 show the median color contours for late-type target galaxies. It can be seen that the color of the L-e galaxies depends on weakly when but strongly for . The dependence is negligible at . The L-l galaxies tend to be slightly bluer as decreases. This is why the L-e and L-l cases start to separate from each other at and then diverge at .
Figure 7 also shows that, when , late-type galaxies become redder as their background density becomes higher. This weak residual dependence of color of late-type galaxies on after fixing luminosity has been also reported by Park et al. (2007). The residual dependence is weak; the total variation in of late types is about 0.2 magnitude as varies from 0.1 to 100. If luminosity or morphology are not fixed, the color variation is much larger (see Fig. 11 of Park et al. 2007). The large-scale density dependence of is probably a result of the accumulated effects of galaxy-galaxy interactions and mergers whose frequency is higher in higher density regions.
An interesting fact from these plots is that the dependence of color on becomes negligible when , which can be noticed from widening of contour separation and serpentine contours at small . We will also see in the next section that the SF activity as measured by does not depend on the background density either when and .
On the other hand, when the background density is very high (), the color of late-type galaxies appears to depend only on . The density range corresponds to the cluster environment, and a cluster acts like a giant early-type galaxy transforming member galaxies into redder ones. Recently, Park & Hwang (2008) have studied properties of galaxies near and within Abell clusters, and found a characteristic scale of times the cluster virial radius across which various galaxy properties suddenly start to show dependence on the clustercentric radius. Since the cluster galaxies are smeared along the line of sight due to the finger-of-god effect in our analysis, reddening of late types due to clusters is expected to appear rather smoothly as a function of .
Kauffmann et al. (2004) claimed that the SF history-density correlation is sensitive to small-scale density, but that there is no evidence for the SF history to depend on large-scale ( Mpc) density. We find in Figure 7 that the color as a measure of SF history is nearly independent of small and large-scale environments for early-type galaxies, but depends on both for late-type galaxies even at fixed luminosity.
3.4. Equivalent width of the line
Figure 6b (middle panels) shows variations of the equivalent width of the line, a measure of the SF activity, as a function of for the early-type (left) and late-type (right) target galaxies with . Galaxies are again distinguished between those having an early-type neighbor (red dots, magenta line) and those having a late-type neighbor (blue dots, green line). Even though the total color of early-type galaxies is not much affected by interactions, the SF activity measured by clearly shows dependence on and neighbor’s morphology. This tells us that the color is simply not a very sensitive SF indicator, especially for massive galaxies.
Early-type galaxies show slightly reduced SF activity when they approach an early-type neighbor. But the E-l galaxies show relatively stronger line emission at , and the gap between two cases becomes wider at .
of late-type galaxies shows more dramatic variations as changes. In the right panel of the L-e galaxies is nearly constant down to and then starts to drop below the separation. But of the L-l galaxies starts to rise at and increases rapidly below . The two cases start to bifurcate at and to diverge at as in the case.
We note there are two characteristic scales in the effects of galaxy-galaxy interactions on the SF activity. The first scale is the virial radius of the nearest neighbor galaxy where difference in morphology of the nearest neighbor starts to make the SF activity bifurcate. The second one is the merger scale, about 0.05 times the virial radius, where the effects diverge depending on the neighbor morphology. Since the virial radius of an early or late-type galaxy with is 300 or 240 kpc, at the separation kpc, a pair of such galaxies should start to physically contact to each other.
The middle column of Figure 7 shows dependence of on and for four cases. The two top panels indicate that the SF activity of early types depends on neighbor’s morphology. The E-l galaxies shows overall higher compared to the E-e galaxies, and the direction of dependence of on is opposite for the two cases. We also find that of early-type galaxies decreases slightly as increases. The dependence of , however, does not always exist, but exists only over a certain range that depends on the neighbor morphology.
For late-type galaxies (two bottom panels) the effects of early- and late-type neighbors are clearly distinguished. The SF activity of late types is enhanced significantly as they approach late-type neighbors, but quenched slightly as they approach early-type neighbors. In the L-l case the dependence on at small is qualitatively similar to the E-l case. The scale of occurrence of the dependence depends on . Enhancement of SF activity by late-type neighbors occurs at smaller neighbor separation in higher regions. This can happen if late-type neighbor galaxies tend to be less gas-rich, and the cold gas flow from late-type neighbors is less efficient in higher density regions. In all four cases the SF activity does not depend on both and when galaxies are isolated () and when the background density is small .
Balogh et al. (2004b) analyzed the galaxies and groups in the 2dF Galaxy Redshift Survey data and the SDSS data, and reported that the fraction of star forming galaxies varied strongly with the background density (see also Balogh et al. 2004a). The signal they found must be mostly due to the correlation of the background density with luminosity and morphology. They looked at faint late-type galaxies in low density regions, but bright early types at high densities. Once luminosity and morphology are fixed, the SF activity in galaxies depends very weakly on the background density as shown in Figure 13c of Park et al. (2007) and in Figure 7 of this work. Balogh et al. (2004b) also presented evidence that the fraction of emitting galaxies is mostly dependent on the small-scale environment at high densities, but on the large-scale environment at low densities. We found different results. The second column of Figure 7 shows that the SF activity of late-type galaxies having a late-type neighbor depends differently on at different in such a way that in higher density regions the SF activity rises at smaller . But there is only a weak trend that is opposite to this for the L-e galaxies.
Nikolic et al. (2004) claimed that the mean SF activity is significantly enhanced for kpc. For late-type targets the enhancement is found out to 300 kpc regardless of neighbor’s morphology. We find their results are true only when the neighbor (or target) galaxy is a late type. For the ‘L-l’ galaxies we find the enhancement of SF activity extends out to kpc. But when the neighbor is an early type, the SF activity drops at kpc or at . This shows us again that the effects of interaction become manifest when the sample is split according to the morphology of target and neighbor galaxies. They also reported that there is no dependence of the SF activity on neighbor morphology nor mass. This is certainly not supported by our results.
Alonso et al. (2006) reported that there is a threshold for the SF activity induced by interactions at kpc. We do not find evidence for a threshold at that scale. Our results suggest thresholds only at the virial radius and merger scale, which are roughly and kpc for galaxies in our sample, respectively. They also found that interactions are more effective at triggering SF activity in low and moderate density environments. This is consistent with our results only when the neighbor galaxy is a late type. In the second and bottom panels (the E-l and L-l cases) of Figure 7 one can see starts to increase at in very low density regions but at in high density regions. The influence of early-type neighbors is weaker in low density regions, and the SF activity is less suppressed.
3.5. color gradient
We use the color difference between the central region with and the annulus with as a measure of color gradient. Here is the Petrosian radius (Petrosian 1976; Blanton et al. 2001) in the -band. The difference is made in such a way that positive means a bluer central region relative to the outer region. We corrected for the inclination and seeing effects as described by Park & Choi (2005) and Choi et al. (2007). We use the gradient in color rather than color because the -band surface photometry is noisy for some galaxies. But the surface photometry of SDSS galaxies in the , and -bands can be done relatively accurately for those in the spectroscopic sample (apparent -band magnitude ).
The bottom panels of Figure 6 clearly show that the central region of galaxies undergoing interactions and mergers becomes bluer relative to the outside. For early-type target galaxies the effects are manifest only well within the virial radius. But for late types the effects start to appear at separations larger than . Difference due to different neighbor morphology is small, which might seem inconsistent with the trends seen for and .
If the dependence of color and SF activity on neighbor’s morphology is because of difference in the influence of cold and hot gases of the neighbor galaxy, one might think the color gradient depends on also differently for different neighbor morphology. But Figure 6 shows the color gradient always increases for decreasing independently of the morphology of target and neighbor galaxies. It means that, as early-type galaxies approach their neighbors, the central part becomes bluer but the outer part becomes redder, making the color gradient increase but their total color remain almost the same. For late-type galaxies the center becomes bluer for both early and late-type neighbor cases, but the outer part becomes much redder for the early-type neighbor case, making the total color redder.
Early-type galaxies must be significantly reducing the SF activity in the outer part of their neighboring late-type galaxies. It is known that the SF activity of late-type galaxies in clusters is severely reduced in the outer disk, with normal or enhanced activity in the inner disk (Boselli & Gavazzi 2006). In other words, the color gradient of late types becomes more positive (redder outside) in the cluster environment. Quenched SF activity in cluster spirals is often explained by the gas depletion through hydrodynamic interactions with the hot intracluster medium such as the ram pressure stripping, viscous stripping, thermal evaporation, and strangulation (cf. Boselli & Gavazzi 2006 and references therein). We now find in Figure 6 that late-type galaxies in general environment experience very similar changes in the SF activity. In particular, when they approach an early-type galaxy (instead of a cluster), they show redder total color, reduced SF activity, and more positive color gradient.
It is important to note that the SF quenching phenomenon is now found for late-type galaxies outside the cluster environment (see the discussion section below for possible mechanisms). Figure 7 shows that an approach to an early-type neighbor makes a late-type galaxy redder in color, weaker in and more positive in color gradient in any background density environment (see the panels in the third row of Fig. 7).
3.6. Concentration
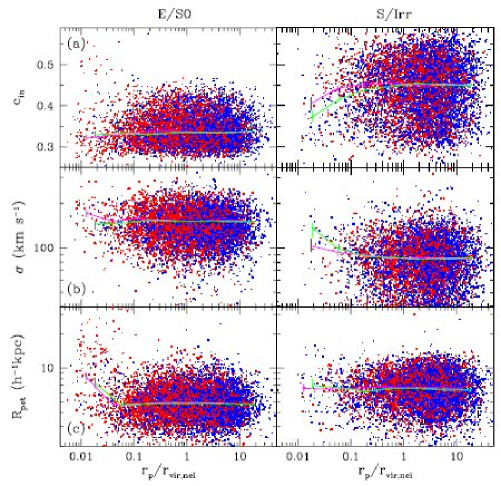
We adopt the inverse concentration index to quantify the radial surface brightness profile of galaxies. It is defined by where and are the semi-major axis lengths of ellipses containing 50% and 90% of the Petrosian flux in the -band, respectively, and is corrected for the seeing effects (Park & Choi 2005).
Top panels of Figure 8 show the dependence of on the pair separation. Early-type galaxies show smaller change in concentration as they approach neighbors probably because they are tidally more stable due to smaller size and compactness, and also because the tidal energy deposit is relatively smaller as the relative velocity with the neighbor is higher for early types than for late types (see Fig. 2). Figure 8 tells that galaxies become more concentrated as they approach their neighbors. But we note a very slight tendency that of the E-e galaxies first increases and then decreases as decreases. When the galaxy undergoes a merger at , the dispersion in becomes large. When galaxies are merging, some fraction of mass escapes from them and form tidal tails and bridges. This makes the Petrosian radius usually larger and uncertain. Likewise, becomes uncertain too.
The tendency that galaxies become more concentrated as they approach their neighbors inside the virial radius is much stronger for late types. This may be because late types are tidally more vulnerable due to their larger size and lower concentration than early types and because the velocity difference of late-type target galaxies with their neighbors is relatively smaller and correspondingly the tidal energy deposit is larger. The effects are even stronger for the late-type neighbor case because the velocity difference between the target and neighbor is even lower in this case as shown in Figure 2. More discussion is given in section 4.
A closer look at the variation of reveals that of late types actually first increases and then decreases as decreases, but the increase is very small and the scale of the maximum (least concentration) differs for different neighbor morphology ( and or and Mpc for early and late-type neighbor cases, respectively). This compares with Nikolic et al. (2004)’s result that peaks at kpc when morphological types of interacting galaxies are ignored. The typical value of is quite different for early and late-type galaxies, and the mean morphology of interacting galaxies varies depending on the pair separation. Therefore, if the morphological type of the target galaxies is not distinguished, in addition to the genuine trend caused by interaction, one will also see an apparent trend in caused by the change in the average morphology of the target galaxy as we change .
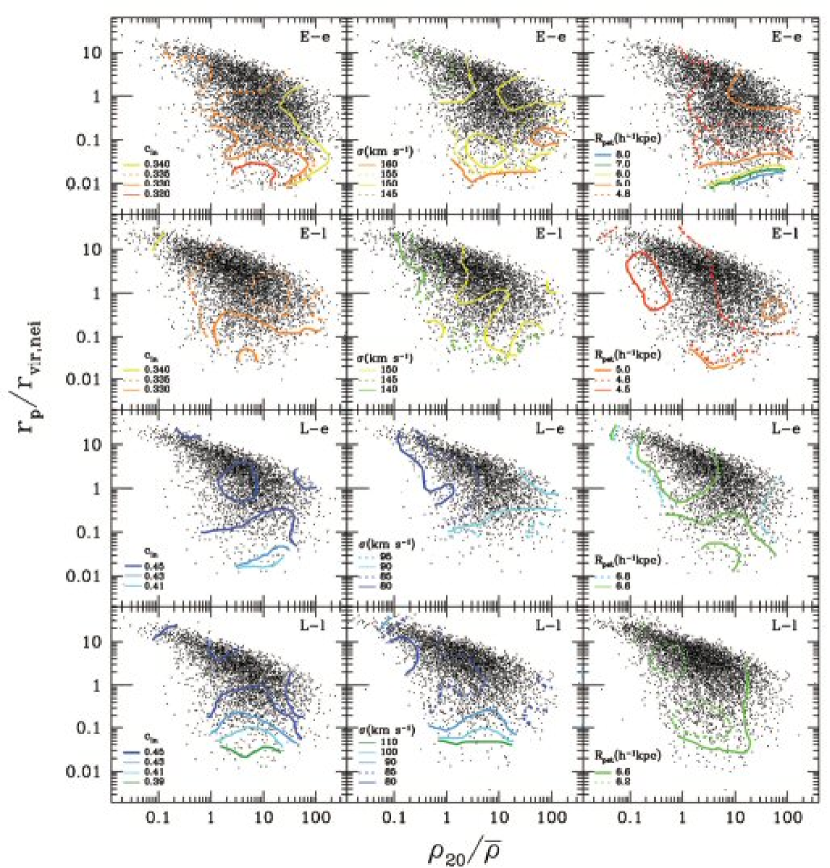
The distribution of in the - space shown in the left column of Figure 9, confirms the very weak decline of for decreasing in the case of early-type galaxies (with a weak maximum for the E-e case), and a strong decrease for decreasing in the case of late-type galaxies. Most contours in Figure 7 and 9 below look noisy particularly when . This is mainly because galaxy properties are almost independent of both and when galaxy luminosity and morphology are fixed, and not because statistical uncertainties are large.
When , varies within 0.005 in all cases. When , increases weakly with for the E-e galaxies, but does not show a dependence on for the E-l galaxies. The fact that dependence of early-type galaxies depends on neighbor morphology and the fact that the dependence of the E-e galaxies depends on the neighbor distance , together imply that is not directly affecting . The bottom two panels of Figure 9 shows a strong increases of concentration for late-type galaxies as decreases. But the dependence of on is not clear. According to Park & Hwang (2008), of late types decreases as the clustercentric radius becomes less than the cluster virial radius.
Figure 11c of Park et al. (2007) showed that is nearly constant of for bright early-type galaxies but increases very slightly with for the galaxies much fainter than . Note that our target galaxies are basically galaxies for which the background density dependence of is expected to be small.
Our result is consistent with that of Blanton et al. (2005a) who claimed that structural properties of galaxies are less closely related to galaxy ‘environment’ than are their masses and SF histories. However, this is true only for the large-scale background density environment. We found a significant dependence of galaxy structural parameters ( in this section and the central velocity dispersion in the next section) on the environmental factors like neighbor distance and morphology. van der Wel (2008) has studied the dependence of galaxy morphology and structure on environment and stellar mass, and concluded that galaxy structure mainly depends on galaxy mass but morphology mainly depends on environment. Even when both galaxy luminosity and morphology are fixed, we still find galaxy structure depends sensitively on the neighbor environment.
3.7. Central velocity dispersion
We use the velocity dispersion measured by an automated spectroscopic pipeline called IDLSPEC2D version 5 (D. J. Schlegel et al. 2008, in preparation). Galaxy spectra of SDSS galaxies are obtained by optical fibers with angular radius of . The central velocity dispersion measurement has been corrected for the smoothing effects due to the finite size of the optical fiber (see section 3.1 of Choi et al. 2007). Taking into account the finite resolution of the spectrographs, we discarded galaxies with km s-1.
The middle panels of Figure 8 show variations of as a function of for the four cases. Early types hardly change their central velocity dispersion, which may be again because early types are fast, compact, tightly bound, and correspondingly are tidally more stable. The central velocity dispersion of late-type galaxies monotonically increases as they approach their neighbors within . The increase is stronger when the neighbor is a late type. It is very likely that this is because the late-type neighbor on average has a smaller relative velocity (see Fig. 2), and therefore produce more tidal energy deposit than an early-type neighbor. Coziol & Plauchu-Frayn (2007) have recently inspected asymmetries in galaxies pairs, and concluded that the features are consistent with tidal effects produced by companions.
The middle column of Figure 9 shows the dependence of on both and for the four cases. In all cases we notice that slightly increases as increases which was also shown in Figure 13b of Park et al. (2007) for galaxies with or . Interestingly, the increase mainly occurs in low and intermediate density regions. The top two panels show that increases at the smallest at fixed for the E-e galaxies, but is nearly a constant as decreases for the E-l galaxies. In the case of the L-e galaxies, the -dependence of starts to appear within . The neighbor dependence is strong for the L-l galaxies, in particular.
3.8. Size
We use the Petrosian radius (Graham et al. 2005) as a measure of galaxy size. It is measured from the -band images taking into account inclination and seeing (Choi et al. 2007). In the case of late-type target galaxies, we are using only those with the -band isophotal ratio greater than 0.6. The bottom panels of Figure 8 show variations of as a function of the pair separation. A prominent feature in this plot is that the early-type galaxies appear much larger at while such increase in size is not noticeable for late-type galaxies.
The size of early-type galaxies in very close pairs may have been systematically overestimated because of blending. When undergoing mergers, early types are expected to survive longer than late types because they are relatively more compact and faster. Furthermore, the neighbor undergoing a merger with an early-type galaxy is very likely to be an early type too (Park et al. 2008). It would be difficult to define a boundary for a tight pair of early-type galaxies with smooth distribution of stars. Some of early types can be still identified as separate objects even at kpc when their outer extended envelopes are already merged with those of their neighbors, and the size of such galaxies can be easily overestimated. On the other hand, since the pairwise velocity is smaller for late types, it is expected that their cores merge relatively quickly and that there are relatively fewer late-type pairs with very small separations. Size of late-type galaxies is determined by the light from disk which has the boundary relatively abrupt compared to those of early-type galaxies. This may be why there is no very tight late-type pair and why an increase in at small is not observed for late types.
The top two panels of the right column of Figure 9 show in the - plane for the early-type galaxies. They show that first slightly decrease between and then increase at shorter separations. The size of the E-e galaxies increases rapidly at , and the actual scale the galaxy size starts to rise depends on . The E-e galaxies in high density regions appear larger than those in low density regions when they merge. Except for this merger scales the size of early types hardly depends on or . The size of late-type target galaxies, shown in the bottom two panels, is nearly independent of both and .
Galaxy size depends strongly on luminosity and morphology as shown by Figure 4 of Choi et al. (2007). For example, the typical value of of early types varies from 3 to kpc, and that of late types varies from 4.5 to kpc as changes from to . Correspondingly, of a random galaxy varies significantly as or varies because the average morphology and luminosity change too. But once we fix morphology and luminosity within one magnitude, is effectively fixed showing variation less than 0.5 kpc except for early types undergoing mergers.
4. Discussion
In the previous section various physical parameters of galaxies are studied as a function of three environmental factors; the nearest neighbor distance, the nearest neighbor’s morphology, and the large-scale background density. An important finding was that the virial radius of the galaxy plus dark halo systems acts as a landmark where most of the galaxy properties start to be sensitive to both nearest neighbor’s distance and morphology. If the SF activity of galaxies in pairs, for example, is enhanced due to the internal mass perturbed by the tidal force of the neighbor, it will be always enhanced by the galaxy-galaxy interactions. Contrary to this expectation, the middle panels of Figure 6 and the second column of Figure 7 show that it can be enhanced or suppressed depending on neighbor galaxy’s morphology unless the background density is very high. The fact suggests that it is neighbor galaxy’s cold or hot gas that enhances or suppresses the SF activity, respectively, when their separation is less than the virial radius. On the other hand, the structural parameters changes with in the same direction independently of neighbor’s morphology. This tells that galaxies also evolve through gravitational effects as they approach each other.
Which physical mechanism is responsible for the correlation in morphology and SF activity between neighboring galaxies? Why do they suddenly care about neighbor’s morphology when they are closer than the virial radius? One possible explanation is the primordial origin. Galaxies close from each other form to have similar morphology and SF activity since they are located in nearly the same large-scale environment. But this scenario can not explain why galaxy properties suddenly start to change according to the neighbor morphology at the virial radius. The crossing time of galaxies across the virial radius is of order of yrs, much shorter than the age of the universe. Even if there existed a primordial correlation among galaxies in physical properties over the scale of the dark halo virial radius, such a sharp transition in correlation will be wiped out due to the infall of new neighbors in the course of time.
A physical process that can explain such an onset of conformity in morphology and SF activity at a characteristic separation, is the direct hydrodynamic interactions between approaching galaxies. A galaxy plus dark halo system contains hot halo gas and/or cold disk gas which are confined within the virial radius of the system. When a late-type galaxy enters within the virial radius of its early-type neighbor, it will start to experience the hot gas pressure in the neighbor system’s halo. The physical processes acting in this situation can be ram pressure effects due to the collision with the hot gas ball of the neighbor.
The thermal evaporation and viscous stripping of the late type’s disk gas during the passage through the hot halo gas, are less able to account for the sharp transition because there is a time-delay for these processes to change galaxy properties significantly. Likewise the quenching of SF after a shutoff of cold gas supply from the halo gas (strangulation) is less likely too because, even if the galaxy really loses its halo gas, there will be a significant time delay for the disk gas to be consumed. If two galaxies are gravitationally bound, however, they will orbit each other within the virial radius. Then intense hydrodynamic interactions can occur repeatly many times or continuously before they merge, and all above processes can contribute to change the properties of the orbiting galaxies. Since they will remain within the virial radius as they orbit, the onset of correlation in galaxy properties at the virial radius can be observed.
According to numerical simulations, interacting galaxies can start to transfer their mass after they pass the closest approach point even though the actual results depend critically on the interaction parameters (Toomre & Toomre 1972; Mihos & Hernquist 1994; Wallin & Stuart 1992). Then, it is conceivable that an early-type galaxy enters a late-type galaxy’s virial radius, acquires some cold gas with angular momentum enough to form a disk, and transforms itself to a late type (Park et al. 2008). This mass transfer may be the reason why a galaxy becomes more likely to be a late type as it approaches a late-type neighbor galaxy within the virial radius even though it tends to be an early type as it approaches the late-type neighbor outside the virial radius (see Fig. 3 in section 3 and Fig. 3 of Park et al. 2008).
In addition to the dependence on the nearest neighbor separation, galaxy properties also show dependence on the large-scale background density. The dependence is strong only for morphology and luminosity. Very interestingly, the background density dependence of morphology appears clearly only when a galaxy is located inside the virial radius of its neighbor. The reverse is true for luminosity; the background density dependence of luminosity can be seen only when a galaxy is outside the neighbor’s virial radius. If the background density gives direct impacts on galaxy morphology, both isolated galaxies and galaxies in pairs should also respect the background density. But they do not.
Let us consider the reason for the relation between the large-scale density and morphology. Figure 3 shows that the early-type fraction monotonically increases as increases for both early and late-type neighbor cases when . The fact that the background density dependence is manifest only when a galaxy is sitting inside its neighbor’s virial radius, rules out the simple primordial origin scenario like that the relation is caused by the elliptical galaxies that preferentially formed in higher density regions. This is because Figure 3 shows isolated galaxies with are almost ignorant of the background density.
One might also consider the effects of other neighbor galaxies, like the second and third nearest ones, which are monotonically increasing as the background density increases. But it again cannot explain why the virial radius of the nearest neighbor should be the critical boundary for the onset of the background density dependence. Then, one would naturally suspect that some of the internal properties of the nearest neighbor galaxies depend on the background density in such a way that the strength of the neighbor influence is different at different background densities.
Park et al. (2008) proposed that the background density dependence occurs due to the variation of hot halo gas property of galaxies. In higher density regions, the halo gas of both early and late-type galaxies seems on average hotter and denser. Galaxies with the same morphology, luminosity, and pair separation but, located in higher density regions are redder and less active than those in lower density regions (Fig. 7). This may be because the halo gas is maintained hotter and denser for the galaxies in higher density regions due to some internal heating mechanisms (like supernovae and active galactic nuclei) and external confining material.
This suggestion is yet to confirm observationally. It is well-known that the X-ray luminosities of early types correlate with optical luminosity (see review by Mathews & Brighenti 2003). More luminous early-type galaxies have larger , but with large scatter, than those of low luminosity. The large scatter in the correlation has been explained in terms of some specific environmental effect on X-ray emission from galaxies (Brighenti & Mathew 1998; Brown & Bregman 1998; Brown & Bregman 2000; Helsdon et al. 2001; O’Sullivan et al. 2001; Ellis & O’Sullivan 2006; Jeltema et al. 2008). Brown & Bregman (2000) found that early types in denser environments have larger and suggested that the X-ray luminosity is enhanced through accretion of the intergalactic gas or supression of galactic winds by the ambient medium, whereas other authors found that galaxies in regions of high local galaxy density have lower (White & Sarazin 1991; Henriksen & Cousineau 1999). Helsdon et al. (2001) and Matsushita (2001) suggested that the result of Brown & Bregman is thought to be due to the large fraction of luminous central-dominant group galaxies in the sample that are enhanced in due to an additional contribution from the intragroup or circumgalactic hot gas (e.g. group cooling flows) and isolated and non-central group galaxies show no significant correlation between and environment.
Let us now consider the second major finding that more isolated galaxies are relatively brighter at fixed background density. It has been interpreted by Park et al. (2008) as evidence for transformation of galaxy luminosity class through the merger process. The transformation rate through mergers should be higher in higher background density regions and the dependence of luminosity on the pair separation be stronger in high density regions (but note that we are not resolving massive clusters where mergers between ordinary galaxies are expected to be difficult to happen). At a given background density morphology and luminosity transformations can occur through galaxy interactions and mergers. And the background density will statistically control the speed of the coupled evolution of morphology and luminosity. Considering the definite dependence of morphology and luminosity on the neighbor distance at the present epoch and high redshifts (Hwang & Park 2008), one can draw a conclusion that these processes are the key galaxy evolution mechanisms in addition to those like cold gas accretion and internal passive evolution which happen without resorting to neighboring galaxies.
Why is the correlation between luminosity and pair separation strong only when the pair separation is larger than the virial radius of the neighbor? It can be explained if recently merged galaxies have larger than from the new nearest neighbor (i.e. a pair of galaxies having vanishing merge each other and jump to large after merger). This is possible because a pair of galaxies would merge more easily if they are located outside the virial radius of another larger galaxy. Park et al. (2008) found, in a search for evidence for this interpretation, that at fixed background density the isolated galaxies with show the post-merger features more frequently than those with , particularly in high density regions. Therefore, among the galaxies located at the same background density, more-isolated ones are more likely to be recent merger products than less-isolated ones and are likely to be brighter. This does not mean isolated galaxies in general have experienced recent merger events. Isolated galaxies are preferentially located in low density regions where the merger rate is low, are on average expected to be passively evolving with less environmental influence. Those who want to analyze passively evolving galaxies must sample isolated galaxies located in low density regions only.
Our third major finding is that, once morphology and luminosity are fixed, the remaining properties of galaxies are quite insensitive to the background density, particularly when . One noticeable exception is color. The color of late-type galaxies shows a weak residual dependence on the background density above the mean density even if both morphology and luminosity are fixed and even when they are isolated. If galaxies maintain hotter and denser halo gas in higher density regions as we propose, it is possible for the SF activity of galaxies to drop for a sufficiently long time and for galaxy color to become redder relative to those in lower density regions. Enhancement of SF activity by late-type neighbor galaxies occurs at smaller neighbor separations as the background density increases (see the E-l and L-l cases of the parameter in Fig. 7). This observation can be also understood by the background density-dependent halo gas properties or mass transfer efficiency.
An interesting question regarding galaxy color is which is more fundamental physical property of galaxies between morphology and color. One way to address this question is whether or not galaxy morphology shows any dependence on environment beyond its correlation to color (Ball, Loveday & Brunner 2008; van den Bergh 2007). To answer this question we selected two local density subsets containing galaxies with and located at the background densities (low-density subset) or (high-density subset). Since we fixed both luminosity and color, the stellar mass of galaxies is effectively fixed (Yang et al. 2007). The fraction of early types in the low-density subset is found to be , but that in the high-density subset is . Therefore, the morphology-density relation becomes much weaker when we severely limit both luminosity and color. But there is still some residual dependence of galaxy morphology on the background density. This demonstrates morphology contains independent information on the environmental dependence of galaxies that color does not have.
According to the tidal interaction theory the energy deposit in a galaxy is inversely proportional to the square of the velocity difference between the interacting pairs (Binney & Tremaine 1987). Several previous works have reported a detection of such inverse correlation between the strength of interaction effects and the velocity difference between pairs (Barton et al. 2000; Lambas et al. 2003; Nikolic et al. 2004; Alonso et al. 2006; Woods et al. 2006). We also find results consistent with the tidal picture from our accurate morphology subsamples as shown in Figure 8; the L-l galaxies, having smaller velocity difference than the L-e galaxies (see Fig. 2), show more variation in and with the neighbor separation than the L-e galaxies.
To address this issue directly we divided the sample of the L-l galaxies into three subsets according to the velocity difference with neighbors , and measured the equivalent width of the line as a measure of the SF activity, and the central velocity dispersion as a measure of galaxy structure, as a function of the neighbor separation for each subset. Figure 10 shows the median relations and 68% ranges for these parameters. The solid line is for the subset with km s-1, the dashed line for 70 km s km s-1, and the dotted line for 120 km s km s-1. Due to the small size of each subset the errors are large, but one can still clearly see the relation is more sensitive to the neighbor separation for pairs with smaller velocity difference.
Our result can be compared with those of Lambas et al. (2003) and Alonso et al. (2006) who reported that the onset of interaction-induced SF is seen for km s-1. Nikolic et al. (2004) reported the onset even when km s-1. We find no significant enhancement for pairs with km s-1, only a small enhancement for those with km s-1, and a significant enhancement for km s-1. Figure 2 implies that the average morphology of galaxies with small is more likely to be late type and the fraction of early types will increase as increases until it reaches the field fraction. So the average SF activity can appear to be higher for pairs with smaller not because of the interaction effects but because of higher fraction of late-type galaxies. Most of the previous works did not carefully distinguish among different morphological types of galaxies in pairs. Therefore, it is likely that the results of the previous works are contaminated by the average morphology variation with in addition to the genuine effects of interaction.
The dependence on is less strong for , but still shows up at the smallest separation bin. However, it is not clear whether or not the increase of is entirely due to the matter perturbation within galaxies or due to the additional contribution by the mass flow from the neighbor.
To check if our findings are robust against our choice of neighbor selection parameters, we redid our analyses using a sample of galaxies that are constrained to have neighbors brighter than themselves (i.e. the limiting magnitude difference instead of 0.5). It was found that our findings remain true for these galaxy pairs.

5. Conclusions
We have inspected the dependence of eight physical parameters of galaxies on the small-scale (the nearest neighbor distance, the nearest neighbor’s morphology) and the large-scale (background density smoothed over 20 nearest galaxies with ) environments. We have also studied the kinematic properties of the galaxies in pairs. We found the impact of interaction on galaxy properties are detectable at least out to the pair separation corresponding to the virial radius of (the neighbor) galaxies in our sample, which is mostly between 200 and 400 kpc. It was crucial to divide galaxy interactions into four cases depending on morphology of target and neighbor galaxies in order to detect these long-range interaction effects.
Our major results are as follows.
1. There are two characteristic pair-separation scales where the breaks in the dependence of galaxy properties on are observed. The first scale is the virial radius of the nearest neighbor galaxy . All parameters studied, except for , start to deviate from those of extremely isolated galaxies at in the case of late-type galaxies, in particular. The second scale is the merger scale which is about . This corresponds to kpc for the galaxies in our sample.
2. The SF activity of galaxies is enhanced when the nearest neighbor is a late type, but reduced when the neighbor is an early type. These effects occur within the virial radius of the neighbor galaxy. These are strong evidence for hydrodynamic interactions within the virial radius of the galaxy plus dark halo system during encounters.
3. The dependence of galaxy properties on is strong only for luminosity (Fig. 5) and morphology (Fig. 3). All other parameters show weak or negligible dependence on once luminosity and morphology are fixed. We have inspected the small subtle dependence on whenever detectable. For example, the color of late-type galaxies has a weak residual dependence on at fixed . We suggest that galaxies in higher density environment maintain hotter and denser halo gas due to some internal heating mechanisms and external confining material, which can be the reason for the large-scale density dependence of morphology and SF activity parameters.
4. At fixed large-scale background density, galaxies with larger pair separations have higher luminosity. Such dependence exists mainly at the nearest neighbor distance larger than the virial radius of the neighbor. This is interpreted as evidence for the on-going process of luminosity transformation through mergers.
In a forthcoming paper (Park & Hwang 2008) we will examine the dependence of the SDSS galaxies associated with the Abell clusters on the nearest neighbor separation and the clustercentric radius. The latter is the large-scale environmental parameter replacing here. This work will extend the present work to the extreme situation where the large-scale background density itself exceeds the virialized density. We are also studying the effects of the nearest neighbor on galaxy properties using higher redshift samples like the GOODS and DEEP2 samples (Hwang & Park 2008) to understand galaxy evolution due to galaxy-galaxy interactions in the high redshift universe.
References
- (1) Adelman-McCarthy, J. K., et al. 2007, ApJS, 172, 634
- (2) Adami, C., Durret, F., Mazure, A., et al. 2007, A&A, 462, 411
- (3) Allam, S. S. et al. 2004, AJ, 127, 1883
- (4) Allen P. D., Driver S. P., Graham A.W., Cameron E., Liske, J., de Propris R., 2006, MNRAS, 371, 2
- (5) Alonso, M. S., Lambas, D. G., Patricia, T. & Coldwell, G. 2006, MNRAS, 367, 1029
- (6) Anderson, S. F., et al. 2003, AJ, 126, 2209
- (7) Ball, N. M., Loveday, J, & Brunner, R. J. 2008, MNRAS, 383, 907
- (8) Balogh, M. L., Baldry, I. K., Nichol, R., Miller, C., Bower, R., Glazebrook, K. 2004a, ApJ, 615L, 101
- (9) Balogh, M. L., et al. 2004b, MNRAS, 348, 1355
- (10) Bamford, S. P. et al. 2008, MNRAS, submitted (arXiv:0805.2612)
- (11) Barnes, J. E., & Hernquist, L. 1996, ApJ, 471, 115
- (12) Barton, E, J., Geller, M. J., & Kenyon, S. J. 2000, ApJ, 530, 660
- (13) Barton, E, J., Geller, M. J., & Kenyon, S. J. 2003, ApJ, 582, 668
- (14) Barton, E. J., Arnold, J. A., Zentner, A. R., Bullock, J. S., & Wechsler, R. H. 2007, ApJ, 671, 1538
- (15) Bell, E. F., et al. 2006, ApJ, 640, 241
- (16) Bergvall, N., Laurikainen, E., & Aalto, S. 2003, A&A, 405, 31
- (17) Binney, J., & Tremaine, S. 1987, Galactic Dynamics (Princeton: Princeton University Press), 438
- (18) Blanton, M. R., et al., 2001, ApJ, 121, 2358
- (19) Blanton, M. R., Eisenstein, D., Hogg, D. W., Schlegel, D. J., & Brinkmann, J. 2005a, AJ, 629, 143
- (20) Blanton, M. R., et al. 2003, AJ, 125, 2348
- (21) Blanton, M. R., et al. 2005b, ApJ, 129, 2562
- (22) Boselli, A., & Gavazzi, G. 2006, PASP, 118, 517
- (23) Brighenti, F., & Mathews, W. G. 1998, ApJ, 495, 239
- (24) Brown B. A., Bregman J. N., 2000, ApJ, 539, 592
- (25) Brown B. A., Bregman J. N., 1998, ApJ, 495, L752
- (26) Bushouse, H. A., Werner, M. W., & Lamb, S. A. 1988, ApJ, 335, 74
- (27) Choi, Y.-Y., Park, C., & Vogeley, M. S. 2007, ApJ, 658, 884
- (28) Conroy, C., et al. 2007, ApJ, 654, 153
- (29) Cooper, M. C., Newman, J. A.,Weiner, B. J., et al. 2007, MNRAS, 376, 1445
- (30) Cooper, M. C., et al. 2008, MNRAS, 383, 1058
- (31) Croton, D. J., et al. 2005, MNRAS, 356, 1155
- (32) Croton, D. J., & Farrar, G. R., 2008, MNRAS.386, 2285
- (33) Coziol, R., & Plauchu-Frayn, I. 2007, AJ, 133, 2630
- (34) Cucciati, O., Iovino, A., Marinoni, C., et al. 2006, A&A, 458, 39
- (35) de Propris, R, Liske, J., Driver, S. P., Allen, P. D., & Cross, N. J. G. 2005, AJ, 130, 1516
- (36) Di Matteo, Combes, F, Melchior, A.-L., & Semelin, B. 2007, A&A, 468, 61
- (37) D’Onghia, E., Sommer-Larsen, J., Romeo, A. D., et al. 2005, ApJ, 630, L109
- (38) Elbaz, D., et al. 2007, A&A, 468, 33
- (39) Ellis, S. C., & O’Sullivan, E. 2006, MNRAS, 367, 627
- (40) Ellison, S. L., Patton, D. R., Simard, L., & McConnachie, A. W. 2008, AJ, 135, 1877
- (41) Evrard, A. E., et al. 2008, ApJ, 672, 122
- (42) Faber, S. M., & Jackson, R. E. 1976, ApJ, 204, 668
- (43) Geller, M. J., Kenyon, S. J., Barton, E. J., Jarrett, T. H. & Kewley, L. J. 2006, AJ, 132, 2243
- (44) Gomez, P. L., et al. 2003, ApJ, 584, 210
- (45) Goto, T., et al. 2003, MNRAS, 346, 601
- (46) Gott, J. R., & Thuan, T. X. 1976, ApJ, 204, 649
- (47) Graham, A. W. 2005, AJ, 130, 1535
- (48) Helsdon S. F., Ponman T. J., O’Sullivan E., Forbes D. A. 2001, MNRAS, 325, 693
- (49) Henriksen, M., & Cousineau, S. 1999, ApJ, 511, 595
- (50) Hernandez-Toledo, H .M., Avila-Reese, V., Conselice, C. J. & Puerari, I. 2005, AJ, 129, 682
- (51) Hernquist L., 1992, ApJ, 400, 460
- (52) Hernquist L., 1993, ApJ, 409, 548
- (53) Hogg, D. W., et al. 2003, ApJ, 585, L5
- (54) Hwang, H. S., & Park, C. 2008, in preparation
- (55) Jeltema, T. E., Binder, B., & Mulchaey, J. S. 2008, ApJ, 679, 1162
- (56) Jones, L. R., Ponman, T. J., Horton, A., et al. 2003, MNRAS, 343, 627
- (57) Kacprzak, G. G., Churchill, C. W., Steidel, C. C., Murphy, M. T., & Evans, J. L. 2007, ApJ, 662, 909
- (58) Kauffmann, G., White, S. D. M., Heckman, T. M., Menard, B., Brinchmann, J., Charlot, S., Tremonti, C., & Brinkmann, J. 2004, MNRAS, 353, 713
- (59) Kennicutt, R. C., & Keel, W. C. 1984, ApJ, 279, 5
- (60) Kennicutt, R. C., Roettiger, K. A., Keel, W. C., van der Hulst, J. M., & Hummel, E. 1987 AJ, 93, 1011
- (61) Lambas, D. G., Patricia, T., Alonso, M. S., & Coldwell, G. 2003, MNRAS, 346, 1189
- (62) Larson, R. B., & Tinsley, B. M. 1978, ApJ, 219, 46L
- (63) Li, G., Kauffmann, G., Heckman, T. M., Jing, Y. P., & White, S. D. M. 2008, MNRAS, 385, 190
- (64) Maller, A. H., Katz, N., Keres, D., Dave, R, & Weinberg, D. H. 2006, ApJ, 647, 763
- (65) Mathews, W. G., & Brighenti, F. 2003, ARA&A, 41, 191
- (66) Matsushita K., 2001, ApJ, 547, 693
- (67) Mendes de Oliveira, C., Cypriano, E. S., & Sodr Jr., L. 2006, AJ, 131, 158
- (68) Mihos, J. C., & Hernquist, L. 1996, ApJ, 464, 641
- (69) Naab, T., & Burkert, A. 2003, ApJ, 597, 893
- (70) Nikolic, B., Cullen, H., & Alexander, P. 2004, MNRAS, 355, 874
- (71) O’Sullivan, E., Forbes, D. A., & Ponman T, J. 2001, MNRAS, 328, 461
- (72) Park, C., & Choi, Y.-Y. 2005, ApJ, 635, L29
- (73) Park, C., Choi, Y.-Y., Vogeley, M. S., Gott, J. R., & Blanton, M. R. 2007, ApJ, 658, 898
- (74) Park, C., Gott, J. R. & Choi, Y.-Y. 2008, ApJ, 674, 784
- (75) Park, C., & Hwang, H. S. 2008, in preparation
- (76) Patton, D. R., Pritchet, C. J., Yee, H. K. C., Ellingson, E., & Carlberg, R. G. 1997, ApJ, 475, 29
- (77) Patton, D. R. et al. 2005, AJ, 130, 2043
- (78) Perez, M. J., Tissera, P. B., Scannapieco, C., Lambas, D. G., & de Rossi, M. E. 2006, A&A, 459, 361
- (79) Perez, M. J., Tissera, P. B., Lambas, D .G., & Scannapieco, C. 2006, A&A, 449, 23.
- (80) Petrosian, V. 1976, ApJ, 209, L1
- (81) Poggianti, B. M., et al. 2008, ApJ, accepted (arXiv:0805.1145)
- (82) Quintero, A. D., Berlind, A. A., Blanton, M. R., & Hogg, D. W. 2006, ApJ, submitted (arXiv:astro-ph/0611361)
- (83) Robertson, B. et al. 2006, ApJ, 645, 896
- (84) Sanchez, S. F., & Gonzalez-Serrano, J. I. 2003, A&A, 406, 435
- (85) Schlegel, D. J., Finkbeiner, D. P., & Davis, M. 1998, ApJ, 500, 525
- (86) Smith, B. J. et al. 2007, AJ, 133, 791
- (87) Stoughton, C., et al. 2002, AJ, 123, 485
- (88) Tanaka, M., et al. 2004, AJ, 128, 2677
- (89) Tegmark, M., et al. 2004, ApJ, 606,702
- (90) Tissera, P. B., Dominguez-Tenreiro, R., Scannapieco, C., & Saiz, A. 2002, MNRAS, 333, 327
- (91) Toomre, A., & Toomre, J. 1972, ApJ, 178, 623
- (92) Tran, K-v. H., et al. 2005, ApJ, 627, L25
- (93) Tully, R. B., & Fisher, J. R. 1977, A&A, 54, 661
- (94) Ulmer, M. P., Adami, C., Covone, G., et al. 2005, ApJ, 624, 124
- (95) van den Bergh, S. 2007, AJ, 134, 1508
- (96) van der Wel, A., 2008, ApJ, 675, 13
- (97) van Dokkum, P. G., 2005, AJ, 130, 2647
- (98) Voges, W., et al. 1999, A&A, 349, 389
- (99) von Benda-Beckmann, A. M. et al. 2008, MNRAS, 386, 2345
- (100) Weinmann, S. M., van den Bosch, F. C., Yang, X., & Mo, H. J. 2006, MNRAS, 366, 2
- (101) White, R. E., III, & Sarazin, C. L. 1991, ApJ, 367, 476
- (102) Woods, D. F., & Geller, M. J. 2007, AJ, 134, 527
- (103) Woods, D. F., Geller, M. J., & Barton, E. J. 2006, AJ, 132, 197
- (104) Yang, X., Mo, H. J., van den Bosch, F. C., Pasquali, A., Li, C., & Bardeen, M. 2007, ApJ, 671, 153
- (105) Yee, H. K. C., & Ellingson, E. 1995, ApJ, 445, 37
- (106) York, D., et al. 2000, AJ, 120, 1579