The first-mover advantage in scientific publication
Abstract
Mathematical models of the scientific citation process predict a strong “first-mover” effect under which the first papers in a field will, essentially regardless of content, receive citations at a rate enormously higher than papers published later. Moreover papers are expected to retain this advantage in perpetuity—they should receive more citations indefinitely, no matter how many other papers are published after them. We test this conjecture against data from a selection of fields and in several cases find a first-mover effect of a magnitude similar to that predicted by the theory. Were we wearing our cynical hat today, we might say that the scientist who wants to become famous is better off—by a wide margin—writing a modest paper in next year’s hottest field than an outstanding paper in this year’s. On the other hand, there are some papers, albeit only a small fraction, that buck the trend and attract significantly more citations than theory predicts despite having relatively late publication dates. We suggest that papers of this kind, though they often receive comparatively few citations overall, are probably worthy of our attention.
In an influential paper published in 1965, the physicist-turned-historian-of-science Derek de Solla Price presented one of the first quantitative studies—perhaps the first—of patterns of citations between learned papers Price65 . His article, entitled Networks of scientific papers, depicted papers as the nodes of a network of information, linked together by the citations between them. He noted a number of striking features of this network, chief among them the skewed distribution of citation frequency under which most papers received only a small number of citations but there was a “long tail” consisting of a few papers cited very many times. More specifically he showed that the fraction of papers within his sample that were cited exactly times diminished with increasing according to a Pareto distribution or power law with a constant, a result that has since been confirmed in other larger studies Seglen92 ; Redner98 . In the jargon of modern network analysis, the citations between papers form a scale-free network BA99b .
In a follow-up paper published a few years later, Price Price76 proposed a remarkably simple explanation for this observation. He suggested that citation was subject to what he called a cumulative advantage process note1 , whereby papers that had been cited many times in the past were more likely to be cited again, resulting in a compound interest effect under which the best cited papers became ever better cited, leaving their less popular counterparts behind. Price proposed a mathematical model of this process and solved it to show that indeed it gives rise to a power-law distribution of citation frequencies.
Inspired, among other things, by the distribution of links between pages on the world wide web, which also appears to follow a power law, a similar process—now with the new name of preferential attachment—was independently proposed by Barabási and Albert in 1999 BA99b and elaborated upon extensively by a number of authors AB02 ; DM02 ; Newman03d . As a result of this and subsequent work, the mathematics of preferential attachment and the power-law distributions it produces is now quite well understood.
The preferential attachment mechanism is qualitatively plausible in citation networks—one can certainly imagine that papers cited many times in the past are more likely to be read and cited again. There is also good empirical evidence in its favor JNB03 , although deviations from its predictions have been observed in some data sets BMG04 ; LJ05 ; Redner05 , especially those that span large periods of time. Overall, however, the preferential attachment mechanism is widely considered to be a reasonable, if simplistic, explanation for the long tail in citation networks.
What is less widely appreciated, perhaps, is that preferential attachment, if correct, would also imply a variety of other distinctive features in citation networks that could, at least in principle, be observed empirically. In particular, as we discuss here, it should produce a strong first-mover advantage, under which the first papers published on a topic should enjoy far higher rates of citation, in perpetuity, than those that come after them. That preferential attachment should imply some kind of first-mover advantage has been pointed out by Adamic and Huberman AH00a , who looked for such effects in web data but found no evidence that they existed. In scientific citation, by contrast, it is almost axiomatic that the first papers in a field are important and should be highly cited Redner05 , although it’s unclear how large the effect should be. In this paper we calculate the size of the first-mover effect within the preferential attachment model and compare the results with citation data from a number of fields. We find not only that scientific citation shows a substantial first-mover effect, but that the size and duration of the effect often agree closely with the theoretical predictions.
The first-mover advantage
In the model of citation proposed by Price Price76 , it is assumed that on average each paper published cites previous papers, which are chosen in proportion to the number of citations they already have plus a positive constant . The constant is necessary to ensure that papers with no previous citations—which is all papers upon first appearance—can still receive citations. Price himself studied only the case , but the generalization to other cases is trivial. The model also includes the widely studied model of Barabási and Albert BA99b as a special case when .
The model can be solved exactly for the citation distribution in the limit of a large number of papers using a master-equation method introduced by Simon Simon55 ; Price76 ; KR01 . The solution shows that the fraction of papers with exactly citations in the model network is
| (1) |
where
| (2) |
is the Euler beta function, is the standard gamma function, and
| (3) |
For large values of its first argument, the beta function has the asymptotic form , and hence the tail of the citation distribution has a power-law form , just as in the empirical data.
There is much more that can be done with the model, however, than just calculating total numbers of citations. In particular, one can calculate the full distribution of citations a paper should receive as a function of its date of publication.
Suppose papers in all have been published and let be the probability that the paper has exactly citations. Then, as shown for the case by Krapivsky and Redner KR01 and more generally by Dorogovtsev and Mendes DM02 , satisfies the master equation
| (4) |
The only exception to this equation is for the case , where instead we get
| (5) |
Notice the Kronecker delta, which adds a single paper with if , but none otherwise.
In KR01 ; DM02 these equations are solved using a continuous-time method in which the discrete difference equation is approximated by a differential equation. Here we take a slightly different approach that leads to the same conclusions but avoids the approximation. Let us define a “time” variable such that the paper published has . (Technically need have nothing to do with actual time—it measures only the sequence of publications—so the model can be used even if the rate of appearance of publications is not constant over time, a common situation.) At the same time let us also change from to a density function such that is the expected fraction of papers that have been cited times and fall in the interval from to . Substituting for these quantities in Eqs. (4) and (5), taking the limit of large , and introducing the shorthand notation for the limiting distribution , we find that
| (6) |
with the convention that for all , defined as in (3), and boundary conditions .
It is straightforward to verify that these equations have the solution
| (7) |
which is equivalent to the solution given in DM02 , and from this one can calculate the average number of citations a paper receives as a function of its time of publication:
| (8) |
The first thing to notice about this expression is that it becomes arbitrarily large as , meaning that, if the assumptions of the model are correct, papers published early on should expect to receive far more citations than those published later, even after allowing for the fact that later papers have less time to accrue citations. This is the first-mover advantage. In effect, as argued in AH00a , the model predicts not only that there will be a long tail to the citation distribution, but that the tail will be composed principally of the earliest papers published.
The common-sense reasoning behind this observation is that papers published early in a field receive citations essentially regardless of content because they are the only game in town. Authors feel the need to cite something and if there is only a small number of relevant publications then inevitably those publications get cited. This gives the earliest publications a head start that is subsequently amplified by the preferential attachment process and they continue to receive citations indefinitely at a higher rate than later papers because they have more citations to begin with.
There may be some truth to this. It is not uncommon to hear a scientist grumble about a paper that, in their opinion, receives citations only because “everybody cites that paper.” More to the point, citing a paper because it was the first in an area is in most cases entirely appropriate: the first researcher to bring an issue to the attention of the scientific community surely deserves credit for it, regardless of whether the other details of their paper turn out later to be important. On the other hand, it is clear that the detailed contents of a paper usually do play a role in determining the attention it receives AL89 ; Redner05 and thus the preferential attachment model cannot be a complete representation of the citation process. Nonetheless, as we now show, it turns out in some cases to describe the statistical features of real citation networks with surprising accuracy.
Comparison with citation data
Testing the preferential attachment model against citation data poses some challenges. It is clear, for a start, that the model cannot be considered seriously as a representation of the entire citation network, the network of all papers ever published, since the literature is divided into many fields with most citations falling between papers in the same field. In the best of worlds, therefore, the model could only reasonably be considered to describe citations within a single field. Moreover, given that a large part of our interest here focuses on the qualities of the earliest papers published, we need to find data that describe a field from its earliest foundation and such data can be hard to come by.
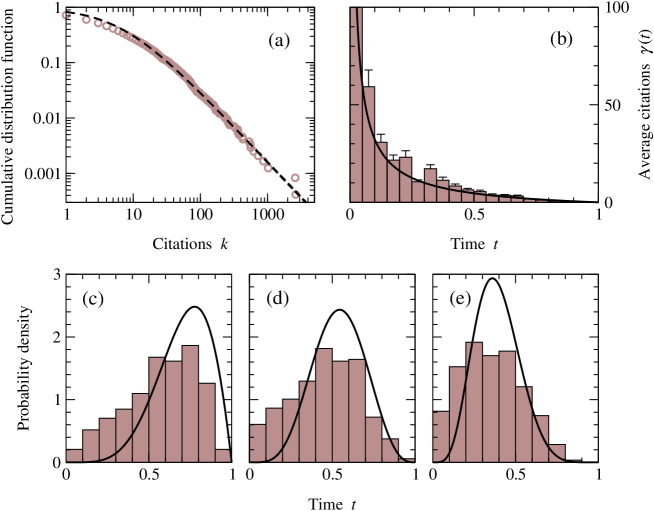
Figure 1 shows one relatively clean example, a citation network of papers on network theory—the topic of this very paper. Within the hard sciences this is a field of relatively recent provenance, attracting an impressive volume of research since the late 1990s but almost none before that. (Its history in the social sciences is much longer, as Price’s work attests, but cross-citation between the areas is rare enough as to be negligible—a lucky feature for our analysis, although an unfortunate one for the progress of science.)
Our citation network for this example consists of five early and well cited papers in the field BA99b ; WS98 ; AB02 ; DM02 ; Newman03d along with all papers that cite them, but excluding review articles, which tend to have distinctively different citation patterns, and restricted to papers in physics and related areas. The resulting data set contains 2407 papers in all spanning a ten-year period from June 1998 to June 2008. Figure 1a shows the complete distribution of numbers of citations to these papers, along with the best fit to the form (1). As we can see, this two-parameter fit is remarkably good, and allows us to extract accurate values for and from the data. In Fig. 1b, we show the average number of citations received by papers as a function of time, where time is measured, as in the model, in terms not of publication date but of publication order. We also show the predicted value of the same quantity from Eq. (8), and this is now, effectively, a zero-parameter fit, since the two parameters appearing in the formula have already been fixed. Nonetheless, the agreement between data and theory is again good, and in particular the data show a clear first-mover effect of a magnitude and duration very similar to that predicted by the model.
As we mentioned above, the effect is sizable: the first 10% of papers in this example received an average of 101 citations each, while the second 10%—published only a little later—received just 26. The most recent 10% of papers in the data set received a miserable 0.08 citations each, meaning that most of them have never been cited at all.
Highly cited papers
We can take our analysis further. Figure 1c–1e shows a detailed comparison of the actual distribution of citations at different times against the theoretical predictions. Again the fit is quite good, although there are some interesting differences between data and model now visible. In particular, there are noticeably more papers published at early times in each degree range than predicted by the theory and correspondingly fewer around the peak value, meaning that not all papers in the early period are benefiting from the first-mover advantage; we hope this is a positive sign that citation rates are reflecting on paper content at least to some extent. More interestingly perhaps, there are also a scattering of papers that are cited substantially more than expected. These are few enough in number that they have little visible effect on the figure, but the number of citations they receive puts them well outside the expected range.
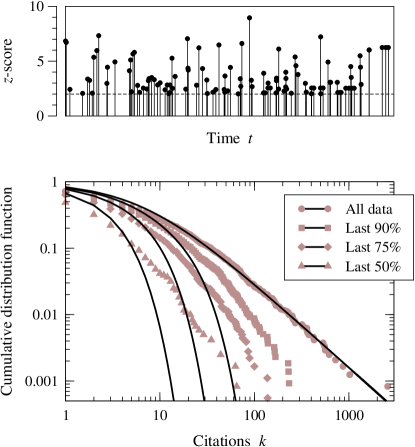
And this leads us to an interesting possibility. It is common to assess the importance of papers according to the number of citations they receive, but the results presented here suggest that a large part of the variation in citation numbers is a result of publication date rather than paper content. If, however, we measure a paper’s citation count relative to the average in its field for the given publication date, then this effect is factored out and—perhaps—the true stars of the citation galaxy will emerge. We have done this for our network theory data set, calculating a -score for each paper that measures the number of standard deviations by which its citation count surpasses the appropriate mean note2 . The “best-cited” papers by this measure turn out to be roughly evenly distributed over the ten-year period covered by the data set, as shown in Fig. 2, a sign that perhaps the technique is indeed factoring out effects of timing. Some early seminal works such as Ref. WS98 , which at 2623 citations is the most cited paper in the data set, score highly ( above the mean for its publication date), but so do some later papers such as Ref. BBPV04 ( above the mean with 233 citations). And Ref. OHLN06 beats out both of these at 7.2 standard deviations above the mean even though its relatively recent 2006 publication date means it has received only 63 citations so far. On the basis of these observations one might tentatively predict that this paper (and others like it) will turn out to be influential.
The appearance of well cited papers relatively late in the development of a field is an encouraging sign that true citation patterns don’t just mindlessly follow the preferential attachment rule. To quantify this phenomenon further, we consider the overall distribution of numbers of citations for papers in the latter part of our citation time series. Suppose we are interested in papers published after some time . Their distribution within the preferential attachment model, which we’ll denote , can be calculated by integrating Eq. (7) thus:
| (9) |
With the substitution , the integral can be performed and the complete result written in the form
| (10) |
where
| (11) |
is the regularized incomplete beta function and . Note that is simply the distribution for the complete network given in Eq. (1), so that the incomplete beta gives us the factor by which the distribution for the later papers differs from the complete distribution.
For large and fixed , as here, has the asymptotic form Gautschi67 and hence
| (12) |
Thus the citation distribution becomes exponentially truncated with a typical scale
| (13) |
which for small values of is well approximated by .
Put in simple terms, when we consider the citation distribution for just the later papers in a field and exclude the earlier ones, we tend to throw out the papers with the highest numbers of citations. Thus one expects to find a distribution in which few papers are highly cited. When we look at the data, however, we find poor quantitative agreement with the formulas above in the tail of the distribution. The lower panel in Fig. 2 shows the appropriate plot for our network science example. As the figure shows, the tail of the distribution is diminished when we exclude the earliest papers in the data set, but by not as much as the theory predicts. Overall the tail still appears relatively long. It no longer follows the power-law form, but neither is it well described by the predicted exponential.
Within the preferential attachment model it is almost impossible for later papers in a network to get very many citations because there are only a fixed number of citations to go around and most of them are going to the earliest papers. In Fig. 2, on the other hand, it is clear that a substantial number of later papers are receiving large numbers of citations, a hopeful sign that we as scientists do pay at least some attention to good papers that come along later.
Other examples
These analyses are for just one example field, which provides a particularly clear instance of the first-mover effect. The same methods can be applied to other fields, though the results aren’t often as clean. There are a variety of issues that can complicate the analysis. Some are straightforward data problems: it may be difficult to restrict the set of papers analyzed to those that truly fall in just one area, or to be sure that you have captured all the relevant papers, or both. It may even be unclear when a field started at all (when did research on apple trees begin?), or it may have started so long ago that modern concepts of citation don’t apply.
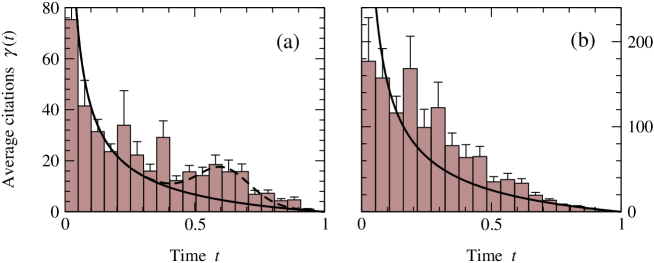
However, there are also some cases where differences between observation and theory reveal behaviors of real scientific interest. Two examples are shown in Fig. 3. Panel (a) shows the curve of average citation number for the subfield of particle physics concerned with theories of “strange matter” Witten84 ; FJ84 —a topic that has at the time of writing been receiving some attention with the start-up of the Large Hadron Collider. As the figure shows, there is again good general agreement between observed citation counts and the model, and a strong first-mover advantage similar in size to that predicted by the theory, an interesting finding given that this data set spans an interval of 24 years—far longer than that of Fig. 1. However, there is now also an additional “bump” in citation intensity in the latter half of the time period, corresponding to papers published around 1999–2001 and denoted roughly by the dotted line in the figure. This bump, we assume, is a result of true scientific developments in the field, though we leave the experts in the area to suggest what developments those might be.
More substantial deviations from the theory arise when a branch of the literature assumed to represent a new field turns out in fact to be merely a subset of a larger, already-established field. In this case, we would not expect to see a first-mover effect at all. The first papers published in such a branch will be cited at a level typical of their position in the middle of the larger subject area, and not as they would if they were the only game in town.
We give an example of behavior of this type in Fig. 3b, which shows citations to papers about adult neural stem cells. The discovery that neural stem cells exist not only during development but in adult animals as well RW92 ; RTW92 has resulted in a healthy quantity of subsequent research, but it has not, at least according to our analysis, created a “new field.” As Fig. 3b shows, the fit between the observed citation record and the theory is poor in this case and in particular the data show no discernible first-mover effect. Earlier papers in the data set do have more citations, but citation numbers appear to increase only linearly with paper age, suggesting that on average papers are being cited at roughly the same rate regardless of when they were published. A qualitative inspection of the data set indicates that in fact the adult neural stem cell literature forms just a part of a larger community of citation on neural stem cells in general and hence we indeed expect no first-mover effect in this case.
Analyses of the type described here could thus, in principle, provide an independent test of claims, frequent in some areas, that a particular publication or discovery has created a new field of science. We repeat our caution, however, that the data are not always as clean as we would like and it is not always possible to make a firm statement one way or the other.
Conclusions
In conclusion, the strong first-mover advantage predicted by theories of the scientific citation process seems to be quantitatively substantiated by empirical citation data, at least in some areas. The cynical observer would, it appears, have some justification in concluding that if you want to be well cited you are better off writing the first paper in such an area than writing the best. Other areas, by contrast, show no first-mover effect, which may be an indication that those areas do not constitute self-contained research fields as assumed by the theory. And even in cases where the first-mover effect is strong, a small number of later papers do seem buck the trend and attract significant attention in defiance of predictions. We tentatively suggest that the reader looking for true breakthroughs could do worse than keep an eye out for papers such as these.
Acknowledgements.
The author thanks Carrie Ferrario, Loet Leydesdorff, Robert Messing, Aaron Pierce, and Sidney Redner for useful suggestions. This work was funded in part by the National Science Foundation under grant DMS–0405348 and by the James S. McDonnell Foundation.References
- (1) D. J. de S. Price, Networks of scientific papers. Science 149, 510–515 (1965).
- (2) P. O. Seglen, The skewness of science. J. Amer. Soc. Inform. Sci. 43, 628–638 (1992).
- (3) S. Redner, How popular is your paper? An empirical study of the citation distribution. Eur. Phys. J. B 4, 131–134 (1998).
- (4) A.-L. Barabási and R. Albert, Emergence of scaling in random networks. Science 286, 509–512 (1999).
- (5) D. J. de S. Price, A general theory of bibliometric and other cumulative advantage processes. J. Amer. Soc. Inform. Sci. 27, 292–306 (1976).
- (6) A related phenomenon, the “Matthew effect,” was previously discussed by Merton Merton68 , who observed that the simultaneous discovery of an important result by two different scientists is more likely to be credited to the more famous of the two, so that fame begets more fame.
- (7) R. K. Merton, The Matthew effect in science. Science 159, 56–63 (1968).
- (8) R. Albert and A.-L. Barabási, Statistical mechanics of complex networks. Rev. Mod. Phys. 74, 47–97 (2002).
- (9) S. N. Dorogovtsev and J. F. F. Mendes, Evolution of networks. Advances in Physics 51, 1079–1187 (2002).
- (10) M. E. J. Newman, The structure and function of complex networks. SIAM Review 45, 167–256 (2003).
- (11) H. Jeong, Z. Néda, and A.-L. Barabási, Measuring preferential attachment in evolving networks. Europhys. Lett. 61, 567–572 (2003).
- (12) K. Börner, J. T. Maru, and R. L. Goldstone, The simultaneous evolution of author and paper networks. Proc. Natl. Acad. Sci. USA 101, 5266–5273 (2004).
- (13) S. Lehmann and A. D. Jackson, Life, death, and preferential attachment. Europhys. Lett. 69, 298–303 (2005).
- (14) S. Redner, Citation statistics from 110 years of Physical Review. Physics Today 58, 49–54 (2005).
- (15) L. A. Adamic and B. A. Huberman, Power-law distribution of the world wide web. Science 287, 2115 (2000).
- (16) H. A. Simon, On a class of skew distribution functions. Biometrika 42, 425–440 (1955).
- (17) P. L. Krapivsky and S. Redner, Organization of growing random networks. Phys. Rev. E 63, 066123 (2001).
- (18) O. Amsterdamska and L. Leydesdorff, Citations: Indicators of significance? Scientometrics 15, 449–471 (1989).
- (19) D. J. Watts and S. H. Strogatz, Collective dynamics of ‘small-world’ networks. Nature 393, 440–442 (1998).
- (20) Mean and standard deviation are calculated as averages over papers in a Gaussian-weighted window of width 100 papers around the paper of interest.
- (21) A. Barrat, M. Barthelemy, R. Pastor-Satorras, and A. Vespignani, The architecture of complex weighted networks. Proc. Natl. Acad. Sci. USA 101, 3747–3752 (2004).
- (22) H. Ohtsuki, C. Hauert, E. Lieberman, and M. A. Nowak, A simple rule for the evolution of cooperation on graphs and networks. Nature 441, 502–505 (2006).
- (23) E. Witten, Cosmic separation of phases. Phys. Rev. D 30, 272–285 (1984).
- (24) E. Farhi and R. L. Jaffe, Strange matter. Phys. Rev. D 30, 2379–2390 (1984).
- (25) B. A. Reynolds and S. Weiss, Generation of neurons and astrocytes from isolated cells of the adult mammalian central-nervous-system. Science 255, 1707–1710 (1992).
- (26) B. A. Reynolds, W. Tetzlaff, and S. Weiss, A multipotent EGF-responsive striatal embryonic progenitor-cell produces neurons and astrocytes. J. Neurosci. 12, 4565–4574 (1992).
- (27) W. Gautschi, Computational aspects of three-term recurrence relations. SIAM Review 8, 24–82 (1967).