DYNAMICS OF FERROELECTRIC NANO CLUSTER IN BaTiO3
OBSERVED AS A REAL TIME CORRELATION BETWEEN TWO
SOFT X-RAY LASER PULSES
Abstract
We carry out a theoretical investigation to clarify the dynamic property of photo-created nano-sized ferroelectric cluster observed in the paraelectric BaTiO3 as a real time correlation of speckle pattern between two soft X-ray laser pulses, at just above the paraelectric-ferroelectric phase transition temperature. Based on a model with coupled soft X-ray photon and ferroelectric phonon mode, we study the time dependence of scattering probability by using a perturbative expansion approach. The cluster-associated phonon softening as well as central peak effects are well reproduced in the phonon spectral function via quantum Monte Carlo simulation. Besides, it is found that the time dependence of speckle correlation is determined by the relaxation dynamics of ferroelectric clusters. Near the transition point, cluster excitation is stable, leading to a long relaxation time. While, at high temperature, cluster structure is subject to the thermal fluctuation, ending up with a short relaxation time.
keywords:
Nonlinear optics; soft X-ray laser; nano cluster.1 Introduction
Ferroelectricity refers to the ability of developing a spontaneous polarization (electric dipole moment) on decreasing temperature below Curie point (). As a prototype of the ferroelectric perovskite compounds, barium titanate (BaTiO3) undergoes a transition from paraelectric cubic to ferroelectric tetragonal phase at =395 K. In addition to its extensive application in the technology such as non-volatile memory devices, capacitor applications and piezoelectric transducers due to its high dielectric constant and switchable spontaneous polarization,[1] there is also an enduring interest in understanding the mechanism of paraelectric-ferroelectric phase transition in it. Although it is generally considered that the transition might be a classic displacive soft-mode type driven by the anharmonic lattice dynamics,[2, 3] recent studies have suggested an existence of order-disorder instability competing with the displacive transition[4, 5], making this issue still controversial to date.
Direct observation on creation and evolution of ferroelectric cluster around is of crucial importance for clarifying the nature of phase transition. However, conventional techniques, like neutron scattering,[6] polarizing optical microscopy[7] and scanning probe microscopy,[8] can hardly detect the ultrafast transient status of dipole clusters. In contrast, diffraction speckle patterns of BaTiO3 crystal measured by the soft X-ray laser has turned out to be an efficient way to elucidate the dynamics of domain structure.9-11
Very recently, Namikawa[12] study the nano-sized polarization clusters in BaTiO3 at just above by the plasma-based X-ray laser speckle measurement. In this experiment, two consecutive coherent X-ray laser pulses of 160 Å with an adjustable time difference are generated by the Michelson type beam splitter. After the photo excitation by the first pulse, ferroelectric clusters of nano scale are created in the paraelectric BaTiO3 and tends to be smeared out gradually due to the thermal fluctuation. This relaxation of cluster structure thus can be recorded in the speckle patterns of the second pulse as a function of its delay time from the first pulse, which is known as the speckle intensity correlation function. It has been found that near the , this correlation follows an exponential decay process, i.e., the intensity of speckle pattern declines as the delay time increases. Moreover, the decay rate also decreases upon approaching , indicating a critical slowing down of the dipole relaxation time. Hence, by measuring the correlation between two soft X-ray laser pulses, the real time relaxation dynamics of polarization clusters in BaTiO3 is clearly represented.
In this work, we examine the above-mentioned novel behaviors of ferroelectric cluster observed by Namikawa from a theoretical point of view, aiming to provide a basis for understanding the critical nature of BaTiO3. Our calculation confirms that the relaxation of photo-created nano clusters plays an essential role in determining the delay time dependence of speckle correlation function. The remaining of present paper is organized as follows. In Sec. 2, the model Hamiltonian and theoretical treatment are put forward. In Sec. 3, our numerical results are discussed in comparison with the experimental discoveries. In Sec. 4, a summary with conclusion is presented finally.
2 Theoretical model and method
In order to describe the optical response of BaTiO3 due to X-ray scattering, we design a theoretical model to incorporate the radiation field and ferroelectric dipole correlation as well as a weak interplay between them. As mentioned above, the phase transition in BaTiO3 is likely to be an admixture of displacive and order-disorder types. For this sake, we adopt a Krumhansl-Schrieffer type phonon mode[13] to characterize the ferroelectric anharmonicity in BaTiO3, for this model is suitable for describing the crossover between displacive and order-disorder phase transitions.[14] In this scenario, our model Hamiltonian reads ( and throughout this paper):
| (1) |
where () is the creation (annihilation) operator of a photon with a wave vector and an energy . is the coordinate operator for ionic displacement along the easy axis of BaTiO3 at the site with a dipole oscillatory frequency . () is its Fourier component for wave vector . Without losing generalitivity, here we use a simple cubic lattice, and the total number of lattice site is . is the extended Krumhansl-Schrieffer model for phonon, where a sixth order term of is introduced to produce a triple-well potential, because the phase transition of BaTiO3 is first order. Thus, the lattice dynamic properties are determined by the frequency , temperature , and dimensionless parameters , , . corresponds to a Raman type bi-linear coupling between the ferroelectric phonon mode and photons as the phonon mode has an even parity in the present case, and is the coupling strength.
Since there are two photons involved in the scattering with crystal, the photon-phonon scattering probability can be written as,
| (2) | |||||
where,
| (3) |
means the expectation, () is the inverse temperature, and the time dependent operator is defined in the Heisenberg representation,
| (4) |
Here, denotes the time difference between two incident X-ray laser photons, and is the wave vector of them. After a small time interval , these photons are scattered out, respectively. and are the wave vectors of the first and second outgoing photon.
Regarding as a perturbation, we separate Hamiltonian of Eq. (2.1) as,
| (5) |
where
| (6) |
is treated as the unperturbed Hamiltonian. By expanding the time evolution operator in Eq. (2.4) with respect to ,
| (7) |
we find that the lowest order terms which directly depend on are of fourth order,
| (8) | |||||
where the operators with carets are defined in the interaction representation,
| (9) |
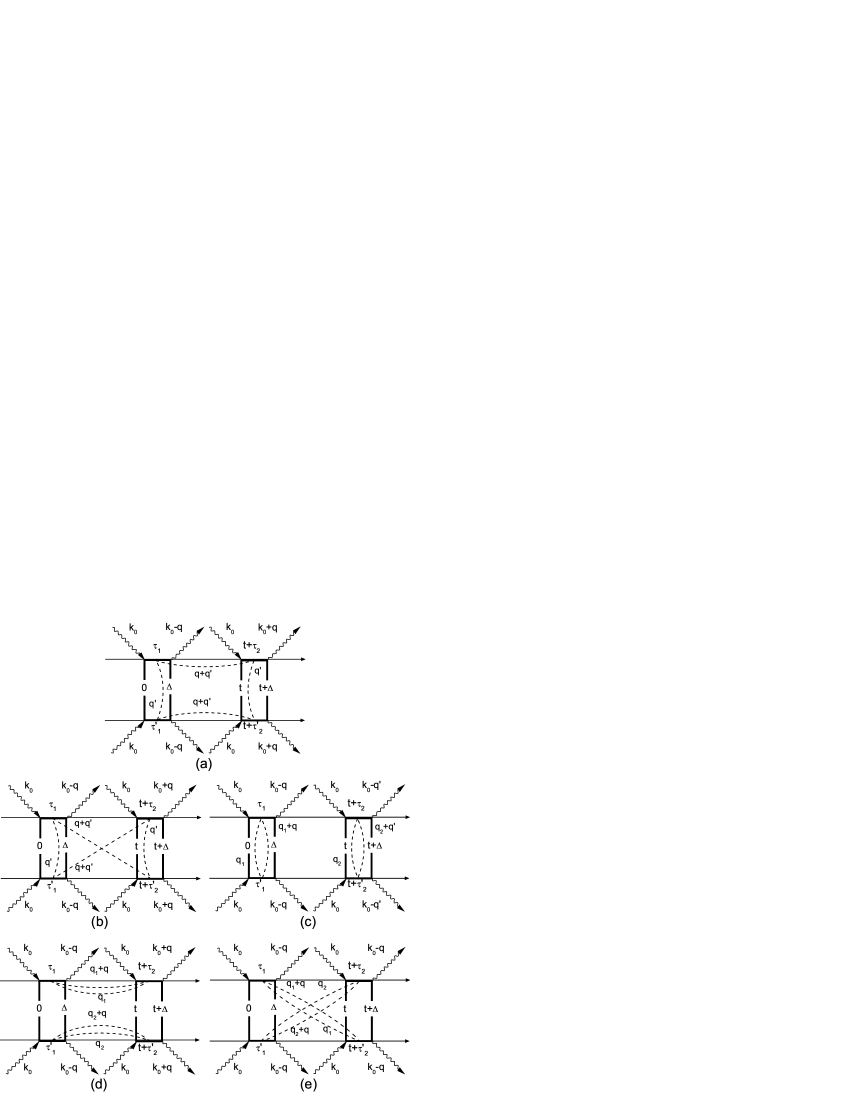
In Fig. 1, we present a diagrammatic analysis for the phonon-coupled scattering process corresponding to Eq. (2.8). In each diagram, the photons (phonons) are depicted by the wavy (dashed) lines, and the upper (lower) horizontal time lines stand for the bra (ket) vectors.[15] Diagram (a) illustrates the changes of photon energy and wave number due to phonon emission and absorption, which corresponds to the well-known Stokes and anti-Stokes Raman scattering. Whereas, diagrams (b)-(e) represent the exchange, side band, rapid dumping and rapid exchange effects, respectively.
Obviously, diagram (c) bears no -dependence, while diagrams (d) and (e) only contribute a substantial reduction to the time correlation between two laser pulses because of the duality of phonon interchange. Accordingly, the -dependence is mainly determined by the diagrams (a) and (b). Allowing for this, the probability of interest can be written in the form as,
| (10) | |||||
Here, we note that the photon and phonon parts have been decoupled, and it can been easily seen that the origin of the -dependence is nothing but the phonon (dipole) correlation.
In the case of forward X-ray scattering, we have , thus the normalized probability can be further simplified as,
| (11) |
where
| (12) |
is the real time correlation function, or real time Green’s function of phonon, and is the step function. The Fourier component of this Green’s function,
| (13) |
is related to the phonon spectral function [] through,[16]
| (14) |
The phonon spectral function describes the response of lattice to the external perturbation, yielding profound information about dynamic properties of the crystal under investigation. Once we get the spectral function, the scattering probability and correlation function can be readily evaluated.
3 Numerical result and discussion
In the numerical calculation, we set phonon frequency =20 meV, and make the parameters =0.076, =0.00495, =0.0967. As indicated in Eq. (2.10), the -dependence of probability is a result of phonon correlation. To reveal its relation with ferroelectric cluster dynamics, we start our discussion with an inspection on the property of phonon spectral function at the temperature regime . To this end, we first calculate the imaginary time Matsubara Green’s function of phonon[16] on a 121212 cubic lattice with a periodic boundary condition. This is done by a path integral Monte Carlo method.[17] After obtaining the Matsubara function, we can derive phonon spectral function by the analytic continuation.[16, 17]

In Fig. 2, we plot the phonon spectral function in the paraelectric phase at different temperatures: (a) =, (b) =1.048, (c) =1.143 and (d) =1.429. In each panel, the spectra are arranged with wave vectors along the XMR direction of Brillouin zone (see in the inset), and here refers to energy. Since the spectra are symmetric with respect to the origin =0, in this graph we only show the positive part of them. When the temperature decreases toward , as already well-known for the displacive type phase transition, the energy of phonon peak is gradually softened. In addition, a so-called central peak, corresponding to the low energy excitation of ferroelectric cluster, appears at the point. On decreasing temperature, its intensity is dramatically enhanced, indicating that a stable dipole correlation of long-wave-length is built up. As mentioned above, the phonon spectral function can be understood as the optical response of dipole to the external perturbation. Therefore the collective excitation represented by the sharp resonant peak in spectra is nothing but the photon-created ferroelectric cluster.

The appearance of sharp peak near point signifies that after excitation by soft X-ray, the photon-created ferroelectric clusters can be well preserved for a long relaxation time. Thus, they are likely to be observed by subsequent detective photons, resulting in a high intensity of speckle correlation. Keeping this in mind, we move on to the results of scattering probability. In Fig. 3, we show the normalized probability as a function of time at temperatures =1.024 and =1.048. From this figure, we see in both cases, the probability declines exponentially with time, demonstrating that the photon-created clusters quickly disappear after the excitation and the system relaxes back to the paraelectric state. Meanwhile, at temperature closer to , more gentle decay rate is observed, indicative of a critical slowing down of the relaxation time. This is because with the decrease of temperature, the intensity of local polarization is enhanced, and a long range correlation between dipole moments is to be established as well, making the relaxation of photon-created clusters slower and slower.
4 Summary
In conclusion, based on a coupled photon-phonon model, we conduct a theoretical survey on the relaxation dynamics of nano-sized ferroelectric cluster in the paraelectric phase of BaTiO3, which is experimentally observed as a real time correlation of speckle pattern between two soft X-ray laser pulses. The density matrix is calculated by a perturbative expansion up to the fourth order terms, so as to characterize the time dependence of scattering probability. We show that this time dependence is determined by the relaxation dynamics of photo-created ferroelectric cluster, which is manifested as a central peak in the phonon spectral function. Near the , cluster excitation is stable with a long relaxation time. While, at high temperature, it is suppressed by the thermal fluctuation, resulting in a short relaxation time. These features are in good agreement with Namikawa’s experimental result.
Acknowledgments
This work is supported by the Next Generation Supercomputer Project, Nanoscience Program, MEXT, Japan.
References
- [1] D. L. Polla and L. F. Francis, Processing and characterization of piezoelectric materials and integration into microelectromechanical systems, Annu. Rev. Mater. Sci. 28 (1998) 563-597.
- [2] J. Harada, J. D. Axe, and G. Shirane, Neutron-scattering study of soft modes in cubic BaTiO3, Phys. Rev. B 4 (1971) 155-162.
- [3] R. Migoni, D. Bauer, and H. Bilz, Origin of Raman scattering and ferroelectricity in oxidic perovskites, Phys. Rev. Lett. 37 (1976) 1155-1158.
- [4] B. Zalar, V. V. Laguta, and R. Blinc NMR evidence for the coexistence of order-disorder and displacive components in barium titanate, Phys. Rev. Lett. 90 (2003) 037601/1-4.
- [5] G. Völkel and K. A. Müller, Order-disorder phenomena in the low-temperature phase of BaTiO3, Phys. Rev. B 76 (2007) 094105/1-8.
- [6] Y. Yamada, G. Shirane, and A. Linz, Study of critical fluctuations in BaTiO3 by neutron scattering, Phys. Rev. 177 (1969) 848-857.
- [7] W. L. Mulvihill, K. Uchino, Z. Li and W. Cao, In-situ observation of the domain configuration during the phase transitions in barium titanate, Phil. Mag. B 74 (1996) 25-36.
- [8] G. K. H. Pang and K. Z. Baba-Kishi, Characterization of butterfly single crystals of BaTiO3 by atomic force, optical and scanning electron microscopy techniques, J. Phys. D 31 (1998) 2846-2853.
- [9] J. W. Goodman, Speckle Phenomena in Optics: Theory and Applications (Roberts and Company, 2007).
- [10] R. Z. Tai, K. Namikawa, M. Kishimoto, M. Tanaka, K. Sukegawa, N. Hasegawa, T. Kawachi, M. Kado, P. Lu, K. Nagashima, H. Daido, H. Maruyama, A. Sawada, M. Ando, and Y. Kato, Picosecond snapshot of the speckles from ferroelectric BaTiO3 by means of X-ray lasers, Phys. Rev. Lett. 89 (2002) 257602/1-4.
- [11] R. Z. Tai, K. Namikawa, A. Sawada, M. Kishimoto, M. Tanaka, P. Lu, K. Nagashima, H. Maruyama, and M. Ando, Picosecond view of microscopic-scale polarization clusters in paraelectric BaTiO3, Phys. Rev. Lett. 93 (2004) 087601/1-4.
- [12] K. Namikawa, unpublished.
- [13] J. A. Krumhansl and J. R. Schrieffer, Dynamics and statistical mechanics of a one-dimensional model Hamiltonian for structural phase transitions, Phys. Rev. B 11 (1975) 3535-3545.
- [14] A. N. Rubtsov and T. Janssen, Quantum phase transitions in the discrete model: The crossover between two types of transition, Phys. Rev. B 63 (2001) 172101/1-4.
- [15] K. Nasu, Resonance enhancement of inelastic X-ray scatterings induced by strong visible lights, J. Phys. Soc. Jpn. 63 (1994) 2416-2427.
- [16] A. Fetter and J. Walecka, Quantum Theory of Many-Particle Systems (MacGrow Hill, New York, 1971).
- [17] K. Ji, H. Zheng, and K. Nasu, Path-integral theory for evolution of momentum-specified photoemission spectra from broad Gaussian to two-headed Lorentzian due to electron-phonon coupling, Phys. Rev. B 70 (2004) 085110/1-9.