Enhanced p-Mode Absorption seen near the Sunspot Umbral-Penumbral Boundary
Abstract
We investigate p-mode absorption in a sunspot using SOHO/MDI high-resolution Doppler images. The Doppler power computed from a three and a half hour data set is used for studying the absorption in a sunspot. The result shows an enhancement in absorption near the umbral-penumbral boundary of the sunspot. We attempt to relate the observed absorption with the magnetic field structure of the sunspot. The transverse component of the potential field is computed using the observed SOHO/MDI line-of-sight magnetograms. A comparison of the power map and the computed potential field shows enhanced absorption near the umbral-penumbral boundary where the computed transverse field strength is higher.
keywords:
Solar oscillation – p-mode absorption – sunspot1 Introduction
The interaction of solar oscillations with magnetic field has been reported by many authors. Two of the important findings are the reduced p-mode power in regions of strong magnetic field and the enhancement of power in higher frequencies surrounding the regions of strong fields (Woods and Cram, 1981; Tarbell et al., 1988; Brown et al., 1992). The magnetic field reduces p-mode power in active regions in the 3 mHz band while enhances power of these modes in the 5 mHz band (Hindman and Brown, 1998; Venkatakrishnan, Kumar, and Tripathy, 2002). The mechanisms of p-mode absorption were reviewed by Spruit (1996) and he suggested a promising mechanism for reduced power as the conversion of p mode into a downward propagating slow mode along the magnetic flux tubes (Spruit and Bogdan, 1992; Cally and Bogdan, 1993; Cally, Bogdan, and Zweibel, 1994). The waves in the flux tube, once excited by the sound wave, can carry energy out of the p modes through the wave guide into the convection zone, thereby producing a reduction in observed power. Simulations by Cally (2000) show that the enhanced absorption takes place primarily in the more inclined magnetic field regions towards the edge of the spot. A comparison of the spatial distribution of Doppler power and the magnetic-field configuration in a sunspot could reveal the variation of Doppler power with magnetic-field strength and the field inclination. In this paper, we study p-mode absorption in magnetic field concentrations and compare that with the longitudinal and the computed transverse field configuration in a sunspot.
2 Data Sets
For this analysis, we have used high-resolution Dopplergrams with one-minute cadence obtained with the Solar and Heliospheric Observatory / Michelson Doppler Imager (SOHO/MDI) instrument (Scherrer et al., 1995). Complemented with these data, we have also used few line-of-sight magnetograms and intensity images from SOHO/MDI. The sunspot analyzed is a member of the active region NOAA 8395 and the observations were made on 1 December 1998 between 04:00 UT and 07:51 UT. The sunspot was near disk center (). Images were registered and re-mapped onto heliographic coordinates. Registration is carried out first in synodic rate and then by cross-correlating successive images with a reference image. The reference image is updated after every five minute to avoid errors in registration resulting from the evolution of the active region. The resulting images consist of pixels corresponding to arc-min at the solar disk center. We selected a small sub-region of including one of the sunspots in the active region for our analysis.

The duration of 3:51 and the cadence of one minute give a frequency resolution and Nyquist frequency of 72.1 and 8.33 mHz, respectively. Re-mapped SOHO/MDI Dopplergrams and line-of-sight magnetograms were used for comparing the p-mode absorption with magnetic-field strength. An average of two magnetograms, one at the beginning and other towards the end of the observing period are used for the comparison.
3 Data Analysis
We used a method similar to that described by Brown et al. (1992) for the Dopplergram analysis. From the accurately registered Doppler images, a time series is constructed. The power spectra is computed for every pixel in the image. Figure 1 shows the amplitude of the average power spectrum for the above mentioned sub-region including the sunspot. The average power within the two frequency bands represented by the hatched areas are used for obtaining the results shown in the subsequent figures. The range of values included in the low (band 1) and high (band 2) frequency bands are 3 – 3.5 mHz and 4.5 – 5 mHz, respectively.
From the line-of-sight magnetograms, the potential-field configuration of the entire active region is computed. All three components of the magnetic field ( and ) are derived assuming the potential-field approximation using the Fourier method (Sakurai, 1989). The mean field has been removed before computing the magnetic-field components and later added. The normal component () of the magnetic-field is needed as the boundary condition for the potential-field extrapolation, whereas only the line-of-sight field is available from the MDI measurements. The measured line-of-sight field and the normal component differ when the sunspot is observed away from the disk center due to the projection effect. In our analysis a first order correction is carried out on the line-of-sight magnetic field for the projection effect taking the heliocentric angle into consideration (i.e. ). Since the observation of the analyzed sunspot were obtained when it was close to the disk center , the above correction is approximately valid for strong normal magnetic-field component. The transverse magnetic-field component is and the magnetic-field inclination is ). Even though the computed potential field assumes the lowest magnetic-energy configuration of the sunspot, for obtaining a rather simplified idea about the magnetic structure the potential field calculation can be used. The computed magnetic-field structure (Figure 2c) of the observed sunspot is similar to the retrieved transverse field configuration of sunspots from the vector magnetic-field measurements (Westendorp Plaza et al., 2001; Keppens and Martinez Pillet, 1996; Mathew et al., 2003).
4 Results
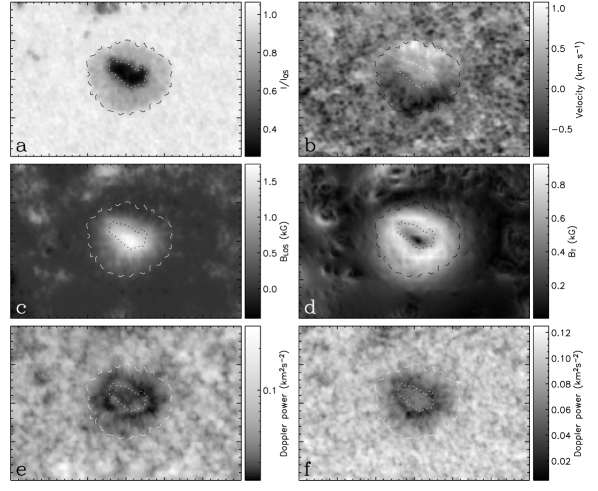
Figure 2 show the continuum image (a), Dopplergram (b), the line-of-sight magnetogram (c), and the computed transverse field (d) for the analyzed sunspot. Figure 2 (e) and (f) show the average Doppler power for the frequency bands 1 and 2 marked in Figure 1. The Doppler power is displayed in logarithmic scale to make the absorption clear in the lower levels. The dotted- and dashed-line contours are plotted for the umbral and penumbral boundaries, respectively. The Doppler power in both lower (band 1) and the upper (band 2) frequency bands (band 1) show an enhanced absorption near the umbral-penumbral boundary; here the computed transverse field also becomes strong. In the upper panel of Figure 3, the continuum image of the analyzed sunspot along with the equal intensity contours are displayed. The inset in the upper panel shows the brightness enhanced image of the sunspot. This gives a closer view of the splitted and irregular structure of the umbra. In the lower panel, variation of different parameters along two radial cuts (marked as a and b in the continuum image) through the sunspot are plotted. The dotted vertical lines in these figures mark the umbral boundary and the plotted Doppler power are for the lower-frequency band. Around the umbral boundary the line-of-sight magnetic filed shows a smooth change, while the computed transverse field strength reaches a maximum value. The Doppler power in the lower frequency band shows a dip around this location in both the radial cuts.
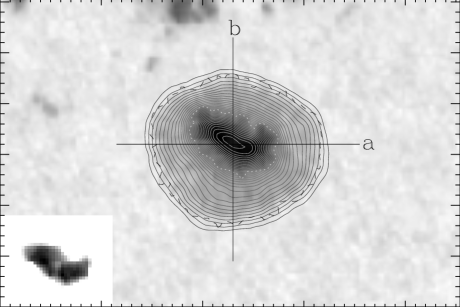

In Figure 4 we plot the values averaged between equal intensity contours for the continuum (a), line-of-sight magnetic field strength (b), the computed transverse magnetic field (c), the computed inclination (d), Doppler power in the lower frequency band (e), and the Doppler power in higher frequency band (f). The contour numbers plotted are from the upper panel in Figure 3, starting from the inner umbra. Here also, a clear reduction in Doppler power near the umbral boundary is observed, where the strength of the computed transverse field is higher.

5 Discussion
It is a well known that the Doppler power is considerably reduced in sunspots compared with the quiet Sun. Braun, Duvall, and LaBonte (1987) reported that sunspots absorb up to half of the incident p-mode power at favored frequencies and horizontal wavenumbers. From the analysis of the acoustic properties of two large sunspots using Fourier-Hankel decomposition of p-mode amplitudes, Braun (1995) showed that there is a peak in Doppler power absorption centered at around 3 mHz and an absence of absorption at 5 mHz frequencies. Lindsey and Braun (2005) reported a “penumbral acoustic anomaly” in which they found a ring of relatively depressed acoustic power in and around the sunspot penumbra. Study of active region oscillations by Muglach, Hofmann, and Staude (2005) also show (in their Figure 5) a reduction in Doppler power in the penumbra.
In our analysis, we present the spatial distribution of the oscillatory power in a sunspot. The total-power maps obtained for this sunspot in two frequency bands (3 – 3.5 mHz and 4.5 – 5 mHz) show a structured ring-like depression in the penumbra. The reduction is visible in both the frequency bands with a difference of a shift in the peak absorption towards the umbral-penumbral boundary in the higher frequency band. We also observe an absorption structure in the umbra in the lower frequency band which is not clearly visible in the higher frequency band. A comparison of the reduction in p-mode power with magnetic structure of the sunspot clearly indicates increased absorption near the locations where the transverse field is higher. The absorption structure in the umbra (also the decrease in Doppler power in umbra seen in the azimuthal average, Figure 4), without correspondence with transverse-field structure could be due to the split structure of the umbra which is clearly seen in the brightness-enhanced image of the sunspot displayed in the upper panel of Figure 3. We suggest that this absorption structure could be due to the increased field inclination resulting from the split structure of the umbra, which is not visible in the MDI line-of-sight magnetogram and thus also not in the computed transverse field.
Theoretical modeling of the influence of sunspot magnetic field on the incident oscillation has been described by several authors (Spruit, 1991; Spruit and Bogdan, 1992; Cally and Bogdan 1993; Cally, 2000; Rosenthal and Julien, 2000). In the presence of strong magnetic field, it is suggested that the fast wave is partially converted into a slow magneto-acoustic wave and is directionally influenced by the magnetic field. Simulations by Cally (2000) showed that the interaction of acoustic wave and magnetic field has a strong dependence on the inclination of the magnetic field and found that the absorption peaks at 30∘ inclination angle (Cally, Crouch, and Braun, 2003). In our analysis we find that the computed inclination angles are around 45∘ and 35∘, where the absorption peaks in the lower (band 1) and higher (band 2) frequency bands, respectively. These values should be considered cautiously since the exact inclination angle can only be derived from full vector magnetic-field measurements corrected for the projection effect. In our case the potential field and thus the field inclination is computed from the measured line-of-sight magnetic field and a simple approach is used for correcting the observed field before computing the potential components, assuming the magnetic field is perpendicular to the photosphere. Here, without having full information on the vector magnetic field, the contribution of the transverse component to the line-of-sight field is unknown. But, it has been shown that the difference between the computed potential field from the observed and the corrected (for the projection effect using full vector magnetic-field measurements) line-of-sight field is not very different from each other when the sunspot is located close to the disk center (Hagyard, 1987). From the analysis of an active region which is positioned within one-third solar radius from the disk center, Hagyard showed that the difference between the computed transverse field from the corrected and observed line-of-sight field is around 200 G and this difference occurs only in localized area of the umbrae of large sunspot. In our case, since the sunspot is close to the disk center, we presume that the simple correction which we employed is sufficient to represent the potential configuration of the sunspot.
More strikingly, we find that the computed transverse field reaches maximum values where the peak in absorption is observed. It is important to have full spectro-polarimetric vector magnetic-field observations to obtain a clear idea about the dependence of the field configuration on the spatial distribution of acoustic power. We have not carried out the study of effects of magnetic field in the Doppler measurement which is done on the Zeeman sensitive spectral line profile. Rajaguru et al. (2007) presented a detailed study of the phase shifts on the acoustic waves when observed in a sunspot. They have shown that the phases of the acoustic waves within a sunspot, especially in the penumbra, could be altered due to the propagating nature of the p modes and also due to the Zeeman split of the spectral line which could in effect produce reduction in Doppler power in a particular frequency band.
6 Conclusions
We analyzed the spatial distribution of Doppler power in a sunspot observed near disk center. We find a structured ring like absorption pattern in Doppler power near the umbral-penumbral boundary. The computed transverse field is higher at those locations where the peak depression in Doppler power is observed. The computed inclination angle ranges between 35∘ and 45∘ at these locations. In order to understand the exact dependence of magnetic field strength and inclination on the Doppler power absorption, full vector magnetic-field observations are required. Also, it is preferred to have Doppler observation in magnetically insensitive lines to avoid any cross-talk between the line-of-sight velocity measurement and Zeeman splitting of the spectral line.
Acknowledgements
I would like to thank B. Ravindra for providing the code for potential field calculation and the anonymous referee for their valuable comments which helped to improve the paper substantially. SOHO is a project of international cooperation between ESA and NASA.
References
- Braun (1995) Braun, D.C.: 1995, Astrophys. J. 451, 859.
- Braun et al. (1987) Braun, D.C., Duvall, T.L Jr., LaBonte, B.J.: 1987, Astrophys. J. 319, L27.
- Brownet al. (1992) Brown, T.M., Bogdan, T.J., Lites, B.W., Thomas, J.H.: 1992, Astrophys. J. 394, L65.
- cally1 (1993) Cally, P.S., Bogdan, T.J.: 1993, Astrophys. J. 402, 732.
- cally2 (1994) Cally, P.S., Bogdan, T.J., Zweibel, E.G.: 1994, Astrophys. J. 437, 505.
- cally (2000) Cally, P.S.: 2000, Solar Phys. 192, 395.
- cally3 (2003) Cally, P.S., Crouch, A.D., Braun, D.C.: 2003, Mon. Not. Roy. Astron. Soc. 346, 381.
- hagyard (1987) Hagyard, M.J.: 1987, Solar Phys. 107, 239.
- hindman (1998) Hindman, B.W., Brown, T.M.: 1998, Astrophys. J. 504, 1029.
- keppens (1996) Keppens, R., Martinez Pillet, V.: 1996, Astron. Astrophys. 316, 229.
- lindsey (2005) Lindsey, C., Braun, D.C.: 2005, Astrophys. J. 620, 1107.
- mathew (2003) Mathew, S.K., Lagg, A., Solanki, S.K., Collados, M., Borrero, J.M., Berdyugina, S., Krupp, N., Woch, J., Frutiger, C.: 2003, Astron. Astrophys. 410, 695.
- muglach (2005) Muglach, K., Hofmann, A., Staude, J.: 2005, Astron. Astrophys. 437, 1055.
- rajaguru (2007) Rajaguru, S.P., Sankarasubramanian, K., Wachter, R., Scherrer, P.H.: 2007, Astrophys. J. 654, L175.
- rosen (2000) Rosenthal, C.S., Julien, K.A.: 2000, Astrophys. J. 532, 1230.
- sakurai (1989) Sakurai, T.: 1989, Space Sci. Rev. 51, 11.
- scherrer (1995) Scherrer, P.H., et al.: 1995, Solar Phys. 162, 129.
- spruit0 (1991) Spruit, H.C.: 1991, In: Toomre, J., Gough, D.O. (eds.), Lecture Notes in Physics: Challenges to Theories of the Structure of Moderate Mass Stars, Springer, Berlin, 388, 121.
- spruit (1996) Spruit, H.C.: 1996, Bull. Astron. Soc. India. 24, 211.
- spruit1 (1992) Spruit, H.C., Bogdan, T.J.: 1992, Astrophys. J. 391, L109.
- tarbel (1988) Tarbell, T., Peri, M., Frank, Z., Shine, R., Title, A.: 1988, In: Rolfe, E. (ed.) Seismology of the Sun and Sun-like stars SP-286, ESA, Noordwijk, 315.
- pvk (2002) Venkatakrishnan, P., Kumar, B., Tripathy, S.C.: 2002, Solar Phys. 211, 77.
- westen (2001) Westendorp Plaza, C., Del Toro Iniesta, J.C., Ruiz Cobo, B., Martinez Pillet, V., Lites, B.W., Skumanich, A.: 2001, Astrophys. J. 547, 1130.
- woods (1981) Woods, D.T., Cram, L.E.: 1981, Solar Phys. 69, 233.