Deep Chandra X-ray Observations of Low Mass X-ray Binary Candidates in the Early-Type Galaxy NGC 4697
Abstract
Chandra X-ray observations routinely resolve tens to hundreds of low-mass X-ray binaries (LMXBs) per galaxy in nearby massive early-type galaxies. These studies have raised important issues regarding the behavior of this population of remnants of the once massive stars in early-type galaxies, namely the connection between LMXBs and globular clusters (GCs) and the nature of the LMXB luminosity function (LF). In this paper, we combine five epochs of Chandra observations and one central field Hubble Space Telescope Advance Camera for Surveys observation of NGC 4697, one of the nearest, optically luminous elliptical (E6) galaxies, to probe the GC-LMXB connection and LMXB-LF down to a detection/completeness limit of . We detect 158 sources, present their luminosities and hardness ratios, and associate 34 LMXBs with GCs. We confirm that GCs with higher encounter rates () and redder colors (higher metallicity ) are more likely to contain GCs, and find that the expected number of LMXBs per GC is proportional to , consistent with fainter X-ray sources in Galactic GCs and LMXBs in Virgo early-type galaxies. Approximately % of GCs in NGC 4697 contain an LMXB at the detection/completeness limit. We propose that the larger proportion of metal-rich GCs in NGC 4697 compared to the Milky Way explains why these fractions are much higher than those of the Milky Way at similar luminosities. We confirm that a broken power-law is the best fit to the LMXB-LF, although we cannot rule out a cutoff power-law, and argue that this raises the possibility that there is no universal form for the LMXB-LF in early-type galaxies. We find marginal evidence for different LFs of LMXBs in GCs and the field and different spectra of GC-LMXBs and Field-LMXBs.
Subject headings:
binaries: close — galaxies: elliptical and lenticular, cD — galaxies: star clusters — globular clusters: general — X-rays: binaries — X-rays: galaxies1. Introduction
Observations with the Einstein Observatory revealed that early-type galaxies can be luminous X-ray sources (Forman et al. 1985). Prior to the launch of the Chandra X-ray Observatory, observations of X-ray faint galaxies, galaxies with relatively low X-ray-to-optical luminosity ratios, indicated the presence of two distinct spectral components: a soft () component (Fabbiano et al. 1994; Pellegrini 1994; Kim et al. 1996) and a hard (–) component (Matsumoto et al. 1997). The soft component was attributed to hot interstellar gas and the hard component to low-mass X-ray binaries (LMXBs; Kim et al. 1992). Starting with the Chandra X-ray Observatory observation of the X-ray faint elliptical, NGC 4697 (catalog ) (Sarazin et al. 2000, 2001, hereafter Papers I and II), this picture has been confirmed; the majority of X-ray emission in X-ray faint early-type galaxies has been resolved into X-ray point sources, whose properties are consistent with LMXBs. With its ability to resolve LMXBs and accurately measure their positions, Chandra has raised at least two major issues regarding the behavior of the LMXBs as a population, namely the connection between LMXBs and globular clusters (GCs) and the nature of the LMXB luminosity function (LF).
From Chandra, a high percentage of LMXBs have positions coincident with globular clusters (GCs, Angelini et al. 2001; Sarazin et al. 2003); only of Milky Way LMXBs are found in GCs. This raised the question as to where LMXBs in early-type galaxies formed. One early suggestion was that all LMXBs in early-type galaxies formed in GCs, with LMXBs observed to be in the field of the galaxy (Field-LMXBs) having escaped from GCs through supernovae kick velocities, stellar dynamical processes, or the dissolution of the GC due to tidal effects (White et al. 2002). Later analyses have suggested that a significant fraction of Field-LMXBs were formed in situ (Juett 2005; Irwin 2005), although there is evidence that more Field-LMXBs in lenticular galaxies, as opposed to elliptical galaxies, may have originated in GCs and later escaped into the field (Irwin 2005). The extent to which LMXBs can be used to probe GC formation and evolution, as well as LMXB formation, depends critically on understanding the GC/LMXB connection. Given that the primary binary formation scenario in GCs is thought to involve dynamical interactions, as opposed to the predominantly primordial nature of binaries formed in the field, these different populations should trace different LMXB formation histories and may trace different star formation histories in early-type galaxies.
Chandra has also explored the LF of LMXBs. At the bright end of the LF of NGC 4697, a possible break near the Eddington limit of a neutron star (NS) was found in Paper I. This break was argued to be due to the presence of two LMXB populations, a black hole (BH) population at the bright end, and a predominantly NS population at the faint end. Bildsten & Deloye (2004) argued that such a break may be due to ultracompact binaries. Although Kim & Fabbiano (2003) argue that no break was required in NGC 4697 after correcting for incompleteness, they do find that a break near gives an improved fit compared to a single power-law for a uniformly selected, incompleteness corrected sample of 14 early-type galaxies. At the faint end, Voss & Gilfanov (2006) found that the LF in Cen A (catalog NGC 5128) flattens significantly below and follows the law in agreement with the behavior found for LMXBs in the Milky Way and the bulge of M31. One interpretation of this break in the Milky Way LF is that there are two populations of short period LMXBs: those where magnetized stellar winds dominate mass transfer, and those where gravitational radiation drives the accretion (Postnov & Kuranov 2005). Measuring and understanding the LF of LMXBs in early-type galaxies has clear implications in our understanding of the number and type of binary systems that make up the zoo of LMXBs.
As more LMXBs are detected and characterized, more examples of extragalactic LMXB candidates with extreme behaviors, such as supersoft sources (SSs) and ultraluminous X-ray sources (ULXs) are being identified by Chandra and studied in greater detail. The SSs have very soft X-ray spectra similar to SSs in our Galaxy and M31 that are generally believed to be accreting white dwarfs (WDs); however, the bolometric luminosities of extragalactic SSs can exceed the Eddington luminosity for a Chandrasekhar mass WD. One hypothesis is that these sources contain intermediate-mass (–) accreting BHs (Swartz et al. 2002). A great deal of attention has been spent on ULXs, which we define as (0.3–10.0 keV). However, except possibly for LMXB candidates in NGC 720 (catalog ) (Jeltema et al. 2003), NGC 1399 (catalog ) (Angelini et al. 2001), NGC 1600 (catalog ) (Sivakoff et al. 2004), and NGC 4482 (Maccarone et al. 2007), ULXs are generally not found within old stellar systems beyond the number expected from unrelated foreground or background sources (Irwin et al. 2004).
By stacking multi-epoch Chandra observations of an early-type galaxy, more, fainter LMXB candidates can be studied, and brighter LMXB candidates can be studied in greater detail. In this Paper, we report on multi-epoch Chandra X-ray observations of NGC 4697, one of the nearest (; see footnote 18 of Jordán et al. 2005) optically luminous () elliptical (E6) galaxy. (There is a weak disk; however, it not comparable to those seen in lenticular galaxies (Peletier et al. 1990)). We adopted the 2MASS Point Source Catalog (Skrutskie et al. 2006) position of R.A. and Dec. as the location of the center of NGC 4697 and the Third Reference Catalogue of Bright Galaxies (RC3) optical photometry values for the effective radius (), position angle (, measured from north to east), and ellipticity (), which assumes a de Vaucouleurs profile (de Vaucouleurs et al. 1992). From these values, we calculate the optical photometry’s effective semi-major distance (). This galaxy lies in front of the bulk of the galaxies in the Virgo cluster, and is south of M87 (catalog ), the galaxy at the dynamical center of the Virgo cluster. We also report on the GC/LMXB connection as determined from a joint observation of the central region by the Hubble Space Telescope Advance Camera for Surveys (HST-ACS; Ford et al. 1998).
In § 2, we discuss the observations and data reduction of NGC 4697. The X-ray image and the detection of X-ray sources are discussed in § 3 and § 4. In § 5, we discuss the optical counterparts from ground-based and HST observations. We examine the GC/LMXB connection in detail in § 6. The analyses of luminosity, hardness ratios, and spectra are considered in § 7–9. Finally, we summarize our conclusions in § 10. We concentrate on the variability of the X-ray sources in our companion paper (Sivakoff et al. 2008b, hereafter Paper V). Unless otherwise noted, all errors refer to confidence intervals, count rates are in the – band, and fluxes and luminosities are in the – band, with absorption effects removed.
2. Observations and Data Reduction
2.1. Chandra X-ray Observatory
Chandra has observed NGC 4697 five times, 2000 January 15, 2003 December 26, 2004 January 06, February 02, and August 18, using the ACIS detector for live exposures of 39260, 39920, 35683, 38103, and (Observations 0784 (catalog ADS/Sa.CXO#obs/00784), 4727 (catalog ADS/Sa.CXO#obs/04727), 4728 (catalog ADS/Sa.CXO#obs/04728), 4729 (catalog ADS/Sa.CXO#obs/04729), and 4730 (catalog ADS/Sa.CXO#obs/04730)). Observation 0784 was operated at with a frame time of , and the ACIS-23678 chips were telemetered and cleaned in Faint mode. Observations 4727, 4728, 4729, 4730 (hereafter the Cycle-5 observations) were operated at with frame times of , and the ACIS-35678 chips were telemetered and cleaned in Very-Faint mode. Since the X-ray point spread function (PSF) increases with the distance between point sources and the optical axis of Chandra, the Cycle-5 pointings were determined to maximize field-of-view (FOV) while placing the galaxy center close to the optical axis and away from node boundaries on the S3 chip. The analysis in this Paper is based on data from the S3 chip alone, although a number of serendipitous sources were seen on the other chips. The elliptical area common to all five observations on the S3 chip () corresponds to 74% of the integrated light for a de Vaucouleurs profile. Known aspect offsets were applied to each observation. Our analysis includes only events with ASCA grades of 0, 2, 3, 4, and 6. Photon energies were determined using the gain files acisD1999-09-16gainN0005.fits (Observation 0784) and acisD2000-01-29gain_ctiN0001.fits (Cycle-5 observations). In the latter cases, we corrected for the time dependence of the gain and the charge-transfer inefficiency. All five observations were corrected for quantum efficiency (QE) degradation and had exposure maps determined at . We excluded bad pixels, bad columns, and columns adjacent to bad columns or chip node boundaries.
Although Chandra is known to encounter periods of high background (“background flares”), which especially affect the backside-illuminated S1 and S3 chips111See http://cxc.harvard.edu/contrib/maxim/acisbg/., the use of local backgrounds and small extraction regions in the point source analysis mitigates the effect of flaring. To avoid periods with extreme flaring we only included times where the blank-sky rate was less than three times the expected blank-sky rate derived from calibrated blank-sky backgrounds. For Observation 0784, the S3 chip itself, excluding regions of emission, was used as the observed blank-sky and checked against Maxim Markevitch’s aciss_B_7_bg_evt_271103.fits blank-sky background11footnotemark: 1 using – count rates. For the Cycle-5 observations, the other back-illuminated chip, S1, was available. Here, we used this chip, excluding regions of emission, and compared to the blank-sky background in CALDB using – count rates. Minimal time was lost in all observations due to the binning used to check the rates; more extensive time was lost in Observation 4729 due to a large background flare. No periods of data dropout were observed. Final flare-filtered live exposure times for the five observations were 37174, 39919, 35601, 32038, and .
We registered the Cycle-5 observations astrometry against the Observation 0784 astrometry (see § 4). No absolute astrometric correction was necessary (see § 5.1.). For imaging and source detection only, we created a merged events file and exposure map with a live exposure time of . In this Paper and Paper V, we analyze the 158 sources detected from the merged events file.
All Chandra observations were analyzed using ciao 3.1222See http://asc.harvard.edu/ciao/. with caldb 2.28 and NASA’s ftools 5.3333See http://heasarc.gsfc.nasa.gov/docs/software/lheasoft/.. Source positions and extraction regions were refined using ACIS Extract 3.34444See http://www.astro.psu.edu/xray/docs/TARA/ae_users_guide.html.. All spectra were fit using xspec33footnotemark: 3.
2.2. Hubble Space Telescope
We observed the center of NGC 4697 with the Hubble Space Telescope Advance Camera for Surveys (HST-ACS), acquiring two exposures in the F475W () band, two exposures in the F850LP () band, and one F850LP exposure. Source detection and characterization were performed similarly to Jordán et al. (2004a), leading to a list of globular clusters (GCs) and other optical sources. We fit PSF convolved King (1966) models to all detected sources using the code KINGPHOT described in Jordán et al. (2005). In addition to best-fit magnitudes and , the code returns the best-fit half-light radius for each source. Details concerning the HST-ACS observation, data analysis, and optical source properties are given in Jordán et al. (2008, in preparation).
3. X-ray Image
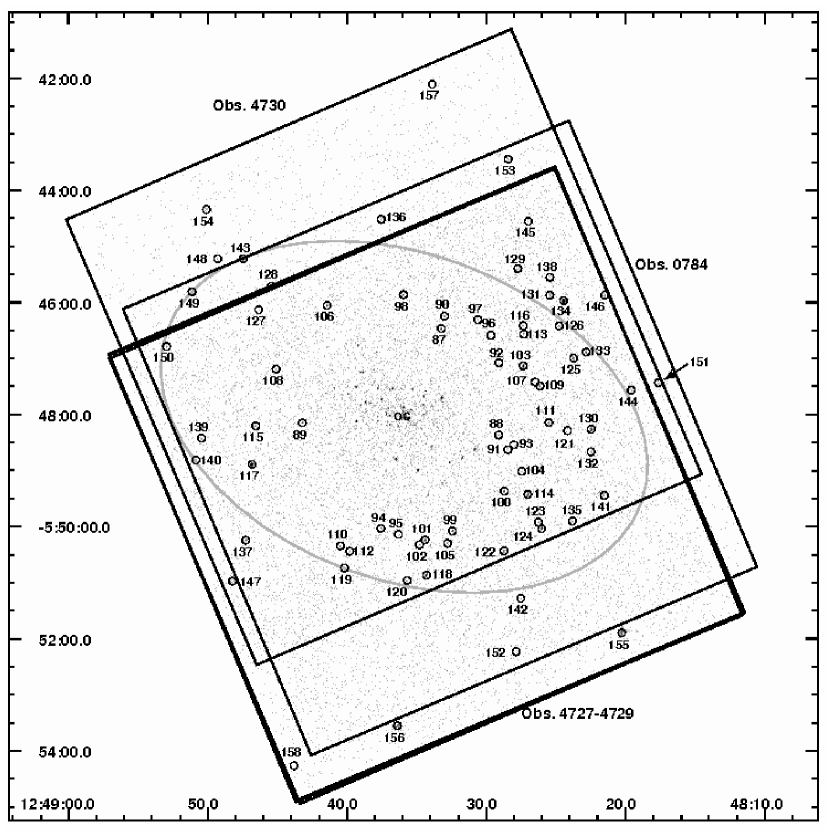
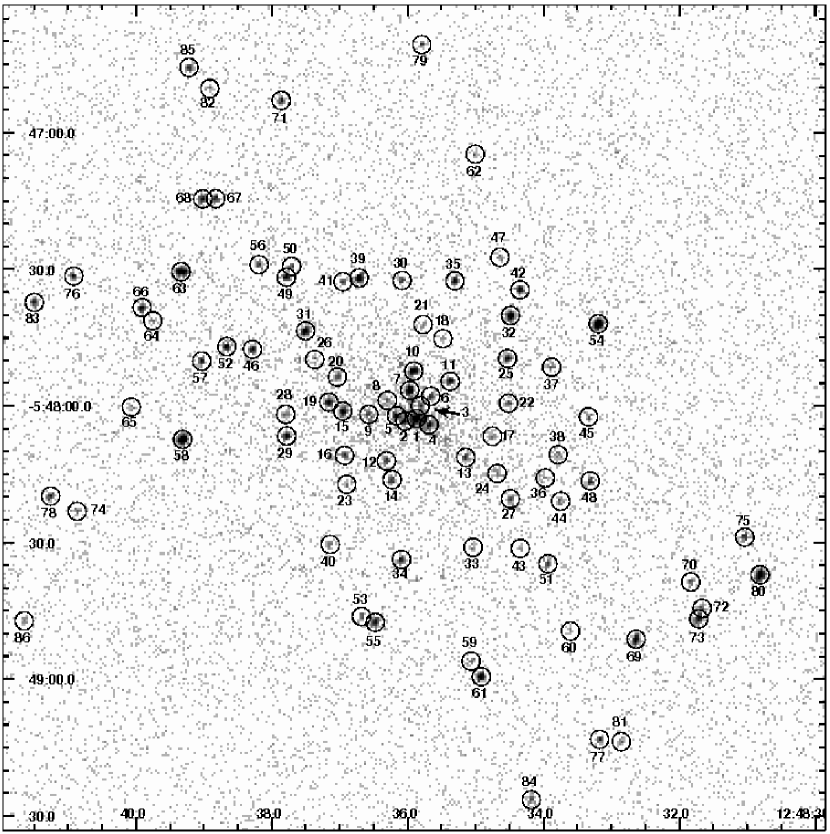
In Paper I and Paper II, it was shown that most of the X-ray emission in NGC 4697 is resolved into point sources. We display the raw Chandra image from the combination of all five observations in the 0.3– band in Figures 1 and 2. These images are roughly consistent with the previously published data; new sources have been detected due to greater sensitivity, source variability, and increased FOV. The FOV of the five observations, as well as a finding chart for the X-ray sources, are overlaid on the raw images.
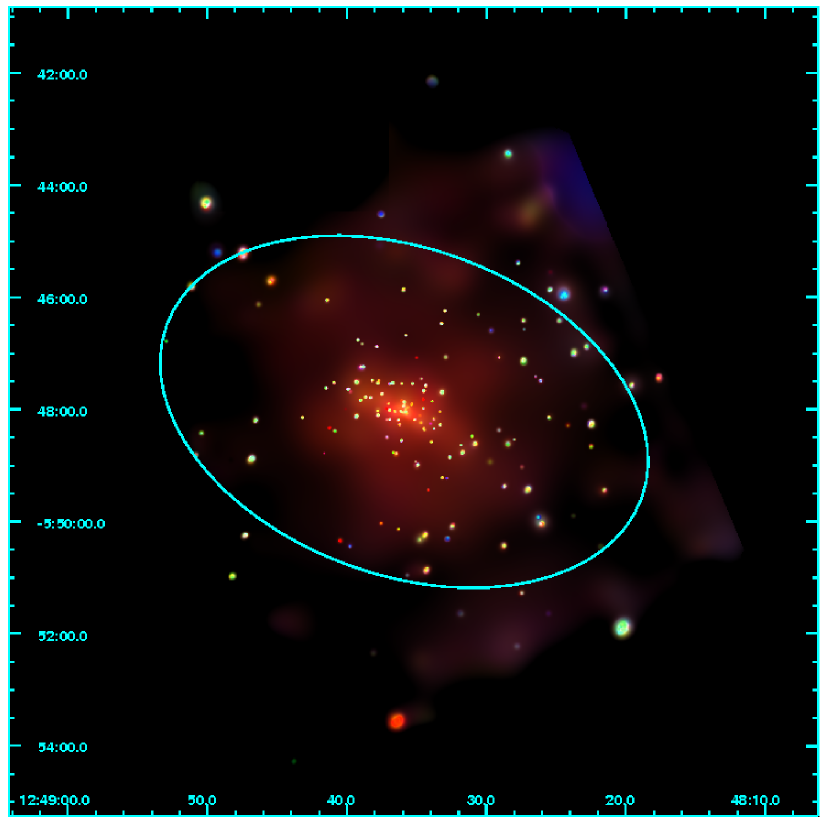
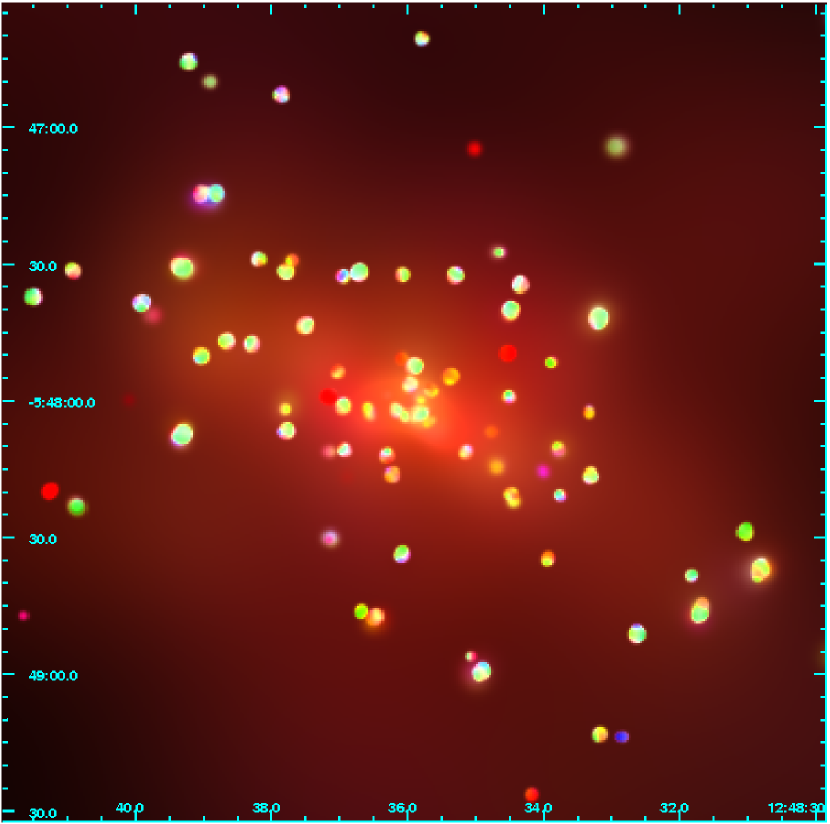
To contrast the detected sources with the diffuse emission, we adaptively smoothed the Chandra S3 X-ray raw image using a minimum signal-to-noise ratio (S/N) per smoothing beam of 3. We then applied these smoothing scales to background-subtracted, exposure-corrected images in the soft (0.3–), medium (1–), and hard (2–) bands. The background includes the readout artifact in ACIS and the deep blank-sky backgrounds compiled by Maxim Markevitch11footnotemark: 1. We combined these three bands to create a logarithmically scaled image between and in total surface brightness. The resulting representative-color images of the entire galaxy and of the central region are shown in Figures 3 and 4. There is clearly soft (red) diffuse emission near the center of NGC 4697. The majority of the sources stand out clearly in color from the soft diffuse gas, appearing yellow to green. There are some soft sources which appear to be associated with NGC 4697 based on their concentration towards the center of the galaxy, while most of the hardest (blue) sources, which are likely to be absorbed AGNs (see § 8), tend to lie in the outer regions of the image.
4. X-ray Source Detection
In Table 1, we list all discrete sources detected by wavdetect over the 0.3–6 keV range. We ordered the sources by increasing projected radial distance from the center of the galaxy, . Columns 1–8 provide the source number, IAU name, source position (J2000), projected radial distance, projected semi-major distance from the center of NGC 4697, , photometric count rate with its error, and S/N for the count rate. Photon errors were calculated using the upper Gehrels error approximation of (Gehrels 1986). For comparison with Paper II, column 10 lists the source number used there. Notes for each source are listed in column 11. The derived parameters and notes are expanded upon in the text below.
To identify the discrete X-ray source population, we applied the wavelet detection algorithm (ciao wavdetect program) with scales ranging from 1 to 32 pixels with a source detection threshold of . Source detection was not done in regions with an exposure of less then 10% of the total for the observation. We expect false source (due to a statistical fluctuation in the background) for each S3 image. The source detections were first done on each observation separately to create a source list against which to register the astrometry. We detected 97, 78, 87, 77, and 98 sources in Observations 0784, 4727, 4728, 4729, and 4730. We then registered the astrometry of each Cycle-5 observation against Observation 0784. Using 55, 56, 51, and 55 sources matched to within , the relative astrometry corrections were , , , and .
To maximize S/N, we analyzed the wavelet detection results from the combination of the five observations (Figure 1). Since there were five approximately equally sensitive observations, we reduced the exposure threshold of this merged source detection to 2% of the total. There was a 50% increase in the FOV compared to a single S3 chip, so we expect false source. We detected 158 sources. All of the detections in Observation 0784 were in the merged detection list. In the Cycle-5 observations, a few weak detections were not found in the merged detection list. None of these detections would have fluxes determined at the level; detections not in the merged detection list are not discussed further in this Paper.
Working from the coordinate list generated by wavdetect, we used ACIS Extract to create source extraction and masking regions, as well as refine the source positions. For each observation, we created a source extraction region consistent with the X-ray PSF at the source position. Most of the regions encircled 90% of the flux in the X-ray PSF at . For sources whose median photon energy over all five observations was not –, we determined the PSF at either (Sources 19, 23, 25, 62, and 78) or (Sources 96, 119, and 138). We used a lower percentage of the PSF in the case of few sources whose regions would otherwise have overlapped in one of the observations (85% for Sources 2/5; 80% for Sources 49/50; 50% for Sources 72/73). The wavdetect source extents were compared to the PSF sizes at the locations of the sources; all were consistent except those for Sources 8, 22, 123, and 158. Thus, these sources may be extended or multiple, and are marked with a note in Table 1. Masking circular regions around the source at a radius encircling of the PSF were created for every source.
The refined source positions for a majority of the sources came from the average position of 0.3– photons in the source extraction regions. For Sources 142, 148, 152, and 154–158, whose average positional offset from the optical axis is more than , we correlated the 0.3– photons near the wavdetect coordinates against the average X-ray PSF of each source to refine their positions.
To subtract out overlapping diffuse gas and background emission we used a local background with an area approximately three times that of each source’s extraction region. The background region excluded photons in the masking region. In cases where background regions overlapped or fell along node/chip boundaries, we slightly altered these overlapping regions, preserving the ratio of source to background areas and ensuring that the source region and background region had similar mean exposures.
The observed net count rates, their errors, and the S/Ns were calculated by stacking the observations, correcting for background photons, and dividing by the sum of the mean exposures over each source region.
We list the results of all analyses for all sources in this Paper’s tables; however, we restrict discussion of sources, except for identification of possible optical counterparts, to the 126 that have photometric count rates determined at the level. These significantly detected sources, hereafter the Analysis Sample, all have at least 18 net counts.
The minimum detected count rate in the 0.3– band for our Analysis Sample sources is . This count rate is 2.6 times as deep as the count rate from Observation 0784 alone (Paper II). Three sources below the Analysis limit (136, 152, 157) but with count rates above are not covered by all five observations. The other sources below the Analysis limit reach count rates as low as .
We estimated the completeness of all sources through simulations using marx 4.0.8555See http://space.mit.edu/CXC/MARX/.. We used the normalized background generated by wavdetect and the photometrically determined counts (after PSF corrections) to perform 400 simulated runs of our five observations of NGC 4697. The resulting completeness correction factor, , the ratio of the number of times a source was simulated to the number of times it was detected, is accurate to for the majority of sources; however, the uncertainty increases to for the largest correction factors. All sources with observed count rates had correction factors except for Sources 72, 102, and 158. In the simulations, Sources 72 and 73 were often confused as one source with a position closer to Source 73. Sources 102 and 158 had . The average completeness correction factor in the Analysis Sample is . For sources not in the Analysis Sample, averaged , and reached as high as 5.71 for the weakest sources. Our completeness results are roughly consistent with Kim & Fabbiano (2003).
There are objects unrelated to NGC 4697 among the detected sources. Since the FOV sampled by the ChaMP survey (Kim et al. 2004) is larger than the Chandra deep fields, the source counts from the former should be less susceptible to cosmic variance. Therefore, we chose to use their soft band source counts to estimate the number of foreground or background objects at different flux levels. At the flux limit of our Analysis Sample, , we expect foreground or background objects, including corrections for exposure and completeness. We estimate of the sources outside of the Analysis Sample are also unrelated to NGC 4697. Since these sources should be fairly uniform over the FOV, sources close to NGC 4697 are more likely to be associated with the galaxy than sources farther out.
5. Optical Counterpart Identification
5.1. Existing Catalog Identifications
The refined source positions of seven X-ray sources from the combined S3 image agreed with positions from the Tycho-2 Catalog (Høg et al. 2000), the 2MASS Point Source and Extended Source Catalogs (Skrutskie et al. 2006), and/or the USNO-B Catalog (Monet et al. 2003). (When a source appeared in both 2MASS catalogs, the Point Source Catalog positions were used.) In cases where there are counterparts in multiple catalogs, we adopt the positions in the order of the catalogs listed above. These seven sources (15, 55, 84, 117, 149, 155, and 156) were used to check the absolute astrometry. Since the mean positional offset of the sources was in R.A. and in Dec., the ACIS Extract positions are consistent with no required absolute astrometric change. The typical absolute astrometric errors are probably near the field center, with larger errors for weaker sources with extended PSFs.
Having established the absolute astrometry, we conservatively considered all optical sources within as potential optical counterparts. We summarize their optical properties in Table 2. The first three columns list the X-ray source number, designation of the optical counterpart, and positional offset between the X-ray and optical catalogs. In the fourth column, we list the photometric properties of the optical counterpart, while we list notes about the optical properties in the fifth column. We classify the counterpart as optically extended or an optical point source. For 2MASS objects, we use its values of the reduced for fitting PSFs to each source in each band (a reduced indicates the optical counterpart is extended, and may be a galaxy). For the USNO-B1 objects, we use their star-galaxy separation class (objects in the lower half of classes are classified as optically extended). We add a question-mark when we are unsure of the classification. Typically this occurs because galaxy light may have contaminated the analysis or because the classification in at least one color differs significantly from the other colors.
In addition to the sources used to check astrometry, Sources 1, 8, and 118 have potential optical counterparts. Since Source 1 is away from the adopted center of NGC 4697, it may be a central AGN. Since this source could also be an LMXB (or several confused LMXBs) near the center of the galaxy, we did not use this match to check the astrometry. The optical counterparts of Sources 8, 15, 117, 118, and 155 appear to be optically extended. We note that Source 117 is a known AGN (Paper II). Although Source 118 is associated with 2MASX J12483504-0550473 (catalog ) in NED, that source is actually away and its counterpart, USNO-B1 0841-0238567, is clearly different on Digital Sky Survey (DSS) images. Since the extrapolated fiducial radius of 2MASX J12483504-0550473 (catalog ) is , it is unlikely that Source 118 is associated with that galaxy. Sources 55, 84, 149, and 156 appear point-like from the ground; Source 156 is clearly the bright foreground star BD-05 3573 (catalog ). Finally, we note that Sources 103, 123, 132, 143 may have uncatalogued counterparts on DSS second generation images. Footnotes in Table 1 indicate X-ray sources with possible optical counterparts.
In Sarazin et al. (2001), associations with GCs in lists of Hanes (1977) and Kavelaars (2000, private communication) were made. Sources 101 and 117 were previously identified with Hanes (1977) GC candidates; we find no new GC-LMXB candidates among the Hanes (1977) sources and note that Source 117 and its optical counterpart has already been shown to actually be an AGN. Sources 79, 80, 83, 84, 86, 88, 93, 98, 101, 109, 113, and 114 are associated with GC candidates in the Kavelaars data, with Sources 79, 86, 88, 93, and 113 representing new detections. Some of the Kavelaars GC candidates with potential X-ray counterparts are also in the HST-ACS FOV discussed in § 5.2 (Sources 79, 80, 83, 84, 86). The measured colors and sizes from the HST-ACS observations allow us to more accurately identify GC candidates. The colors of Source 84 suggest it is not a GC, while the other sources have colors and sizes consistent with GCs. Since the Hanes and Kavelaars GC datasets do not have the same sensitivity or measured properties of the HST-ACS dataset or of our recently obtained flanking field ACS observations, we will not make further use of GC counterparts outside of the HST-ACS central FOV here.
We matched the X-ray sources with a previous ROSAT-HRI X-ray observation of NGC 4697 (Irwin et al. 2000, hereafter I2000). Twelve sources within of NGC 4697 were detected by ROSAT-HRI with , after correcting for the distance and spectra we use in this Paper. We match I2000 Sources 1, 2, 4, 5, 6, 9, 10, 11, and 12 with this Paper’s Sources 103, 80, 69, 54, 118, 58, 128, 117, 143. Confusion in the center of NGC 4697 limits matching I2000 Source 7 with this Paper’s Sources 1, 3, 4, and 6; although it is likely matched to this Paper’s Source 1, which is the brightest of the four sources. Similarly, confusion limits matching I2000 Source 8 with this Paper’s Sources 6, 7, 10, and 11. We clearly do not detect I2000 Source 3.
We also matched sources with Paper II, whose data (Observation 0784) is a subset of the data in this Paper. We list those matches in Table 1. Only two Paper II sources (7 and 87) are undetected in the larger dataset. Paper II Sources 7 and 10 are separated by only . It is unclear whether they are a single source. Paper II Source 87 was near the limit of the S/N in Paper II. It was not detected in the individual reanalysis of Observation 0784, even when detections were made in the 0.3–10 keV range to match Paper II.
5.2. HST-ACS Identifications
In our HST-ACS observation, we placed the center of NGC 4697 from the center of the ACS FOV to avoid a chip boundary. Within this FOV, we can identify optical sources and separate out the GCs using a combination of magnitude, color, and spatial extent. This method is discussed in detail in Peng et al. (2006) and Jordán et al. (2008, in preparation). Out of 703 optical sources, there are 298 GC candidates.
We registered the HST observation to the Chandra observation using all 703 optical sources. Through cross-correlation techniques, we determined that the HST coordinates required astrometric shifts of in R.A. and in Dec. Based on singly matched sources within , we estimate a relative astrometric error of and in R.A. and Dec., respectively, or in quadrature. Since most of these matches occur close to the X-ray pointing center, it is not surprising that this astrometric error is slightly smaller than the astrometric error derived from ground-based catalogs. After correcting the astrometry, we determined that the ACS FOV covers X-ray Sources 1–67, 69–87, 89, 94, and 108. Due to a prominent elliptical dust feature ( or ), we did not attempt to detect optical sources in the region of X-ray Sources 1–5 and 8. X-ray Source 68 falls in the chip boundary. Adopting a search radius of , we find 42 optical counterparts to 39 X-ray sources; three X-ray sources have two candidate optical counterparts within . Thirty-three of the X-ray sources are associated with a single GC counterpart, while one X-ray source is likely to be associated with one of two potential GC counterparts. We list the optical properties of the matched sources in Table 3.
By randomizing the P.A. of a source list, assuming both a circular profile and a profile matching the galaxy’s elliptical isophotes, we have determined the percentage of false matches within a given radius. Randomizing the optical source list, we find that of X-ray sources without a physically associated optical source will have a false optical match within . This is consistent with only 3/39 of the X-ray/optical matches being false. If one considers only the GCs, of X-ray sources will have a false match. This is consistent with only 2/34 of the X-ray/GC matches being false. Randomizing the X-ray source list, we find that of GC sources without a physically associated X-ray sources will have a false optical match within . Finally, randomizing the optical source list and comparing to the unrandomized optical positions suggests that X-ray sources will be matched to two optical sources within by chance; we find three such matches.
6. GC/LMXB Connection
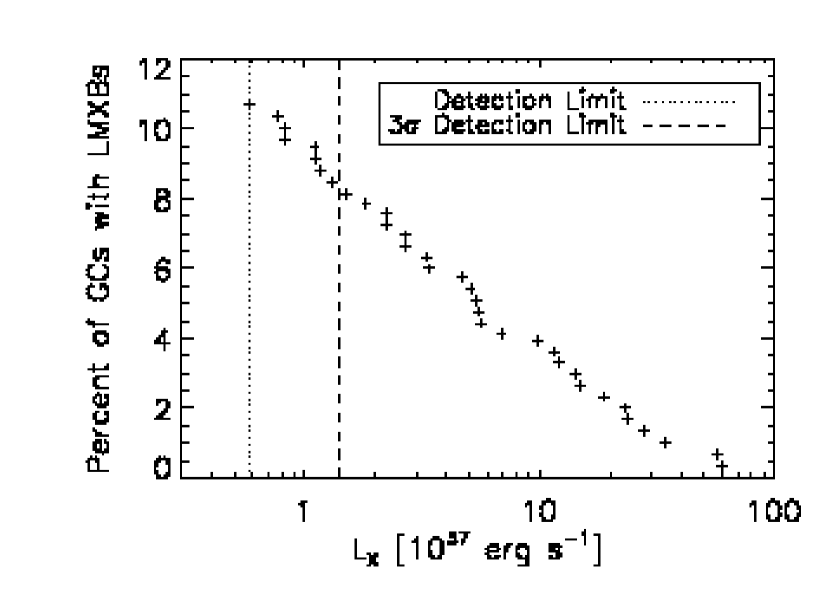
Having identified the LMXBs associated with GCs and determined the percentage of falsely matched sources, we now explore the GC/LMXB connection. The broadest measures of the GC/LMXB connection are the fraction of LMXBs associated with GCs and the fraction of GCs associated with LMXBs. The fraction of LMXBs associated with GCs, , is and does not appear to depend on X-ray luminosity. On the other hand, the fraction of GCs with an LMXB, , naturally depends on the limiting X-ray luminosity. The result is shown in Figure 5. In NGC 4697, and other early-type galaxies (Sarazin et al. 2003), above . At the limit of our Analysis Sample, , has increased to ( LMXBs per normalizing LMXB detection to GC luminosity in the band). Among all detected sources (), rises to ( LMXBs per ). Since we are incomplete below the limit of our Analysis Sample and active LMXBs have , it is likely that the percentage of GCs with an active LMXB is even higher.
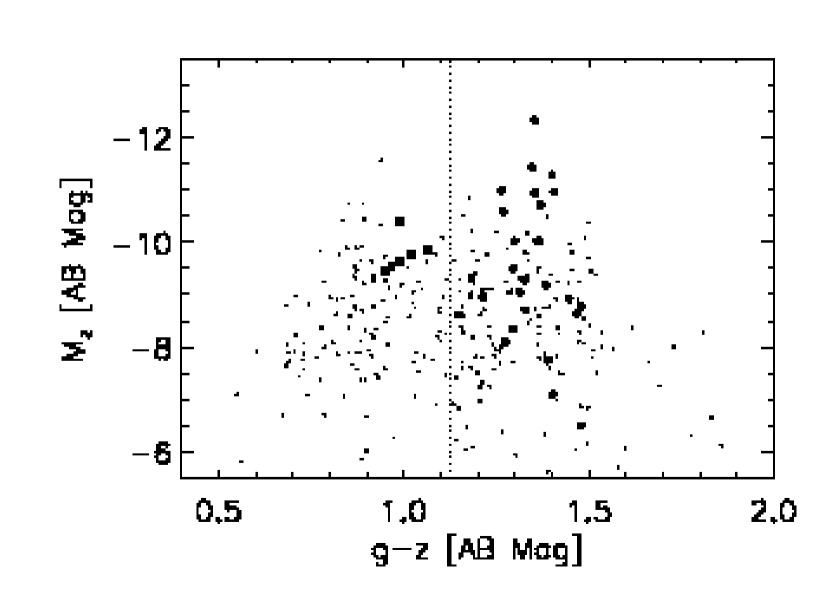
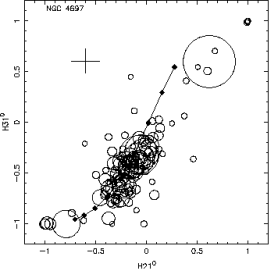
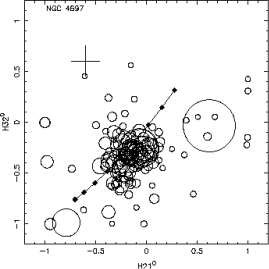
The optical properties of GCs are known to affect the GC/LMXB connection; LMXBs are found more often in optically bright GCs and in red GCs e.g., Kundu et al. 2003; Sarazin et al. 2003; Jordán et al. 2004b; Kundu et al. 2007; Sivakoff et al. 2007, hereafter S2007. The GC/LMXB connection in the center of NGC 4697 clearly follows this now familiar pattern (Figure 6, left). The color dependence is often interpreted as a metallicity dependence S2007; Kundu et al. 2007. In addition, the size of a globular cluster also plays a role, with smaller GCs being more likely to host LMXBs S2007; Jordán et al. 2007. Following Sarazin et al. (2003) and S2007, we have compared the distributions of GCs with and without LMXBs using the two-sample Kolmogorov-Smirnov test (), which measures the probability that two populations sampled from the same distribution have a maximum difference at least as large as is observed, and the non-parametric Wilcoxon rank-sum test (, equivalent to the Mann-Whitney rank-sum test; Mann & Whitney 1947), which measures the probability that a random sampling of two distributions with the same median would produce at least the observed difference in the sum of the ranks of the two distributions.
First, we compared the optical luminosities of GCs (represented by their ) with and without LMXBs. The mean optical magnitude of GCs with LMXBs is brighter then GCs without LMXBs, and we found and . That is, LMXBs are preferentially associated with optically luminous GCs at high statistical significance. Next, we compared the color distributions of GCs with and without LMXBs. The mean color of GCs containing LMXBs is nearly 0.2 magnitudes redder and the distributions are clearly different ( and ). These results are illustrated in Figure 6 (left). Quantifying the probabilities that GC contain LMXBs, we find LMXBs in of the blue GCs ( LMXBs per ) and of the red GCs ( LMXBs per ). The relative ratio of the specific frequencies for GC-LMXBs in red-GCs versus blue-GCs is smaller than the ratio of the probabilities a red-GC versus a blue-GC contains an LMXB. Although KS tests and Wilcoxon rank-sum test indicate the optical luminosities of red and blue GCs are likely to be drawn from the same parent distribution, the mean luminosity of the red-GCs is larger than the blue-GCs. We note that the mean luminosities of the GCs are strongly affected by the numbers of the most luminous GCs.
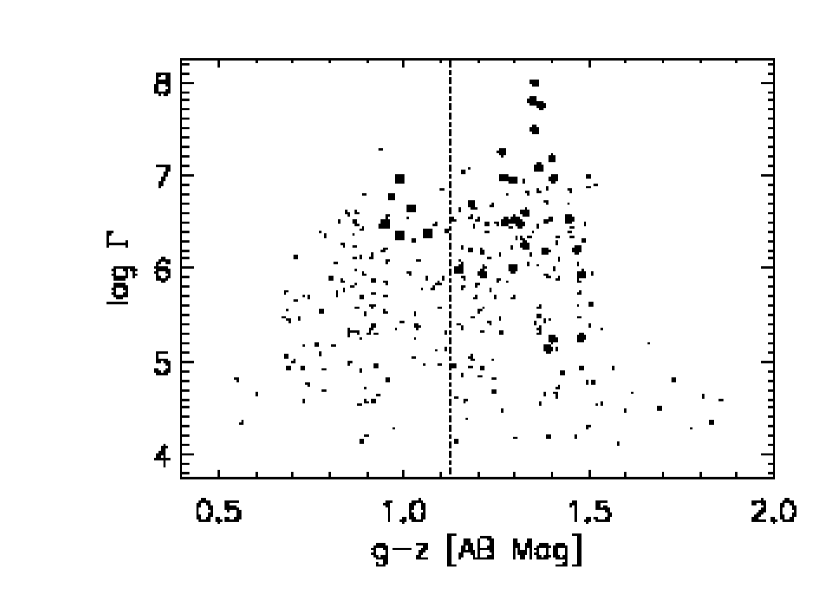
Jordán et al. (2004b) used HST-ACS data from M87 to compare the GC/LMXB connection with the encounter rates due to tidal capture and exchange interactions. The encounter rates are proportional to , where is the central density, and is the core radius. These values were estimated from fitting King profiles to the GC light and applying the Virial Theorem to relate the velocity of stars to the core radius. They found a strong indication that dynamical processes play a key role; however, the somewhat large uncertainties in the concentrations (the ratio of the tidal radius to the core radius, which is uniquely related to the ratio of the half-light radius to the core radius for King models) make estimates of less attractive observationally as a measure of encounter rates. Since the half-light radii, , and surface brightnesses of GCs, , are better constrained, we choose to use an alternate measure of the encounter rate, . In recent observations of Centaurus A, a much closer elliptical galaxy, Jordán et al. (2007) showed that concentration does not seem to be a fundamental variable in determining the presence of LMXBs in GCs, with the more fundamental parameters being related to central density and size. While this implies that the LMXB-GC connection should be stronger for than , results for can be taken as representative of the more fundamental parameters of central density and size. Mass segregation of GCs with the same half-mass radius (Jordán 2004) has been suggested as a possible explanation for a correlation typically observed between half-light radius and color (e.g., Kundu & Whitmore 2001; Jordán et al. 2005), with redder GCs being smaller. However, that correlation may also represent the convolution of an underlying size-galactocentric distance relation and the different spatial distribution of the metal-poor and metal-rich subpopulations of GCs (Larsen & Brodie 2003; Spitler et al. 2006); this is the so-called “projection effect”. Given that the observed correlation of half-light radii with color might not reflect a corresponding correlation for half-mass radii, we consider an alternative to the directly measured half-light radii that corrects for the empirical size-color correlation; we call this corrected radii “half-mass” radii, . We follow equations 1, 2, 5 , and 12 of S2007 to calculate the mass, half-mass radius, encounter rate proxy , and metallicity of our GCs. We note here, and throughout this section, that the choice of which radius to use ( or ) mainly alters results for the metallicity, as opposed to the size.
In Figure 6 (right), we display the color - encounter rate diagram. Globular clusters with larger encounter rates are more likely to contain LMXBs; the hypothesis that the distributions of encounter rates are the same for GCs with and without LMXBs is rejected ( and ). This picture does not qualitatively change if we calculate the encounter rates with the half-mass radii ( and ). If LMXBs are preferentially found in core-collapsed GCs, the difference between the actual encounter rates of GCs with and without LMXBs will be larger than what we measured. We note that the concentrations of GCs with and without LMXBs do not differ when considering samples with matched masses (Jordán et al. 2007), statistically validating the use of as a proxy for encouter rate. The correlation with encounter rate is actually stronger than that found for the optical luminosity, because smaller GCs appear (marginally) more likely to contain GCs in this galaxy, consistent with Centaurus A (Jordán et al. 2007) and the Virgo elliptical galaxies as a whole (Sivakoff et al. 2007). When we compare the distributions of for GCs with and without LMXBs, the hypothesis that they are the same is rejected ( and ); however, part of this correlation is due to the fact that redder GCs are both more likely to contain LMXBs due to their color, and are also smaller for the same mass. The differences between GCs with and without LMXBs are rejected more marginally when comparing the distributions of ( and ).
Recently, Kim et al. (2006b) suggested that may have a spatial dependence due to higher encounter rates in GCs near the centers of their host galaxies. Although our comparison of the projected galactocentric distances of GCs with and without LMXBs does not indicate that they are drawn from two separate populations at a significant level ( and ), we do note that the median galactocentric distance of GCs with LMXBs is smaller than those without. This question will be best addressed with our HST-ACS observations of the entire galaxy.
As in S2007, we have attempted to fit the expected number () of LMXBs in a GC with the sum of the false number of LMXBs matched to a GC and the true expected number parameterized by power-law dependences on the GC properties. We considered the forms:
| (1) |
and
| (2) |
where we evaluate the parameters separately using both and . The expected number of LMXBs in a GC can be converted to a probability that there are no LMXBs, , and the probability that there is at least one LMXB, . One can then maximize the log likelihood for a given form of , , where the products are taken over the lists of GCs with no LMXBs and GCs with LMXBs (Table 4).
Although the general maximum likelihood statistic does not provide a measure of goodness-of-fit, relative improvements () can be used to determine whether a given fit is a statistical improvement over a previous fit given the change in the number of degrees of freedom (dof). The change in the log-likelihood can also be used to provide errors on the fitted power-law indices. Here, we assumed that the errors in the fitting parameters in equations (1) & (2) are much larger than the uncertainties in the GC parameters (, , and ) due to either measurement errors or systematic errors in the conversions. Given the derived sizes of our errors, this is justified. To use the relative change in the log-likelihood (), we first established a baseline value of the log-likelihood () for the case where the expected number of LMXBs was constant and did not depend on any GC properties (Table 4, row 1).
We then fit various combinations of dependencies of on GC properties, and determined the values of for the best-fit values. In rows 2–5 of Table 4, the expected number of GCs is assumed to depend on only a single GC property (the mass, metallicity, half-light radius, or half-mass radius). Each fit is significantly better (27.5, 10.4, and 7.8 for one less dof) than the baseline fit, suggesting that all three properties affect , with mass having the strongest effect.
In the next two rows (6 and 7), the expected number of LMXBs is assumed to depend only on the encounter rate parameter . This fit was considerably better than those for any other single parameter. Thus, it appears that the most important single factor determining the occurrence of LMXBs in GCs is the dynamical encounter rate. Given that the encounter rate calculated from the half-light radius includes some metallicity dependence, it is not surprising that it fits better than the encounter rate calculated from the half-mass radius.
In the next 7 rows (8–14), the expected number of LMXBs is assumed to depend on pairs of the GC properties. It is particularly interesting to compare rows 8 and 9 with rows 6 and 7. The encounter rate parameter is calculated from the mass and the half-light (half-mass) radius (eq. 5 of S2007). Thus, these two sets of rows compare a general dependence on mass and radius with the specific form expected if LMXBs are formed dynamically in GCs. The separate mass and half-light radius dependence produces a marginally statistically significant better fit (, which implies significance), while the separate mass and half-mass radius dependences produces a less significant fit (, which implies significance). However, both are significantly better fits than just the GC mass, metallicity, or size dependence alone. In rows 8 and 9, note that the best-fit exponents for the mass () are very close to the value predicted by the dependence on in rows 6 and 7 ( and ), although the dependences on radius are steeper ( and ) than predicted by rows 6 and 7 ( and ).
In rows 10–12, the metallicity dependence and either mass or radius dependence are allowed to vary. Varying mass and metallicity dependences have the strongest effect; however, neither effect is as strong as varying the dynamical dependences (combination of mass and radius).
When we compare fits including metallicity and sizes calculated by half-light radii to metallicity and sizes calculated by half-mass radii (rows 11 and 12, 13 and 14, 15 and 16, and 17 and 18), we see a consistent pattern where the index involving size barely changes, but the metallicity index is smaller when half-light radii are used. Although this difference is not large for most of these comparisons compared to their precision, the accuracy of the metallicity index depends critically on which size is used. Under the mass-segregation hypothesis for the GC color-size dependence (Jordán 2004), the half-mass radius is clearly the correct size to use. We argue that this choice is also correct under the projection effect hypothesis (Larsen & Brodie 2003); however in this case, the correction to “half-mass” is actually a correction that is removing an effect on galactocentric distance. We note that the current analysis for NGC 4697 is insufficient to test this hypothesis.
In rows 13–18, we combine dynamical dependence and metallicity dependence variations, providing the best fits to the data. We adopt row 14, dependence on metallicity and encounter rate calculated by half-mass radius, as our best fit: . In addition to being the best statistical fit, we also note that this fit uses our preferred half-mass radius in calculating the encounter rate. The dependence on interaction rate matches well with the Galactic value found by Pooley et al. (2003) of . As NGC 4697 is a significant subset of the data used in S2007666We note that there was a minor error in the of NGC 4697 used in S2007, but that the changes this causes are within the quoted errors.,it is unsurprising that it matches well to the relation determined for the GC/LMXB connection in Virgo elliptical galaxies. For comparison with Jordán et al. (2004b), we also fit the form (row 16); our results agree. We note that allowing mass, metallicity, and size to vary all at once (rows 17 and 18) does not significantly improve the fits compared to allowing encounter rates and metallicity to vary (rows 13 and 14).
For our best fit, we find
| (3) |
where is calculated from . Since our analysis includes matches below the completeness limit, the measured normalization is intermediate between the true normalizations at the detection limit and the completeness limit. We adopted the best-fit parameters of equation 3 and only included matches above the completeness limit to determine that the normalization at the completeness limit of is . We can use the normalizations to estimate the number of GCs that might contain multiple LMXBs. (e.g., there are two Galactic LMXBs in M15; White & Angelini 2001). By summing over all the GCs, we calculate that and 4 GCs contain multiple LMXBs above the detection and completeness limits, respectively. The majority of the 34 GCs we detect with LMXBs are likely to contain only one LMXB.
7. X-ray Luminosities and Luminosity Functions
We used the best-fit Chandra X-ray spectrum of the inner resolved sources (: Table 7, row 3 below) and the assumption that each source was at the distance of NGC 4697 to convert the observed source count rates into unabsorbed X-ray (0.3–10 keV) luminosities (). The fluxes were corrected for exposure (including vignetting), the time dependent QE degradation of the ACIS-S3 chip, and the PSF fraction of source counts within the region used to extract the counts. For a typical source, the individual conversion factors from observed count rates were 1.18, 1.50, 1.46, 1.46, and , for each of the observations ordered by time. We list the individual luminosities of Observations 0784 (A), 4727 (B), 4728 (C), 4729 (D), and 4730 (E) in columns 2–6 of Table 5.
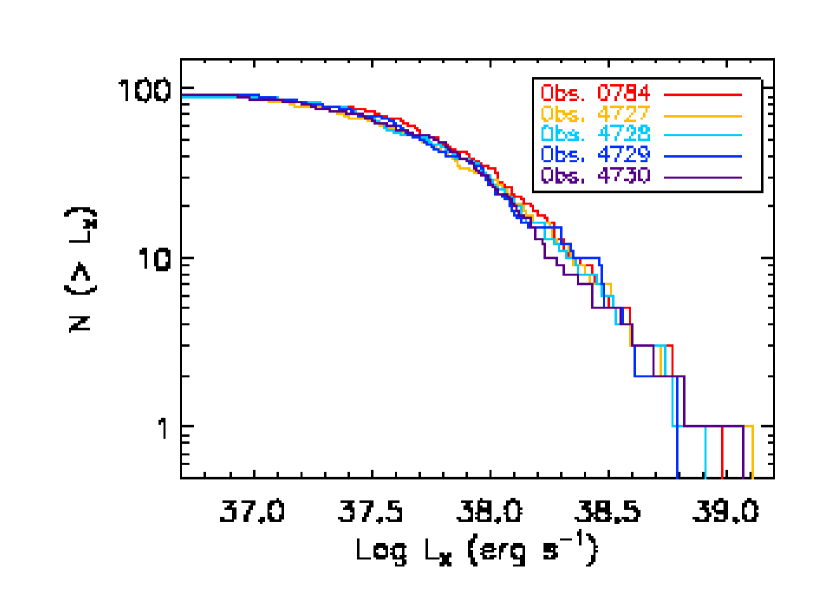
In Figure 7, we display the individual observation LFs of the sources in the Analysis Sample within . We calculate the probability the LFs of each pair of observations are drawn from the same population using the two-sample K-S test. Since range from 0.33 (0784 versus 4727) to 0.94 (4729 versus 4730), we believe that the LFs do not change significantly on our inter-observation timescales, which vary from to .
We combined the luminosities from all of the different observations; as before, we included the effects of varying exposure (including vignetting), the time dependent QE degradation of the ACIS-S3 chip, and the PSF fraction of source counts within the region used to extract the counts. We give this luminosity, combining all five observations, as in Table 6 (column 4).
One can compare to the individual luminosities using to test if the individual values are all consistent with a constant luminosity. In Figure 8, we display the LF of sources with and a probability of being variable. We fit this LF (for 68 sources in the Analysis Sample with ) using the same techniques we have used previously (\al@SIB2000,SIB2001; \al@SIB2000,SIB2001; Blanton et al. 2001; Irwin et al. 2002). Since the average completeness correction factor in the Analysis Sample is only , we do not apply completeness corrections for this fit. We adopted the background LF from Kim et al. (2004); however, we have assumed that background sources exhibit the same level of variability as the LMXBs and reduced the expected background number from 11.7 to 8.2.
We modeled the LMXB populations with a single power law, a cutoff power law, and a broken power law.
| (4a) | |||||
| (4b) | |||||
| (4c) | |||||
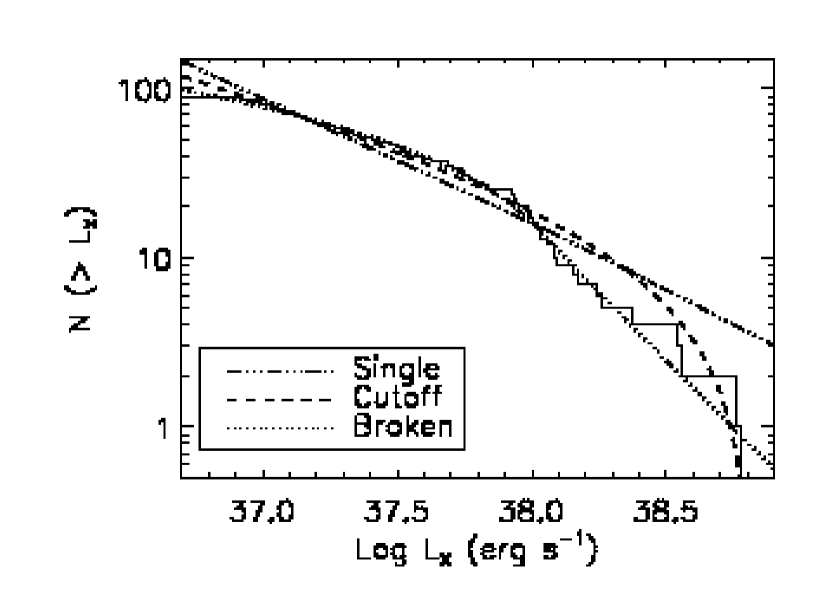
where is the X-ray luminosity in units of . We used the maximum likelihood method to determine the best fits to the cumulative LF and Monte Carlo techniques to determine the errors (90% confidence interval). A K-S test against the cumulative distribution function of our best-fit LF indicated only a 12% chance that the single power law is a proper fit. Much better fits were achieved for a cutoff power-law (10.6 for one less dof) with , , and and for a broken power-law (14.3 for two less dof) with , , , and . Although the broken power-law is the best fit according to , we note that the one-sided K-S test indicated the cutoff power law model was acceptable (at the 50% confidence level). All three fits are overlaid in Figure 8.
Since each of the five observations is an independent measure of the instantaneous LF, there are enough datapoints that one can apply fits of equations 4a–4c to a binned, differential LF using standard techniques. In addition to the five-fold increase in the number of datapoints, this analysis has the advantage of including variable sources and producing a clearer goodness-of-fit test than is provided by the K-S statistic. We chose to combine the luminosities in bins of at least 25 instantaneous luminosities. Since there are five observations, each luminosity added 0.2 to the instantaneous LF. All fits were done for to avoid problems due to incompleteness and less accurate measurements of ; this resulted in 12 bins being used to fit the LFs. For our best fit single, cutoff, and broken power law LFs we found , 14.0, and 4.9 for 10, 9, and 8 dof, which correspond to rejection probabilities of 99.5%, 88%, and 23%. We believe that one of the reasons these rejection probabilities are stronger than for the K-S statistic is that the K-S test is less sensitive at the ends of its distribution. The single power law is strongly rejected. The broken power-law is clearly the best fit, with , , , and ; however, we do not definitively rule out a cutoff power law with , , and (90% confidence intervals). We also checked for effects due to errors in the background LF from Kim et al. (2004) by determining the best-fit LMXB LFs assuming 100 randomized realizations of the background LF. The single power law was rejected at the 98% confidence level for all realizations. For 90% of the realizations, the cutoff power law can be rejected at better than the 85% confidence level (the lowest rejection is at the 70% confidence level). Including these effects would have little impact on our error budget.
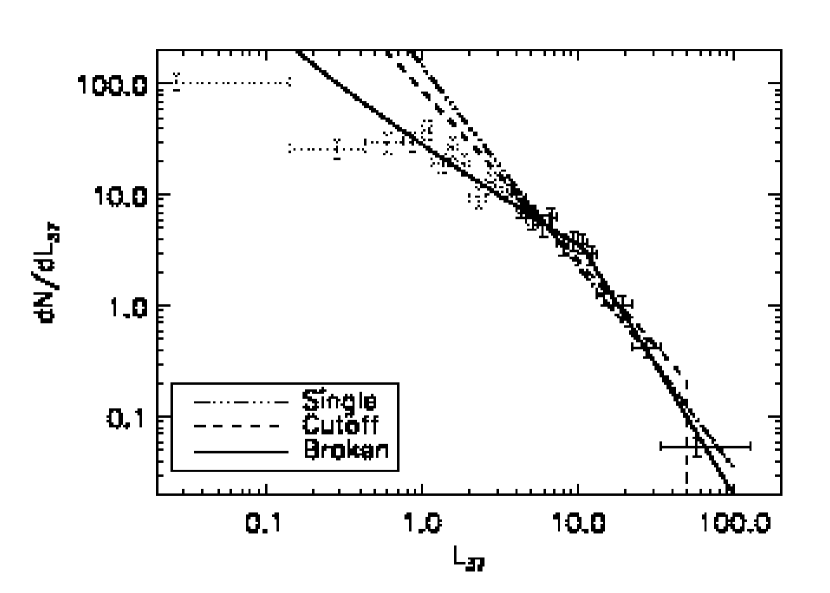
We display the completeness-corrected, instantaneous, differential luminosity function of the five observations for sources detected within in Figure 9. The best-fit single, cutoff, and broken power law LFs derived above are overlaid. The reliability of both the fitted LF and the independent completeness correction factors (above ) are strengthened by the broken power law LF going through many of the low luminosity data-points that were not included in the fitting process.
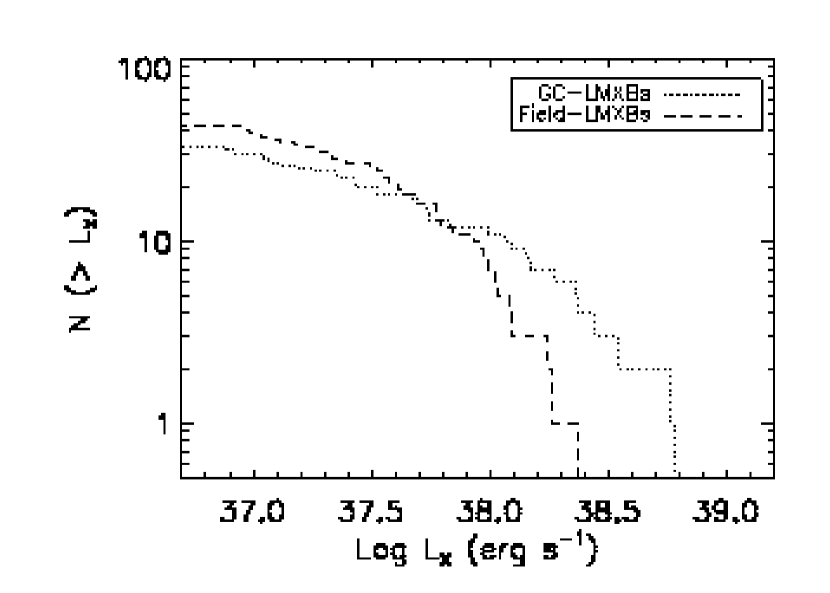
In Figure 10 we have displayed the LFs (using ) of X-ray sources in the HST-ACS FOV that are in GCs (34 GC-LMXBs) and in the field (44 Field-LMXBs). After proper renormalization, the distributions track each other very well when . Above , there are always more GC-LMXBs than Field-LMXBs. A similar result was found by Angelini et al. (2001) in NGC 1399, but was not seen clearly in other samples of early-type galaxies (Kundu et al. 2002; Sarazin et al. 2003; Jordán et al. 2004b). Neither the K-S () nor the Wilcoxon rank-sum test indicate that the two LFs are drawn from a different distribution. On the other hand, we can construct contingency tables, comparing the numbers of Field-LMXBs and GC-LMXBs below and above a given luminosity, and calculate Fisher’s Exact Test probabilities (; Fisher 1922) that indicate 10% chance that the rows and columns are independent. Since probabilities of independence calculated from contingency tables do not take into account the freedom to choose the luminosity used to divide the populations, the luminosity chosen must be physically motivated. If we choose the luminosity corresponding to the Eddington limit for a hydrogen accreting NS (), we find . While this is suggestive of a discrepancy between the LFs, we do not believe the current data clearly indicates a statistically significant difference between LFs of Field-LMXBs and GC-LMXBs.
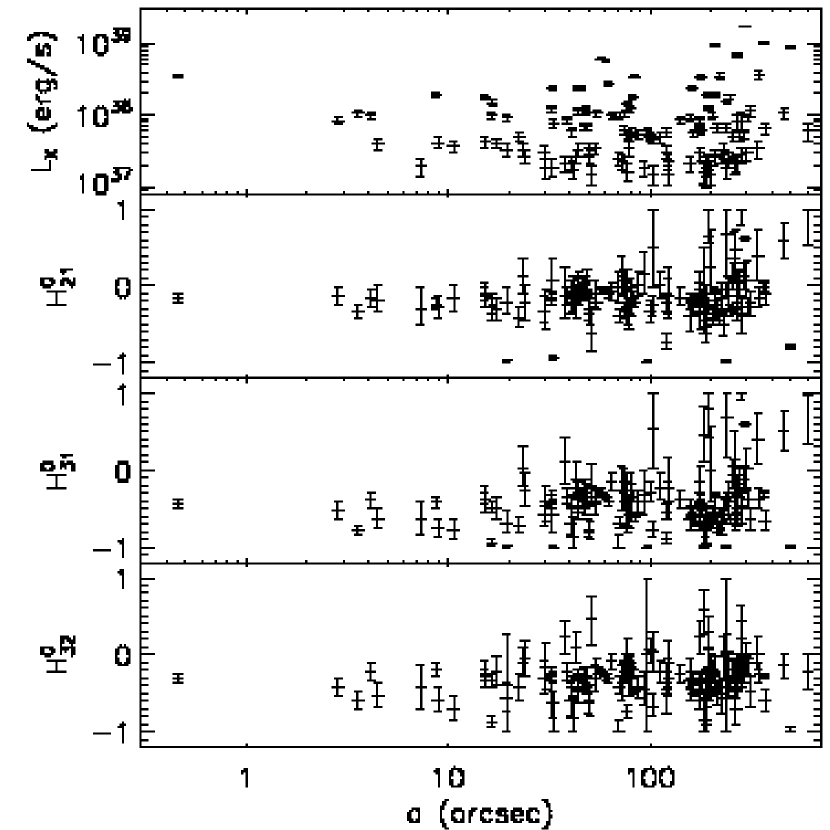
We also searched for any variation of the LF with projected galactocentric distance, using the Spearman’s rank correlation coefficient (hereafter Spearman’s , Spearman 1904), which is a non-parametric test for correlations between two properties. Using both instantaneous and constant luminosities for sources within , as well as constant luminosities over the entire FOV, we found no significant evidence of a correlation between luminosity and spatial position, , for Analysis Sample sources. Similarly, no spatial difference in the constant luminosity of significantly detected sources was indicated by a Wilcoxon rank-sum comparison of two spatial bins, and . We display the luminosities of Analysis Sample sources versus galactocentric semimajor axis in the top frame of Figure 11.
8. Hardness Ratios
The spectral properties of sources can be crudely characterized by hardness ratios or X-ray colors (e.g., \al@SIB2000,SIB2001; \al@SIB2000,SIB2001). We defined hardness ratios of , , and , where , , and are the total counts in the soft (0.3–1 keV), medium (1–2 keV), and hard (2–6 keV) bands (Sivakoff et al. 2004). Hardness ratios without superscripts are the measured values; we use the superscript 0 to indicate the intrinsic hardness ratios, correcting for Galactic absorption and QE degradation in the Chandra ACIS detectors. The counts in each band are corrected assuming the best-fit Chandra X-ray spectrum of the inner resolved sources (: Table 7, row 3). Since the different observations had different QE degradations, we adopted the following technique for correcting the observed counts in a band. Let be the net counts for source in band during observation , and let be the absorption and degradation correction to counts for observation in band . (The QE degradation was assumed to be independent of position on the detector and thus the same for all sources within a given observation.) The combined correction for source in band is given by , where the sums are only performed over observations where . We require that because there is no correction to the source hardness when a source is not emitting at a detectable level. Having determined the appropriate correction, the corrected number of counts for source in band is , where the sum is now over all observations. The corrected band counts are then used to calculate the corrected hardness ratios. We also combined Monte Carlo simulations of the observed counts in the source and background apertures with the count corrections to calculate the confidence intervals for the hardness ratios. (When no counts are observed, we set the expected number of counts in the Monte Carlo simulations to 0.653. This is the average expectation for the Poisson distribution for expected numbers of counts between 0 and 1.841, which are the confidence intervals on a measurement of zero counts.)
X-ray color-color diagrams of the combined intrinsic hardness ratios of the Analysis Sample sources are shown in Figure 12. The values of the hardness ratios and their errors are listed in columns (5)–(7) of Table 6. Harder sources tend to lie in the upper right of Figure 12a. Extra absorption tends to push objects to the right in Figure 12b.
The majority of sources have hardness ratios consistent with power-law indices of 1.2–2.0. On average, these sources tend to lie to the right of the power-law curve, which might indicate some extra absorption is occurring. A few sources occupy very different positions in the hardness ratio planes. Sources 81, 96, 105, 112, 123, 134, 146, 148, 153, and 158 are harder than the typical source in NGC 4697. Both their spectral properties and tendency to occur farther away from the center of NGC 4697 suggest that these very hard sources may be unrelated, strongly absorbed AGNs. Sources 11, 19, 25, 78, 84, 94, 110, 121, and 156 are softer than the typical source in NGC 4697. Sources 84 and 156 both have optical counterparts; the former is an extended object much redder than a typical GC, while the latter is a star. Sources 19, 25, 78, and 110 have little if any emission above 1 keV and are all SSs. Based on its color, Source 150 may be strongly absorbed or have a very atypical spectrum.
As with luminosity, we used the Spearman’s test to search for a correlation between merged hardness ratio and galactocentric semimajor distance, . We display the hardness ratios of Analysis Sample sources versus spatial position in the bottom frames of Figure 11. If we use the entire Analysis Sample, we find , , and significant correlations of , , and , respectively, with distance. In each case, the sense of the correlation is that harder sources are found at larger . These correlation become insignificant () when only sources with are considered. The Wilcoxon rank-sum comparison of and significantly detected sources reproduces the effects seen by the Spearman’s test. However, we believe that the correlation at larger distances is due to the increasing dominance of hard background AGNs, as opposed to LMXBs intrinsic to NGC 4697. Scaling the expected number of sources unrelated to NGC 4697 with the area in each region, we expect 12/97 and 17/29 Analysis Sample sources are unrelated to NGC 4697 for and , respectively.
9. Spectral Analysis
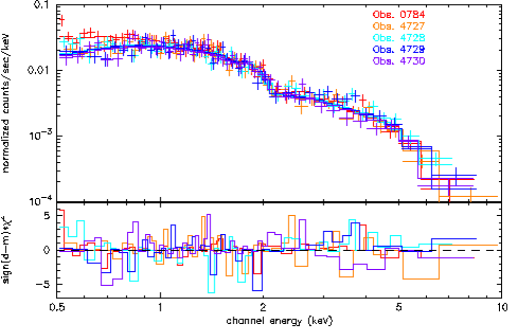
We performed an analysis of the spectra of sources in the – band, extracting the spectra and response files separately for each observation of each source. The background spectra for each source were determined locally, using the same nearby regions as discussed in § 4. Note that the response files for each separate observation and source include the varying effects of absorption by the contaminant which produces the QE degradation in the ACIS detectors. Since the majority of our sources are too faint for spectral analysis, we co-added the spectra and responses of groups of sources for each observation. We only included sources whose total count rate was determined at the level. We also excluded the sources discussed individually in § 9.5 and Source 110 (see Paper V). All of the spectra were grouped to have at least 25 counts per spectral bin prior to background correction to enable our use of statistics. The use of a minimum number of counts per spectral bin and the restricted energy range in the spectrum can result in some excluded bins, although those bins have some photons in the allowed energy range. Unless otherwise noted, the individual observations were required to have the same spectral shape, but their normalizations were allowed to vary.
The spectra of Galactic LMXBs can be complex. High luminosity LMXBs, like those seen in NGC 4697, have often been modeled with multi-component models that may include combinations of an isothermal blackbody, a multi-color disk blackbody, a Comptonized power-law, or more complicated models (White et al. 1995). For our observations, there are two complicating factors. First, we are looking at a collection of sources, each of which is likely to have a somewhat different spectrum. Second, our spectra, even when co-added, have a much lower signal-to-noise ratio than that for a Galactic LMXB. Therefore, we have only attempted to fit simple power-law or bremsstrahlung models to our spectra. We summarize the results of the spectral fits in Table 7. In each row, we list how the sources were grouped together in the second column. In the third column we list the model we used to fit the spectra. In addition to the input model, we accounted for an absorption column () using the Tuebingen-Boulder absorption (tbabs) model assuming abundances from Wilms et al. (2000) and photoelectric absorption cross-sections from Verner et al. (1996). The absorbing column will typically be fixed at the Galactic absorption column (; Dickey & Lockman 1990); however, some fits require non-Galactic absorption. Absorption columns below the Galactic value may indicate extra emission beyond the chosen model at low energies, while absorption columns above the Galactic value may indicate the presence of a local absorber or that the intrinsic spectra at low energies is softer than the model spectra. The value of the absorbing column density () is given in the fourth column. In the fifth column, we list either the temperature (for bremsstrahlung) or photon number spectral index (for a power-law). The sixth through tenth column list the unabsorbed fluxes (0.3–10 keV) of observations 0784, 4727, 4728, 4729, and 4730 respectively. The last two columns give the total number of net counts in each set of spectra and per dof for the best-fit model. All errors reported in the spectral analysis are 90% confidence level errors. Parentheses are used to indicate a frozen parameter, and square brackets are used when an error is unconstrained on one side.
9.1. Best-Fit Spectra of LMXBs
To determine the best-fit spectra for all LMXBs, we considered the spectrum of all significantly detected sources within the elliptical isophote that contains half of the optical light (; Table 7, rows 1–4). Of the four fits to this spectrum, those with bremsstrahlung models (bremss, rows 3 and 4) were significantly better than those with power-law models (power, rows 1 and 2). For one dof, the . We note that the derived power-law photon indices, – are consistent with found by Irwin et al. (2003) for LMXBs in a sample of early-type galaxies. The better fit to a bremsstrahlung model compared to a power-law model has important implications for estimating the unabsorbed flux of a source; the flux conversion for the Galactic-absorbed bremsstrahlung model is lower than that for the Galactic-absorbed power-law model. There is no evidence for a non-Galactic absorbing column in the bremsstrahlung models ( between row 3 and 4). We adopt row 3 (, ) as our best-fit spectra. We believe that calibration changes may account for our spectra being slightly harder than that found by Irwin et al. (2003) (. We display the observed spectra overlaid by the best-fit spectral model in Figure 13. Hereafter, we present results for a bremsstrahlung model with Galactic absorption in different selections of sources. We also present other models (power-law or non-Galactic absorption) when they are statistically better fits.
9.2. Spectra Grouped by Position
In Table 7, rows 3, 4–6, 8 and 9, we compare bremsstrahlung models with Galactic absorption for different collections of sources grouped by position. These results mirror those presented previously based on hardness ratios. When we compare the independent fits of sources within (row 3) and in the annulus (row 5) to the fit when their temperatures are tied together (row 8), we find a for 1 dof. There is no evidence for any spectral variation with galactocentric distance within .
On the other hand, there is evidence for a spectral change for sources within . First, comparing the fit to the spectra when the temperatures within are grouped together (row 9) to the fits when the temperatures can vary (rows 3, 5, and 6) indicates a slightly significant statistical difference ( for 2 dof and the f-test indicates the probability that the free temperature model comes from the tied temperature model is 4.0%). Furthermore, a power-law fit (row 7) for sources is a statistically better fit ( for 0 dof) than a bremsstrahlung fit (row 6). The increasing dominance of background AGN in the spectra of regions further away from the galaxy center is a likely cause for the apparent spatial variation of the spectra. Our flanking-field HST observations will allow us to better address this issue by better identifying background AGN.
9.3. Spectra Grouped by GC Association
We compare bremsstrahlung models in Table 7 rows 10–18 for different collections of sources grouped by their association with GCs in the HST-ACS FOV. Our comparisons of GC-LMXBs, Field-LMXBs, and their combination (rows 10, 12, and 14; rows 11, 13, and 15) indicate that the GC-LMXBs and Field-LMXBs are likely to be fit by different spectrum. When a Galactic absorbing column is used, the for 1 dof and the probability both populations have the same temperature and absorption is . The disparity is even larger if we allow a non-Galactic absorbing column; for 2 dof and the probability they have the same temperature and absorption is .
The best overall fit comes from allowing both GC-LMXBs and Field-LMXBs to have independent absorbing columns and temperatures (rows 11 and 13). The GC-LMXBs are better fit with a harder spectrum and larger absorbing column compared to the Field-LMXBs. Although a larger absorbing column in GC-LMXBs might explain this discrepancy, we note that the absorption column of Field-LMXBs tends be pushed towards sub-Galactic columns. This suggests that the bremsstrahlung model underpredicts the low-energy end of their spectra. A more accurate model and better understanding of low energy calibration issues is required to better probe the cause of the discrepancy in spectra between GC-LMXBs and Field-LMXBs.
In Maccarone et al. (2003), the summed spectra of LMXBs in blue-GCs are found to be harder than the summed spectra for LMXBs in red-GCs. This appears to be best explained by an additional absorbing column in blue-GCs and is attributed to irradiation induced winds. While extra absorption due to winds might explain why our GC-LMXBs have a larger column than Field-LMXBs, we note that our data is not entirely consistent with this scenario. When we compare the fits of spectra of red-GC-LMXBs and blue-GC-LMXBs where they share the same absorbing column and temperature to fits where they have independent absorbing columns and temperatures, we find the for 2 dof and the probability they have the same temperature and absorption is 6.1%. These differences are only marginal at best. Although the blue-GC LMXBs have a harder temperature than red-GC LMXBs, they also have a lower absorbing column that tends towards being sub-Galactic. Our understanding of the spectra of the blue-GC-LMXBs is limited by their relatively small numbers. In addition to a more accurate model and better understanding of low energy calibration issues, the spectra of blue-GC-LMXBs from many galaxies should be combined to improve our statistics.
9.4. Spectra Grouped by Luminosity
In our final grouped spectral fits, we examine the different spectra in two luminosity bins, and , where . Since the brighter sources are above the Eddington limit for a hydrogen accreting NS, they are likely to be either super-Eddington accreting NS-LMXBs or BH-LMXBs. Since we believe AGN may be significantly contaminating the spectra outside of , we restrict our sample to LMXBs interior to that semi-major distance. We note that the brightest X-ray source in this spatial region (Source 58) has .
Comparing the fainter LMXBs, the brighter LMXBs, and their combination (rows 19, 21, and 23; rows 20, 22, and 24) indicates that the fainter and brighter LMXBs are likely to have different spectra. Separate spectra improve the fit by , and the probability both populations have the same temperature and Galactic absorption is . Again, the disparity is larger if the groups are allowed to have different absorbing columns; the for 2 dof and the probability both populations have the same temperature and absorption is . The best-fit comes from allowing faint LMXBs and bright LMXBs to have different temperatures and absorbing columns. Both populations tend to have the same temperature (). The fainter LMXBs tend to have smaller (mostly sub-Galactic) absorbing columns, while the brighter LMXBs tend to have a small excess absorption column (), perhaps of local origin. If some fraction of the mass transferred to the compact object is not accreted and ends up acting as a source of absorption, the larger rate of accretion in brighter sources might account for the extra absorption column.
9.5. Individual Source Spectra
We can also explore the individual spectra of several sources. Although we mainly consider sources with , we also discuss the spectrum of the central source (Source 1). The spectra were extracted in the identical manner as the grouped spectra above. For these fits, the errors in fluxes and luminosities are only the scaled errors in the count rates from the spectral fitting process. The spectrum of the variable transient Source 110 is discussed in detail in Paper V.
Source 1: The central source in NGC 4697 could be a central AGN, an LMXB, or a collection of confused LMXBs. Although the source is not particularly bright (spectral fits made to 343.9 total net counts), we extracted its individual spectra. The source is best fit by a power-law with Galactic absorption ( for 8 dof). The weighted unabsorbed luminosity at NGC 4697 for this spectra, , is 12% higher than that derived from the best-fit spectral shape for sources within , which is consistent with the difference between power-law and bremsstrahlung models. As this spectral fit is completely consistent with either a central AGN having a low absorbing column or an LMXB (or several LMXBs), the nature of Source 1 is still unknown.
Source 117: This source is known to be an AGN at (Paper II). The total net counts fit by spectra for this source was 993.3, but there was a large variance between observations. (We fit to 49.3 net counts in Observation 4729 and 280.0 in Observation 4730.) As we discuss in Paper V, the spectral state of this source in Observation 4729 appears to differ from that in the other observations. We accounted for this by allowing Observation 4729 to have a different absorption than the other observations. The best-fit spectra ( for 31 dof) involved absorbed power-law () models. Observation 4729 had a much larger absorbing column () than the other observations (). This fits implies absorbed 0.5– X-ray luminosities of , respectively, for Observations 0784, and 4727–4730.
Source 134: Source 134 is the brightest X-ray source in our observations and has 1973.3 net counts in its spectrum. Its hardness ratios, which vary between observations (see Paper V) indicate it is harder than a typical LMXB. Its spectra are best-fit ( for 65 dof) by a power-law model (). Each observation has a different absorbing column: and , respectively, for Observations 0784, and 4727-4730. If Source 134 is at the distance of NGC 4697, its unabsorbed 0.3– X-ray luminosities are then . In this case, Source 134 would be a heavily absorbed ULX. However, we believe it is more likely that this source is a background AGN with absorbed 0.5– X-ray fluxes of .
Source 143: This source appears to have an uncatalogued DSS counterpart. Although the X-ray source is bright, Source 143 only has enough counts for spectral fitting in Observation 4730 (150.4 net counts). The best-fit model ( for 4 dof) is a Galactic-absorbed power-law (). Its absorbed 0.5– X-ray flux is . Its unabsorbed 0.3– X-ray luminosity at the distance of NGC 4697 is for this spectral model.
Source 155: Like Source 143, Source 155 appears to have an uncatalogued DSS counterpart. We fit spectra to 621.8 net X-ray counts from Observations 4727-4729. Although we tried power-law, bremsstrahlung, disk blackbody, and gas models (apec), none of these spectra gave a good fit. The Galactic-absorbed power-law () was the best fit we found ( for 21 dof), with the model tending to underpredict emission below . This spectral model implies absorbed 0.5– X-ray fluxes of , respectively for Observations 4727-4729. The unabsorbed 0.3– X-ray luminosities at the distance of NGC 4697 are , respectively.
Source 156: This source is clearly associated with the bright foreground star BD-05 3573 (catalog ), whose optical colors are roughly consistent with an early to middle G type star. Its effective temperature is (Gondoin 1999). Based on its optical magnitude, the distance to the star is likely to be – , for dwarf to giant luminosity classes, respectively. In the three observations during which it is in our FOV (Observations 4727-4729), the spectrum contains 563.5 net counts. Among likely, simple stellar models of X-ray emission, we find the emission spectrum from collisionally-ionized diffuse gas (apec) model that has and a heavy element abundance of solar fits best. The temperature, , is reasonable for that of an X-ray corona. While the 0.3– X-ray fluxes are , the bolometric flux is higher. We note that the X-ray luminosities expected at the distance of a giant G star are consistent with those of other K and G giant stars with (Gondoin 1999). One class of giant stars, FK Comae stars, are rapidly rotating chromospherically active stars. Such activity might explain the X-ray flaring (see Paper V) observed in this source. Follow-up optical spectroscopy is necessary to determine the spectral type and rotation speed of BD-05 3573 (catalog ) and to test whether it is an FK Comae star.
10. Conclusions
Multi-epoch Chandra observations reveal a wealth of information on LMXBs in NGC 4697, the nearest optically luminous elliptical galaxy. We detect 158 sources, 126 of which have their count rates determined at . Ten sources have optical counterparts in ground-based catalogs, including a known AGN (Source 117) and the foreground star BD-05 3573 (catalog ) (Source 156). With our Hubble observations of the galaxy center, we find 36 additional optical counterparts. Most importantly, we identify 34 LMXBs clearly associated with GCs.
We confirm that GCs that are optically brighter () and redder () are more likely to contain GCs. We find that GCs with larger encounter rates are also more likely to contain GCs (). When we fit the expected number () of LMXBs in a GC, we find , where is the encounter rate and is the metallicity of the GC. Our results agree well with those found for fainter X-ray sources in Galactic GCs (Pooley et al. 2003) and LMXBs in M87 (Jordán et al. 2004b). These results are also consistent with S2007; however, our NGC 4697 data set is included in that analysis.
We detect sources with X-ray luminosities . The fraction of LMXBs associated with GCs, , is and does not appear to depend on X-ray luminosity. We find of GCs contain an LMXB at the detection limit, although we note that it is likely that the percentage of GCs with an active LMXB is even higher due to the X-ray flux limit of the current observations. Furthermore, our X-ray detections are not complete at the detection limit. At the luminosity limit of our Analysis Sample (), which is complete, of GCs contain an LMXB. This is the third deepest probe of the GC/LMXB connection in an early-type galaxy to date. [At , fainter luminosities can be more easily reached with Cen A (catalog ); however, studies of the GC-LMXB connection in Cen A are made more difficult by its larger angular extent on the sky and recent star-formation (Israel 1998)]. Deep observations of NGC 3379 probe deeper in luminosity; however, only nine of its GCs contain LMXBs.] At this same limit, there have been two () Galactic GCs containing LMXBs (NGC 6440 and NGC 6624) over the history of X-ray astronomy. The discrepancy between the Milky Way and NGC 4697 may be explained by their different GC metallicity distributions (a 3:1 metal-poor to metal rich ratio for Galactic GCs as compared to a 1:1 ratio for NGC 4697 GCs). Since metal-rich GCs () are about 3 times as likely to contain LMXBs, NGC 4697 is predicted to have about twice the percentage of GCs with LMXBs as the Milky Way. This correction eliminates most of the discrepancy between the two galaxies.
We have determined the X-ray luminosity functions from each individual observation, from the combination of our five observations, and the LF of the non-variable sources. There is no statistically significant difference in the LFs of the different observations. This result is critical because it validates using single-epoch observations to measure LFs. While we clearly rule out a single power-law LF, we cannot definitively rule out cutoff power-law models with slopes of and cutoff luminosities of . Broken power-law models (eq. [4c]) provide the best fits to our LFs. We adopt our fit of the instantaneous LF as our best-fit, with , , , and . We note that Kim & Fabbiano (2004) found evidence for a possible break in the LF of LMXBs in early-type galaxies at slightly larger luminosities; however recent deep observations of NGC 3379 and NGC 4278 have not found strong evidence for such a break (Kim et al. 2006a). This raises the possibility that there is no universal form for the LF of LMXBs in early-type galaxies.
We find marginal evidence (significant at the level) that a larger number of LMXBs above the Eddington limit for a hydrogen accreting NS tend to be found in GCs than in the field. Although this is consistent with results in Angelini et al. (2001) in NGC 1399, we believe this result needs to be tested with a larger sample. One possible (e.g., Kundu et al. 2007) explanation is that multiple LMXBs might exist in some GCs. We predict that this effect is small, only of the GCs are expected to have multiple LMXBs with total X-ray luminosity above , which corresponds to of the GCs above that X-ray luminosity. An alternative explanation is that any possible discrepancy in the LFs occurs at lower luminosities. Such discrepancies have been seen for the bulge of M31 and the Milky Way (Voss & Gilfanov 2007) and the elliptical galaxy NGC 3379 (Fabbiano et al. 2008); however, this effect is most evident at luminosities below those probed by our observations of NGC 4697.
Our spectrum of sources in the inner effective semi-major axis is best-fit by bremsstrahlung emission with Galactic absorption (, ). Both hardness ratios and spectral analysis indicate that the spectra of X-ray sources at large radii () differ from those at small radii. We believe that this effect is due to an increasing dominance of unrelated foreground and background sources, particularly background AGNs. The spectra of GC-LMXBs and Field-LMXBs appear to differ (significant at the level). The GC-LMXBs are better fit with higher temperatures and greater absorbing columns compared to the Field-LMXBs. Similarly, we find a difference (significant at the level) between X-ray fainter and brighter LMXBs. The fainter LMXBs tend to have smaller absorbing columns, while the brighter LMXBs tend to have a small excess in absorption, which may be due to having more accreting material. We find that spectra of LMXBs in metal-poor GCs have harder temperature and lower absorbing columns than those in metal-rich GCs; however, this marginal result is only significant at the level. In all cases, the sources with a smaller absorption column tend to be fit with sub-Galactic absorbing columns. This indicates that the spectral model (folded in with the calibration) underpredicts the soft emission in the spectra. To probe the cause of the spectral differences, we require a more physically accurate model and better understanding of the calibration at low energies.
Among the spectral fits to individual bright sources, Source 117 (a known AGN) and Source 134 had spectral fits with large absorbing columns. We predict Source 134 is likely to be an AGN. The spectral fit and variability in Source 156 (the foreground star BD-05 3573 (catalog )) are consistent with it being an FK Comae star, a chromospherically active giant.
References
- Angelini et al. (2001) Angelini, L., Loewenstein, M., & Mushotzky, R. F. 2001, ApJ, 557, L35
- Bildsten & Deloye (2004) Bildsten, L., & Deloye, C. J. 2004, ApJ, 607, L119
- Blanton et al. (2001) Blanton, E. L., Sarazin, C. L., & Irwin, J. A. 2001, ApJ, 552, 106
- de Vaucouleurs et al. (1992) de Vaucouleurs, G., de Vaucouleurs, A., Corwin, H. G., Buta, R. J., Paturel, G., & Fouque, P. 1992, Third Reference Catalogue of Bright Galaxies (RC3)
- Dickey & Lockman (1990) Dickey, J. M., & Lockman, F. J. 1990, ARA&A, 28, 215
- Fabbiano et al. (2008) Fabbiano, G., Brassington, N. J., Zezas, A., Zepf, s., Angelini, L., Davies, R. L., Gallagher, J., Kalogera, V., Kim, D. ., King, A. R., Kundu, A., Pellegrini, S., & Trinchieri, G. 2008, arXiv:0710.5126
- Fabbiano et al. (1994) Fabbiano, G., Kim, D.-W., & Trinchieri, G. 1994, ApJ, 429, 94
- Fisher (1922) Fisher, R. A. 1922, Jnl. Royal. Stat. Soc., 85, 87
- Ford et al. (1998) Ford, H. C., et al. 1998, in Presented at the Society of Photo-Optical Instrumentation Engineers (SPIE) Conference, Vol. 3356, Proc. SPIE Vol. 3356, p. 234-248, Space Telescopes and Instruments V, Pierre Y. Bely; James B. Breckinridge; Eds., ed. P. Y. Bely & J. B. Breckinridge, 234–248
- Forman et al. (1985) Forman, W., Jones, C., & Tucker, W. 1985, ApJ, 293, 102
- Gehrels (1986) Gehrels, N. 1986, ApJ, 303, 336
- Gondoin (1999) Gondoin, P. 1999, A&A, 352, 217
- Hanes (1977) Hanes, D. A. 1977, MmRAS, 84, 45
- Høg et al. (2000) Høg, E., et al. 2000, A&A, 355, L27
- Irwin (2005) Irwin, J. A. 2005, ApJ, 631
- Irwin et al. (2003) Irwin, J. A., Athey, A. E., & Bregman, J. N. 2003, ApJ, 587, 356
- Irwin et al. (2004) Irwin, J. A., Bregman, J. N., & Athey, A. E. 2004, ApJ, 601, L143
- Irwin et al. (2000) Irwin, J. A., Sarazin, C. L., & Bregman, J. N. 2000, ApJ, 544, 293, I2000
- Irwin et al. (2002) —. 2002, ApJ, 570, 152
- Israel (1998) Israel, F. P. 1998, A&A Rev., 8, 237
- Jeltema et al. (2003) Jeltema, T. E., Canizares, C. R., Buote, D. A., & Garmire, G. P. 2003, ApJ, 585, 756
- Jordán et al. (2004a) Jordán, A., et al. 2004a, ApJS, 154, 509
- Jordán et al. (2004b) —. 2004b, ApJ, 613, 279, J2004
- Jordán et al. (2005) —. 2005, ApJ, 634, 1002
- Jordán (2004) Jordán, A. 2004, ApJ, 613, L117
- Jordán et al. (2007) Jordán, A., Sivakoff, G. R., McLaughlin, D. E., Blakeslee, J. P., Evans, D. A., Kraft, R. P., Hardcastle, M. J., Peng, E. W., Côté, P., Croston, J. H., Juett, A. M., Minniti, D., Raychaudhury, S., Sarazin, C. L., Worrall, D. M., Harris, W. E., Woodley, K. A., Birkinshaw, M., Brassington, N. J., Forman, W. R., Jones, C., & Murray, S. S. 2007, ApJ, 671, L117
- Juett (2005) Juett, A. M. 2005, ApJ, 621, L25
- Kim & Fabbiano (2003) Kim, D., & Fabbiano, G. 2003, ApJ, 586, 826
- Kim & Fabbiano (2004) Kim, D.-W., & Fabbiano, G. 2004, ApJ, 611, 846
- Kim et al. (1996) Kim, D.-W., Fabbiano, G., Matsumoto, H., Koyama, K., & Trinchieri, G. 1996, ApJ, 468, 175
- Kim et al. (1992) Kim, D.-W., Fabbiano, G., & Trinchieri, G. 1992, ApJ, 393, 134
- Kim et al. (2004) Kim, D.-W., et al. 2004, ApJ, 600, 59
- Kim et al. (2006a) —. 2006a, ApJ, 652, 1090
- Kim et al. (2006b) Kim, E., Kim, D.-W., Fabbiano, G., Lee, M. G., Park, H. S., Geisler, D., & Dirsch, B. 2006b, ApJ, 647, 276
- King (1966) King, I. R. 1966, AJ, 71, 64
- Kundu et al. (2002) Kundu, A., Maccarone, T. J., & Zepf, S. E. 2002, ApJ, 574, L5
- Kundu et al. (2007) —. 2007, ApJ, 662, 525
- Kundu et al. (2003) Kundu, A., Maccarone, T. J., Zepf, S. E., & Puzia, T. H. 2003, ApJ, 589, L81
- Kundu & Whitmore (2001) Kundu, A., & Whitmore, B. C. 2001, AJ, 121, 2950
- Larsen & Brodie (2003) Larsen, S. S., & Brodie, J. P. 2003, ApJ, 593, 340
- Maccarone et al. (2003) Maccarone, T. J., Kundu, A., & Zepf, S. E. 2003, ApJ, 586, 814
- Maccarone et al. (2007) Maccarone, T. J., Kundu, A., Zepf, S. E., & Rhode, K. L. 2007, Nature, 445, 183
- Mann & Whitney (1947) Mann, H. B., & Whitney, D. R. 1947, Ann. Math. Stat., 18, 50
- Matsumoto et al. (1997) Matsumoto, H., Koyama, K., Awaki, H., Tsuru, T., Loewenstein, M., & Matsushita, K. 1997, ApJ, 482, 133
- Monet et al. (2003) Monet, D. G., et al. 2003, AJ, 125, 984
- Peletier et al. (1990) Peletier, R. F., Davies, R. L., Illingworth, G. D., Davis, L. E., & Cawson, M. 1990, AJ, 100, 1091
- Pellegrini (1994) Pellegrini, S. 1994, A&A, 292, 395
- Peng et al. (2006) Peng, E. W., et al. 2006, ApJ, 639, 95
- Pooley et al. (2003) Pooley, D., et al. 2003, ApJ, 591, L131
- Postnov & Kuranov (2005) Postnov, K. A., & Kuranov, A. G. 2005, Astronomy Letters, 31, 7
- Sarazin et al. (2000) Sarazin, C. L., Irwin, J. A., & Bregman, J. N. 2000, ApJ, 544, L101, Paper I
- Sarazin et al. (2001) —. 2001, ApJ, 556, 533, Paper II
- Sarazin et al. (2003) Sarazin, C. L., Kundu, A., Irwin, J. A., Sivakoff, G. R., Blanton, E. L., & Randall, S. W. 2003, ApJ, 595, 743
- Sivakoff et al. (2004) Sivakoff, G. R., Sarazin, C. L., & Carlin, J. L. 2004, ApJ, 617, 262
- Sivakoff et al. (2007) Sivakoff, G. R., et al. 2007, ApJ, 660, 1246, S2007
- Skrutskie et al. (2006) Skrutskie, M. F., et al. 2006, AJ, 131, 1163
- Spearman (1904) Spearman, C. 1904, The American Journal of Psychology, 15, 72
- Spitler et al. (2006) Spitler, L. R., Larsen, S. S., Strader, J., Brodie, J. P., Forbes, D. A., & Beasley, M. A. 2006, AJ, 132, 1593
- Swartz et al. (2002) Swartz, D. A., Ghosh, K. K., Suleimanov, V., Tennant, A. F., & Wu, K. 2002, ApJ, 574, 382
- Verner et al. (1996) Verner, D. A., Ferland, G. J., Korista, K. T., & Yakovlev, D. G. 1996, ApJ, 465, 487
- Voss & Gilfanov (2006) Voss, R., & Gilfanov, M. 2006, A&A, 447, 71
- Voss & Gilfanov (2007) —. 2007, A&A, 468, 49
- White & Angelini (2001) White, N. E., & Angelini, L. 2001, ApJ, 561, L101
- White et al. (1995) White, N. E., Nagase, F., & Parmar, A. N. 1995, in X-ray Binaries, ed. W. H. G. Lewin, J. van Paradijs, & E. P. J. van den Heuvel (Cambridge, MA: Cambridge University Press), 1
- White et al. (2002) White, R. E., Sarazin, C. L., & Kulkarni, S. R. 2002, ApJ, 571, L23
- Wilms et al. (2000) Wilms, J., Allen, A., & McCray, R. 2000, ApJ, 542, 914
| Source | R.A. | Dec. | Count Rate | Paper II | ||||||
|---|---|---|---|---|---|---|---|---|---|---|
| No. | Name | (h m s) | ( ) | () | () | ( s-1) | S/N | Source | Notes | |
| (1) | (2) | (3) | (4) | (5) | (6) | (7) | (8) | (9) | (10) | (11) |
| 1 | CXOU J124835.8054802 | 12 48 35.86 | 05 48 02.7 | 0.45 | 0.46 | 25.571.26 | 20.24 | 1.00 | 1 | c |
| 2 | CXOU J124836.0054803 | 12 48 36.03 | 05 48 03.3 | 2.26 | 2.84 | 5.580.63 | 8.86 | 1.00 | 2 | a |
| 3 | CXOU J124835.8054759 | 12 48 35.81 | 05 47 59.9 | 2.89 | 4.47 | 2.770.50 | 5.57 | 1.00 | ||
| 4 | CXOU J124835.6054804 | 12 48 35.68 | 05 48 04.1 | 3.53 | 3.56 | 7.600.75 | 10.16 | 1.00 | 3 | |
| 5 | CXOU J124836.1054802 | 12 48 36.15 | 05 48 02.1 | 3.96 | 4.12 | 6.730.68 | 9.91 | 1.00 | 4 | a |
| 6 | CXOU J124835.6054757 | 12 48 35.65 | 05 47 57.8 | 5.88 | 8.87 | 2.950.50 | 5.93 | 1.00 | 5 | |
| 7 | CXOU J124835.9054756 | 12 48 35.96 | 05 47 56.5 | 6.07 | 8.69 | 13.340.93 | 14.40 | 1.00 | 6 | |
| 8 | CXOU J124836.2054758 | 12 48 36.29 | 05 47 58.7 | 7.07 | 7.29 | 1.390.40 | 3.53 | 1.04 | b,f | |
| 9 | CXOU J124836.5054801 | 12 48 36.56 | 05 48 01.8 | 10.06 | 10.59 | 2.660.49 | 5.47 | 1.00 | 7?,10? | |
| 10 | CXOU J124835.9054752 | 12 48 35.90 | 05 47 52.3 | 10.19 | 15.18 | 13.080.94 | 13.98 | 1.00 | 8 | |
| 11 | CXOU J124835.3054754 | 12 48 35.37 | 05 47 54.6 | 11.16 | 16.37 | 7.090.70 | 10.09 | 1.00 | 9 | |
| 12 | CXOU J124836.3054812 | 12 48 36.30 | 05 48 12.0 | 11.36 | 17.33 | 2.930.50 | 5.91 | 1.00 | 11 | |
| 13 | CXOU J124835.1054811 | 12 48 35.14 | 05 48 11.2 | 14.26 | 15.16 | 3.040.50 | 6.04 | 1.00 | 12 | |
| 14 | CXOU J124836.2054816 | 12 48 36.22 | 05 48 16.1 | 14.49 | 22.43 | 3.520.52 | 6.71 | 1.00 | 13 | |
| 15 | CXOU J124836.9054801 | 12 48 36.95 | 05 48 01.1 | 15.84 | 16.55 | 10.620.84 | 12.71 | 1.00 | 14 | d |
| 16 | CXOU J124836.9054810 | 12 48 36.92 | 05 48 10.8 | 17.49 | 23.34 | 2.370.47 | 5.01 | 1.00 | 15 | |
| 17 | CXOU J124834.7054806 | 12 48 34.74 | 05 48 06.6 | 17.60 | 17.75 | 0.940.33 | 2.84 | 1.16 | ||
| 18 | CXOU J124835.4054745 | 12 48 35.47 | 05 47 45.2 | 18.40 | 28.48 | 0.590.27 | 2.19 | 2.74 | ||
| 19 | CXOU J124837.1054759 | 12 48 37.15 | 05 47 59.1 | 19.14 | 19.52 | 6.620.68 | 9.77 | 1.00 | 16 | |
| 20 | CXOU J124837.0054753 | 12 48 37.03 | 05 47 53.6 | 19.14 | 19.38 | 2.330.45 | 5.19 | 1.00 | 17 | |
| 21 | CXOU J124835.7054742 | 12 48 35.77 | 05 47 42.1 | 20.50 | 31.12 | 0.590.29 | 2.05 | 2.34 | ||
| 22 | CXOU J124834.5054759 | 12 48 34.51 | 05 47 59.4 | 20.84 | 23.96 | 1.890.42 | 4.53 | 1.00 | 18 | b |
| 23 | CXOU J124836.8054817 | 12 48 36.89 | 05 48 17.2 | 20.92 | 30.57 | 0.650.29 | 2.20 | 2.11 | ||
| 24 | CXOU J124834.6054814 | 12 48 34.67 | 05 48 14.8 | 21.91 | 22.79 | 0.780.33 | 2.35 | 1.37 | ||
| 25 | CXOU J124834.5054749 | 12 48 34.52 | 05 47 49.5 | 24.18 | 33.14 | 5.440.62 | 8.83 | 1.00 | 19 | |
| 26 | CXOU J124837.3054749 | 12 48 37.36 | 05 47 49.7 | 25.36 | 25.91 | 0.550.31 | 1.76 | 3.20 | ||
| 27 | CXOU J124834.4054820 | 12 48 34.48 | 05 48 20.3 | 27.57 | 29.79 | 2.180.44 | 4.98 | 1.00 | ||
| 28 | CXOU J124837.7054801 | 12 48 37.79 | 05 48 01.8 | 28.31 | 30.25 | 1.310.37 | 3.50 | 1.01 | 21 | |
| 29 | CXOU J124837.7054806 | 12 48 37.77 | 05 48 06.5 | 28.38 | 32.50 | 8.760.77 | 11.42 | 1.00 | 20 | |
| 30 | CXOU J124836.0054732 | 12 48 36.07 | 05 47 32.4 | 30.24 | 44.27 | 2.360.44 | 5.41 | 1.00 | 23 | |
| 31 | CXOU J124837.5054743 | 12 48 37.50 | 05 47 43.5 | 30.61 | 32.68 | 16.521.02 | 16.21 | 1.00 | 24 | |
| 32 | CXOU J124834.4054740 | 12 48 34.48 | 05 47 40.1 | 30.75 | 45.38 | 16.911.03 | 16.44 | 1.00 | 22 | |
| 33 | CXOU J124835.0054831 | 12 48 35.03 | 05 48 31.0 | 31.27 | 40.96 | 0.650.30 | 2.13 | 1.84 | ||
| 34 | CXOU J124836.0054833 | 12 48 36.08 | 05 48 33.6 | 31.28 | 47.50 | 4.830.61 | 7.91 | 1.00 | 25 | |
| 35 | CXOU J124835.3054732 | 12 48 35.30 | 05 47 32.5 | 31.30 | 48.40 | 7.690.71 | 10.77 | 1.00 | 26 | |
| 36 | CXOU J124833.9054815 | 12 48 33.97 | 05 48 15.8 | 31.62 | 31.77 | 0.620.28 | 2.19 | 1.96 | ||
| 37 | CXOU J124833.8054751 | 12 48 33.87 | 05 47 51.4 | 32.08 | 40.35 | 1.470.37 | 3.98 | 1.00 | ||
| 38 | CXOU J124833.7054810 | 12 48 33.78 | 05 48 10.7 | 32.57 | 32.78 | 1.320.37 | 3.58 | 1.01 | ||
| 39 | CXOU J124836.7054731 | 12 48 36.71 | 05 47 31.8 | 32.98 | 44.00 | 16.841.02 | 16.45 | 1.00 | 27 | |
| 40 | CXOU J124837.1054830 | 12 48 37.13 | 05 48 30.4 | 33.48 | 50.99 | 1.070.33 | 3.21 | 1.04 | ||
| 41 | CXOU J124836.9054732 | 12 48 36.95 | 05 47 32.7 | 33.73 | 43.05 | 1.920.40 | 4.84 | 1.00 | ||
| 42 | CXOU J124834.3054734 | 12 48 34.34 | 05 47 34.5 | 36.37 | 54.44 | 7.530.71 | 10.64 | 1.00 | 28 | |
| 43 | CXOU J124834.3054831 | 12 48 34.34 | 05 48 31.2 | 36.92 | 43.24 | 0.480.25 | 1.89 | 3.51 | ||
| 44 | CXOU J124833.7054820 | 12 48 33.74 | 05 48 20.9 | 36.96 | 37.70 | 1.520.37 | 4.06 | 1.00 | ||
| 45 | CXOU J124833.3054802 | 12 48 33.33 | 05 48 02.3 | 38.22 | 41.29 | 1.230.34 | 3.60 | 1.00 | 29 | |
| 46 | CXOU J124838.2054747 | 12 48 38.28 | 05 47 47.5 | 38.64 | 38.71 | 6.140.66 | 9.33 | 1.00 | 30 | |
| 47 | CXOU J124834.6054727 | 12 48 34.64 | 05 47 27.3 | 39.87 | 61.37 | 0.830.30 | 2.73 | 1.17 | ||
| 48 | CXOU J124833.3054816 | 12 48 33.31 | 05 48 16.4 | 41.01 | 41.02 | 4.190.57 | 7.30 | 1.00 | 31 | |
| 49 | CXOU J124837.7054731 | 12 48 37.78 | 05 47 31.7 | 41.74 | 47.56 | 7.630.71 | 10.73 | 1.00 | 32 | a |
| 50 | CXOU J124837.7054729 | 12 48 37.70 | 05 47 29.3 | 42.79 | 50.04 | 1.690.38 | 4.48 | 1.04 | 34 | a |
| 51 | CXOU J124833.9054834 | 12 48 33.93 | 05 48 34.6 | 43.45 | 49.54 | 2.370.46 | 5.22 | 1.00 | 33 | |
| 52 | CXOU J124838.6054746 | 12 48 38.65 | 05 47 46.9 | 44.09 | 44.10 | 8.190.73 | 11.14 | 1.00 | 35 | |
| 53 | CXOU J124836.6054846 | 12 48 36.67 | 05 48 46.2 | 45.21 | 69.83 | 1.740.39 | 4.45 | 1.01 | ||
| 54 | CXOU J124833.1054741 | 12 48 33.19 | 05 47 41.9 | 45.29 | 59.87 | 41.021.57 | 26.18 | 1.00 | 36 | |
| 55 | CXOU J124836.4054847 | 12 48 36.47 | 05 48 47.4 | 45.77 | 70.33 | 6.820.68 | 9.99 | 1.00 | 37 | f |
| 56 | CXOU J124838.1054728 | 12 48 38.18 | 05 47 28.9 | 47.92 | 53.35 | 2.510.45 | 5.55 | 1.00 | 38 | |
| 57 | CXOU J124839.0054750 | 12 48 39.02 | 05 47 50.1 | 48.36 | 48.63 | 4.910.60 | 8.24 | 1.00 | 39 | |
| 58 | CXOU J124839.3054807 | 12 48 39.31 | 05 48 07.3 | 51.18 | 57.36 | 42.631.59 | 26.79 | 1.00 | 40 | |
| 59 | CXOU J124835.0054856 | 12 48 35.06 | 05 48 56.0 | 54.89 | 77.25 | 1.150.34 | 3.45 | 1.08 | ||
| 60 | CXOU J124833.6054849 | 12 48 33.60 | 05 48 49.4 | 58.05 | 69.50 | 0.410.26 | 1.58 | 5.41 | ||
| 61 | CXOU J124834.9054859 | 12 48 34.91 | 05 48 59.4 | 58.75 | 82.02 | 12.410.90 | 13.78 | 1.00 | 41 | |
| 62 | CXOU J124835.0054704 | 12 48 35.00 | 05 47 04.7 | 59.35 | 91.47 | 0.690.28 | 2.48 | 1.27 | ||
| 63 | CXOU J124839.3054730 | 12 48 39.33 | 05 47 30.5 | 60.47 | 62.26 | 19.811.12 | 17.62 | 1.00 | 42 | |
| 64 | CXOU J124839.7054741 | 12 48 39.75 | 05 47 41.2 | 61.33 | 61.33 | 0.770.30 | 2.54 | 1.98 | ||
| 65 | CXOU J124840.0054800 | 12 48 40.06 | 05 48 00.2 | 62.29 | 66.25 | 0.790.29 | 2.75 | 1.22 | ||
| 66 | CXOU J124839.9054738 | 12 48 39.90 | 05 47 38.3 | 64.56 | 64.62 | 7.050.70 | 10.10 | 1.00 | 43 | |
| 67 | CXOU J124838.8054714 | 12 48 38.82 | 05 47 14.5 | 64.93 | 74.08 | 4.410.57 | 7.78 | 1.00 | ||
| 68 | CXOU J124839.0054714 | 12 48 39.01 | 05 47 14.5 | 66.84 | 75.22 | 7.630.73 | 10.52 | 1.00 | 44 | |
| 69 | CXOU J124832.6054851 | 12 48 32.63 | 05 48 51.2 | 68.83 | 76.93 | 10.080.83 | 12.12 | 1.00 | 45 | |
| 70 | CXOU J124831.8054838 | 12 48 31.83 | 05 48 38.6 | 70.59 | 72.28 | 1.570.39 | 4.07 | 1.00 | 46 | |
| 71 | CXOU J124837.8054652 | 12 48 37.85 | 05 46 52.9 | 75.55 | 99.97 | 3.640.53 | 6.90 | 1.00 | 48 | |
| 72 | CXOU J124831.6054844 | 12 48 31.66 | 05 48 44.4 | 75.79 | 78.65 | 1.360.34 | 4.03 | 1.95 | a | |
| 73 | CXOU J124831.7054846 | 12 48 31.71 | 05 48 46.7 | 76.49 | 80.13 | 4.770.57 | 8.30 | 1.00 | 47 | a |
| 74 | CXOU J124840.8054823 | 12 48 40.86 | 05 48 23.1 | 76.93 | 93.31 | 1.300.34 | 3.84 | 1.00 | 50 | |
| 75 | CXOU J124831.0054828 | 12 48 31.03 | 05 48 28.7 | 77.14 | 77.14 | 3.780.53 | 7.19 | 1.00 | 49 | |
| 76 | CXOU J124840.9054731 | 12 48 40.91 | 05 47 31.5 | 81.04 | 81.15 | 3.990.56 | 7.13 | 1.00 | 51 | |
| 77 | CXOU J124833.1054913 | 12 48 33.17 | 05 49 13.1 | 81.48 | 102.38 | 3.340.51 | 6.56 | 1.00 | ||
| 78 | CXOU J124841.2054819 | 12 48 41.25 | 05 48 19.7 | 81.79 | 96.62 | 4.210.54 | 7.79 | 1.00 | 52 | |
| 79 | CXOU J124835.7054640 | 12 48 35.78 | 05 46 40.6 | 81.87 | 122.80 | 1.610.39 | 4.14 | 1.00 | d | |
| 80 | CXOU J124830.8054837 | 12 48 30.81 | 05 48 37.0 | 83.36 | 83.71 | 24.611.23 | 19.95 | 1.00 | 53 | d |
| 81 | CXOU J124832.8054913 | 12 48 32.85 | 05 49 13.6 | 84.40 | 103.92 | 1.060.34 | 3.09 | 1.05 | ||
| 82 | CXOU J124838.9054650 | 12 48 38.91 | 05 46 50.2 | 85.13 | 105.34 | 0.810.29 | 2.84 | 1.09 | ||
| 83 | CXOU J124841.4054737 | 12 48 41.49 | 05 47 37.2 | 87.28 | 87.47 | 3.950.55 | 7.13 | 1.00 | 55 | d |
| 84 | CXOU J124834.1054926 | 12 48 34.17 | 05 49 26.4 | 87.75 | 120.66 | 2.170.43 | 5.08 | 1.00 | 54 | f |
| 85 | CXOU J124839.2054645 | 12 48 39.21 | 05 46 45.6 | 91.48 | 112.44 | 3.460.51 | 6.75 | 1.00 | 56 | |
| 86 | CXOU J124841.6054847 | 12 48 41.64 | 05 48 47.1 | 96.70 | 128.24 | 0.920.32 | 2.91 | 1.06 | d | |
| 87 | CXOU J124833.2054628 | 12 48 33.22 | 05 46 28.2 | 102.43 | 158.44 | 6.480.68 | 9.53 | 1.00 | 57 | |
| 88 | CXOU J124829.1054822 | 12 48 29.10 | 05 48 22.0 | 103.14 | 104.93 | 0.820.30 | 2.74 | 1.14 | d | |
| 89 | CXOU J124843.2054808 | 12 48 43.20 | 05 48 08.9 | 109.28 | 120.68 | 4.200.55 | 7.68 | 1.00 | 58 | |
| 90 | CXOU J124832.9054614 | 12 48 32.99 | 05 46 14.7 | 116.14 | 179.73 | 4.460.58 | 7.68 | 1.00 | 59 | |
| 91 | CXOU J124828.4054837 | 12 48 28.44 | 05 48 37.7 | 116.58 | 116.72 | 0.930.34 | 2.71 | 1.09 | ||
| 92 | CXOU J124829.0054704 | 12 48 29.08 | 05 47 04.7 | 116.92 | 157.35 | 1.520.38 | 4.02 | 1.00 | 60 | |
| 93 | CXOU J124828.0054832 | 12 48 28.01 | 05 48 32.6 | 121.40 | 122.21 | 1.080.35 | 3.13 | 1.04 | d | |
| 94 | CXOU J124837.5055001 | 12 48 37.56 | 05 50 01.9 | 122.02 | 187.75 | 1.550.37 | 4.13 | 1.00 | ||
| 95 | CXOU J124836.3055008 | 12 48 36.30 | 05 50 08.5 | 126.12 | 190.19 | 1.000.33 | 3.02 | 1.06 | ||
| 96 | CXOU J124829.6054635 | 12 48 29.66 | 05 46 35.3 | 127.44 | 185.20 | 1.100.36 | 3.07 | 1.01 | ||
| 97 | CXOU J124830.6054618 | 12 48 30.60 | 05 46 18.5 | 130.63 | 196.97 | 0.900.30 | 2.95 | 1.08 | ||
| 98 | CXOU J124835.9054551 | 12 48 35.93 | 05 45 51.7 | 130.76 | 195.20 | 8.850.76 | 11.59 | 1.00 | 61 | d |
| 99 | CXOU J124832.4055004 | 12 48 32.42 | 05 50 04.7 | 132.75 | 175.51 | 6.160.66 | 9.33 | 1.00 | 62 | |
| 100 | CXOU J124828.7054922 | 12 48 28.71 | 05 49 22.1 | 133.52 | 140.91 | 6.170.66 | 9.36 | 1.00 | 63 | |
| 101 | CXOU J124834.3055014 | 12 48 34.39 | 05 50 14.2 | 133.62 | 191.51 | 13.380.93 | 14.32 | 1.00 | 64 | d |
| 102 | CXOU J124834.7055019 | 12 48 34.79 | 05 50 19.5 | 137.96 | 200.48 | 1.090.35 | 3.12 | 1.12 | ||
| 103 | CXOU J124827.3054707 | 12 48 27.34 | 05 47 07.8 | 138.87 | 178.58 | 24.241.23 | 19.72 | 1.00 | 65 | |
| 104 | CXOU J124827.4054901 | 12 48 27.44 | 05 49 01.0 | 138.98 | 139.69 | 0.670.31 | 2.14 | 1.72 | ||
| 105 | CXOU J124832.7055018 | 12 48 32.77 | 05 50 18.0 | 143.30 | 194.59 | 1.420.38 | 3.76 | 1.00 | ||
| 106 | CXOU J124841.4054603 | 12 48 41.42 | 05 46 03.2 | 145.01 | 175.66 | 4.730.58 | 8.11 | 1.00 | 66 | |
| 107 | CXOU J124826.4054725 | 12 48 26.49 | 05 47 25.2 | 145.19 | 175.23 | 0.610.29 | 2.12 | 1.93 | ||
| 108 | CXOU J124845.0054711 | 12 48 45.09 | 05 47 11.5 | 146.45 | 146.45 | 0.740.29 | 2.54 | 1.20 | ||
| 109 | CXOU J124826.1054729 | 12 48 26.14 | 05 47 29.5 | 149.27 | 177.21 | 2.090.43 | 4.91 | 1.00 | 67 | |
| 110 | CXOU J124840.4055020 | 12 48 40.47 | 05 50 20.7 | 154.20 | 237.85 | 4.690.60 | 7.80 | 1.00 | ||
| 111 | CXOU J124825.5054808 | 12 48 25.50 | 05 48 08.6 | 155.22 | 164.99 | 3.950.54 | 7.27 | 1.00 | 68 | |
| 112 | CXOU J124839.7055026 | 12 48 39.79 | 05 50 26.4 | 155.24 | 240.23 | 1.270.37 | 3.45 | 1.01 | ||
| 113 | CXOU J124827.3054634 | 12 48 27.30 | 05 46 34.1 | 155.74 | 216.19 | 0.770.30 | 2.53 | 1.23 | ||
| 114 | CXOU J124827.0054925 | 12 48 27.01 | 05 49 25.5 | 156.38 | 161.08 | 16.471.03 | 15.95 | 1.00 | 69 | |
| 115 | CXOU J124846.5054812 | 12 48 46.54 | 05 48 12.3 | 159.21 | 176.02 | 5.580.64 | 8.74 | 1.00 | 70 | |
| 116 | CXOU J124827.3054624 | 12 48 27.35 | 05 46 24.9 | 160.57 | 226.61 | 1.940.42 | 4.61 | 1.00 | ||
| 117 | CXOU J124846.8054853 | 12 48 46.83 | 05 48 53.2 | 170.91 | 210.15 | 67.372.00 | 33.66 | 1.00 | 72 | e |
| 118 | CXOU J124834.3055052 | 12 48 34.30 | 05 50 52.0 | 171.15 | 247.36 | 13.180.95 | 13.94 | 1.00 | 71 | f |
| 119 | CXOU J124840.1055044 | 12 48 40.17 | 05 50 44.4 | 174.09 | 269.43 | 0.730.31 | 2.33 | 1.67 | ||
| 120 | CXOU J124835.6055057 | 12 48 35.67 | 05 50 57.5 | 175.04 | 260.53 | 0.760.33 | 2.28 | 1.74 | ||
| 121 | CXOU J124824.1054817 | 12 48 24.16 | 05 48 17.3 | 175.66 | 183.87 | 1.160.37 | 3.18 | 1.03 | 73 | |
| 122 | CXOU J124828.7055026 | 12 48 28.73 | 05 50 26.1 | 179.00 | 213.42 | 4.770.65 | 7.33 | 1.00 | 74 | |
| 123 | CXOU J124826.2054955 | 12 48 26.25 | 05 49 55.5 | 182.96 | 194.93 | 1.630.43 | 3.76 | 1.03 | b | |
| 124 | CXOU J124826.0055002 | 12 48 26.02 | 05 50 02.4 | 189.91 | 203.66 | 6.890.74 | 9.27 | 1.00 | 75 | |
| 125 | CXOU J124823.7054659 | 12 48 23.73 | 05 46 59.7 | 192.02 | 239.48 | 11.180.86 | 12.94 | 1.00 | 76 | |
| 126 | CXOU J124824.7054625 | 12 48 24.77 | 05 46 25.1 | 192.49 | 260.34 | 1.470.38 | 3.87 | 1.00 | ||
| 127 | CXOU J124846.3054607 | 12 48 46.34 | 05 46 07.8 | 193.54 | 203.96 | 0.860.30 | 2.89 | 1.10 | ||
| 128 | CXOU J124845.4054542 | 12 48 45.43 | 05 45 42.5 | 199.71 | 222.43 | 25.341.97 | 12.83 | 1.00 | 77 | |
| 129 | CXOU J124827.7054523 | 12 48 27.73 | 05 45 23.7 | 200.12 | 301.51 | 2.090.42 | 4.95 | 1.00 | ||
| 130 | CXOU J124822.4054815 | 12 48 22.46 | 05 48 15.9 | 200.87 | 211.47 | 13.810.96 | 14.43 | 1.00 | 78 | |
| 131 | CXOU J124825.4054552 | 12 48 25.43 | 05 45 52.2 | 203.34 | 290.69 | 3.940.56 | 7.01 | 1.00 | 80 | |
| 132 | CXOU J124822.4054840 | 12 48 22.47 | 05 48 40.0 | 203.72 | 207.48 | 1.830.41 | 4.42 | 1.00 | 79 | |
| 133 | CXOU J124822.8054653 | 12 48 22.82 | 05 46 53.1 | 207.01 | 259.15 | 3.560.53 | 6.74 | 1.00 | 81 | |
| 134 | CXOU J124824.4054558 | 12 48 24.44 | 05 45 58.1 | 211.36 | 295.99 | 122.272.73 | 44.71 | 1.00 | 82 | |
| 135 | CXOU J124823.8054954 | 12 48 23.81 | 05 49 54.0 | 211.98 | 218.02 | 0.720.36 | 2.01 | 3.51 | ||
| 136 | CXOU J124837.5054431 | 12 48 37.53 | 05 44 31.1 | 212.84 | 309.62 | 2.210.75 | 2.95 | 1.06 | 83 | |
| 137 | CXOU J124847.2055014 | 12 48 47.27 | 05 50 14.6 | 215.10 | 304.34 | 6.650.70 | 9.54 | 1.00 | 84 | |
| 138 | CXOU J124825.4054533 | 12 48 25.43 | 05 45 33.1 | 216.14 | 314.90 | 0.810.34 | 2.40 | 1.26 | ||
| 139 | CXOU J124850.4054825 | 12 48 50.44 | 05 48 25.3 | 218.24 | 245.77 | 1.730.41 | 4.21 | 1.00 | ||
| 140 | CXOU J124850.8054848 | 12 48 50.85 | 05 48 48.8 | 227.92 | 268.36 | 1.440.42 | 3.46 | 1.03 | ||
| 141 | CXOU J124821.5054926 | 12 48 21.52 | 05 49 26.6 | 230.35 | 230.45 | 2.270.48 | 4.68 | 1.00 | ||
| 142 | CXOU J124827.5055116 | 12 48 27.52 | 05 51 16.8 | 231.02 | 284.06 | 2.010.53 | 3.83 | 1.03 | ||
| 143 | CXOU J124847.4054513 | 12 48 47.45 | 05 45 13.0 | 241.87 | 269.34 | 47.123.64 | 12.93 | 1.00 | 85 | |
| 144 | CXOU J124819.5054733 | 12 48 19.59 | 05 47 33.9 | 245.00 | 277.40 | 3.630.57 | 6.34 | 1.00 | 86 | |
| 145 | CXOU J124826.9054433 | 12 48 26.97 | 05 44 33.1 | 248.12 | 378.84 | 0.460.30 | 1.51 | 5.71 | ||
| 146 | CXOU J124821.4054552 | 12 48 21.49 | 05 45 52.2 | 251.36 | 341.78 | 2.460.62 | 3.94 | 1.00 | ||
| 147 | CXOU J124848.2055058 | 12 48 48.23 | 05 50 58.5 | 254.68 | 371.02 | 4.390.71 | 6.17 | 1.00 | ||
| 148 | CXOU J124849.2054513 | 12 48 49.27 | 05 45 13.1 | 261.91 | 283.08 | 5.601.60 | 3.51 | 1.04 | ||
| 149 | CXOU J124851.1054548 | 12 48 51.12 | 05 45 48.6 | 263.80 | 269.84 | 6.011.28 | 4.69 | 1.00 | 88 | f |
| 150 | CXOU J124852.9054647 | 12 48 52.95 | 05 46 47.1 | 265.50 | 266.19 | 1.610.43 | 3.76 | 1.01 | ||
| 151 | CXOU J124817.6054726 | 12 48 17.64 | 05 47 26.0 | 274.78 | 313.34 | 9.241.70 | 5.43 | 1.00 | 89 | |
| 152 | CXOU J124827.8055214 | 12 48 27.85 | 05 52 14.0 | 278.73 | 361.87 | 1.700.59 | 2.91 | 1.49 | ||
| 153 | CXOU J124828.4054326 | 12 48 28.43 | 05 43 26.6 | 297.57 | 460.47 | 7.811.41 | 5.56 | 1.00 | 90 | |
| 154 | CXOU J124850.0054420 | 12 48 50.09 | 05 44 20.5 | 306.91 | 346.50 | 24.902.96 | 8.41 | 1.00 | ||
| 155 | CXOU J124820.2055153 | 12 48 20.26 | 05 51 53.8 | 328.52 | 366.56 | 68.672.80 | 24.54 | 1.00 | f | |
| 156 | CXOU J124836.3055333 | 12 48 36.38 | 05 53 33.2 | 330.81 | 496.45 | 60.692.66 | 22.85 | 1.00 | e | |
| 157 | CXOU J124833.8054206 | 12 48 33.87 | 05 42 06.3 | 357.43 | 542.16 | 3.001.46 | 2.06 | 3.36 | ||
| 158 | CXOU J124843.8055416 | 12 48 43.81 | 05 54 16.1 | 391.81 | 606.20 | 4.051.13 | 3.59 | 1.12 | b |
Note. — The simulated completeness correction factor, , is accurate to 5% for the majority of sources.
| X-ray Source | Offset | |||
|---|---|---|---|---|
| No. | Optical Source () | Photometry | Optical Notes | |
| (1) | (2) | (3) | (4) | (5) |
| 1 | Center of NGC 4697 | 0.5 | ||
| 8 | 2MASS J12483635-0547577 | 1.4 | , , | Galaxy light may contaminate photometry and PSF-fitting |
| Optically extended? | ||||
| 15 | 2MASS J12483692-0548007 | 0.6 | , , | Galaxy light may contaminate photometry and PSF-fitting |
| Optically extended? | ||||
| 55 | 2MASS J12483648-0548475 | 0.2 | , , | Galaxy light may contaminate photometry |
| Optical point source | ||||
| 84 | 2MASS J12483420-0549261 | 0.5 | , , | Optical point source |
| USNO-B1 0841-0238559 | 1.0 | , , | Optical point source? | |
| 117 | USNO-B1 0841-0238601 | 0.4 | , | Optically extended? |
| Known AGN (; Paper II) | ||||
| 118 | USNO-B1 0841-0238561 | 1.1 | , | Optically extended |
| 149 | USNO-B1 0842-0237849 | 0.1 | , | Optical point source |
| 155 | USNO-B1 0841-0238528 | 0.1 | , | Optically extended? |
| 156 | Tycho-2 4955-1175-1 | 0.5 | , | Foreground star (BD-05 3573 (catalog )) |
| 2MASS J12483640-0553335 | 0.5 | ,, | ||
| USNO-B1 0841-0238574 | 0.5 | , , |
| X-ray Source | Offset | |||||
|---|---|---|---|---|---|---|
| No. | () | (pc) | (AB) | (AB) | (AB) | Notes |
| (1) | (2) | (3) | (4) | (5) | (6) | (7) |
| 7 | 0.05 | a | ||||
| 15 | 0.11 | b | ||||
| 16 | 0.06 | b | ||||
| 18 | 0.80 | b | ||||
| 21 | 0.44 | b | ||||
| 22 | 0.06 | f | ||||
| 0.25 | f | |||||
| 24 | 0.10 | b | ||||
| 25 | 0.95 | d,e | ||||
| 26 | 0.34 | b | ||||
| 31 | 0.09 | b | ||||
| 34 | 0.04 | b | ||||
| 39 | 0.06 | b | ||||
| 40 | 0.30 | b | ||||
| 41 | 0.09 | a | ||||
| 0.69 | a | |||||
| 45 | 0.87 | d | ||||
| 47 | 0.09 | b | ||||
| 50 | 0.03 | b | ||||
| 51 | 0.03 | b | ||||
| 52 | 0.02 | b | ||||
| 54 | 0.09 | b | ||||
| 55 | 0.12 | c | ||||
| 58 | 0.02 | b | ||||
| 60 | 0.29 | b | ||||
| 63 | 0.35 | b | ||||
| 0.71 | b | |||||
| 65 | 0.40 | b | ||||
| 66 | 0.98 | a | ||||
| 69 | 0.12 | a | ||||
| 70 | 0.08 | a | ||||
| 71 | 0.06 | a | ||||
| 73 | 0.05 | b | ||||
| 74 | 0.19 | a | ||||
| 75 | 0.75 | b | ||||
| 76 | 0.02 | b | ||||
| 77 | 0.06 | b | ||||
| 79 | 0.11 | b | ||||
| 80 | 0.04 | b | ||||
| 83 | 0.11 | b | ||||
| 84 | 0.06 | d | ||||
| 86 | 0.19 | b |
| Row | dof | |||||
|---|---|---|---|---|---|---|
| 1 | 0 | |||||
| 2 | 1 | |||||
| 3 | 1 | |||||
| 4aaSource may be confused with nearby sources, making its position, flux, and extent uncertain.Optical counterpart is a blue GC. | 1 | |||||
| 5bbSource region noticeably more extended than PSF.Optical counterpart is a red GC. | 1 | |||||
| 6aaParameters calculated assuming and . | 1 | |||||
| 7bbParameters calculated assuming and . | 1 | |||||
| 8aaParameters calculated assuming and . | 2 | |||||
| 9bbParameters calculated assuming and . | 2 | |||||
| 10 | 2 | |||||
| 11aaParameters calculated assuming and . | 2 | |||||
| 12bbParameters calculated assuming and . | 2 | |||||
| 13aaParameters calculated assuming and . | 2 | |||||
| 14bbParameters calculated assuming and . | 2 | |||||
| 15aaParameters calculated assuming and . | 2 | |||||
| 16bbParameters calculated assuming and . | 2 | |||||
| 17aaParameters calculated assuming and . | 3 | |||||
| 18bbParameters calculated assuming and . | 3 | |||||
| Source | |||||
|---|---|---|---|---|---|
| (1) | (2) | (3) | (4) | (5) | (6) |
| 1 | 40.34.1 | 32.64.0 | 34.14.2 | 36.24.6 | 35.34.0 |
| 2 | 6.62.0 | 10.72.6 | 8.92.5 | 10.42.8 | 5.82.0 |
| 3 | 2.51.6 | 3.61.7 | 3.51.8 | 6.42.3 | 3.91.8 |
| 4 | 11.62.5 | 7.42.2 | 11.82.8 | 9.72.8 | 12.52.6 |
| 5 | 7.12.1 | 9.42.4 | 13.63.0 | 10.42.8 | 10.62.5 |
| 6 | 3.41.5 | 5.92.0 | 6.32.2 | 4.72.1 | 0.91.2 |
| 7 | 21.53.1 | 22.33.3 | 12.62.8 | 21.83.7 | 15.02.8 |
| 8 | 1.81.4 | 2.11.6 | 3.51.7 | 1.11.7 | 1.21.3 |
| 9 | 5.71.9 | 1.11.3 | 1.41.6 | 3.51.9 | 6.52.0 |
| 10 | 20.33.1 | 18.03.1 | 23.53.7 | 14.73.1 | 14.72.8 |
| 11ttfootnotemark: | 10.72.4 | 12.12.6 | 11.62.7 | 12.93.0 | 3.21.5 |
| 12 | 5.51.9 | 1.81.4 | 3.41.7 | 5.62.2 | 4.31.8 |
| 13 | 6.82.0 | 3.31.7 | 3.51.8 | 4.52.1 | 2.91.5 |
| 14 | 4.91.8 | 5.21.9 | 6.82.1 | 5.32.2 | 2.71.5 |
| 15 | 18.62.9 | 15.22.8 | 17.03.1 | 9.22.8 | 13.22.6 |
| 16 | 4.31.7 | 3.21.6 | 1.61.6 | 4.12.1 | 3.31.7 |
| 17 | 1.51.2 | 1.61.4 | 0.71.1 | 2.11.7 | 0.71.1 |
| 18 | 2.51.4 | 0.40.9 | 0.01.0 | 0.31.1 | 0.61.0 |
| 19 | 13.62.6 | 7.22.2 | 5.52.0 | 12.12.9 | 8.12.2 |
| 20 | 5.11.8 | 2.21.5 | 3.31.6 | 2.01.6 | 3.31.7 |
| 21 | 0.10.8 | 1.11.2 | 1.91.4 | 0.61.4 | 0.51.0 |
| 22 | 3.01.5 | 2.01.4 | 2.61.6 | 1.41.5 | 4.01.8 |
| 23 | 0.20.9 | 0.30.8 | 0.30.9 | 0.21.1 | 4.91.8 |
| 24 | 1.51.3 | 1.21.3 | 0.11.2 | 2.01.7 | 0.91.2 |
| 25 | 16.92.8 | 3.01.6 | 2.81.6 | 6.52.3 | 7.52.1 |
| 26 | 0.31.2 | 3.51.6 | 0.70.9 | 0.91.4 | 0.31.0 |
| 27 | 2.31.5 | 2.31.5 | 3.31.8 | 3.61.9 | 4.01.7 |
| 28 | 3.71.7 | 1.51.3 | 0.31.0 | 2.11.6 | 1.91.4 |
| 29 | 10.72.3 | 14.22.8 | 13.62.8 | 13.63.0 | 9.92.4 |
| 30 | 4.91.7 | 2.01.4 | 2.71.6 | 3.92.0 | 2.91.5 |
| 31 | 18.82.9 | 22.03.3 | 28.13.8 | 29.84.2 | 19.13.1 |
| 32 | 24.33.3 | 26.43.6 | 20.83.3 | 22.43.7 | 23.73.4 |
| 33 | 1.61.5 | 1.11.1 | 1.51.4 | 0.51.3 | 0.10.9 |
| 34 | 8.22.4 | 6.52.0 | 3.51.8 | 9.92.8 | 6.72.1 |
| 35 | 10.52.2 | 11.82.5 | 12.62.7 | 12.42.9 | 6.82.1 |
| 36 | 0.31.1 | 1.41.3 | 1.11.3 | 0.81.3 | 0.91.1 |
| 37ttfootnotemark: | 0.00.7 | 0.30.9 | 0.01.0 | 1.11.4 | 8.62.3 |
| 38 | 0.81.3 | 1.21.3 | 1.51.4 | 2.81.8 | 3.01.5 |
| 39 | 38.94.0 | 18.33.0 | 17.03.1 | 20.13.5 | 20.53.2 |
| 40 | 2.71.5 | 0.91.2 | 1.91.4 | 0.21.1 | 1.71.3 |
| 41ttfootnotemark: | 0.20.8 | 4.91.8 | 3.71.7 | 2.61.7 | 2.51.5 |
| 42 | 10.82.3 | 9.62.3 | 10.52.5 | 11.62.8 | 10.22.4 |
| 43 | 0.71.2 | 0.30.9 | 0.81.1 | 0.91.4 | 0.71.0 |
| 44 | 1.01.3 | 2.51.5 | 3.21.7 | 2.31.6 | 1.81.4 |
| 45 | 7.42.0 | 0.11.0 | 0.11.0 | 0.31.1 | 0.10.7 |
| 46 | 8.02.1 | 6.62.1 | 10.32.5 | 8.12.4 | 10.12.5 |
| 47 | 1.61.2 | 1.51.3 | 0.71.1 | 1.41.5 | 0.61.0 |
| 48 | 8.52.4 | 4.21.8 | 5.42.1 | 4.82.2 | 6.82.0 |
| 49 | 16.12.9 | 9.82.5 | 9.22.6 | 12.63.1 | 11.92.7 |
| 50 | 4.91.8 | 1.01.4 | 2.81.7 | 2.62.0 | 1.71.4 |
| 51ttfootnotemark: | 3.41.6 | 5.21.9 | 7.62.3 | 0.31.3 | 0.10.8 |
| 52 | 10.82.3 | 13.72.7 | 14.12.9 | 6.02.2 | 12.12.6 |
| 53 | 1.71.4 | 4.81.8 | 0.31.0 | 3.72.0 | 1.81.3 |
| 54 | 62.35.0 | 61.45.3 | 55.45.3 | 61.35.8 | 48.84.6 |
| 55 | 8.92.2 | 8.12.2 | 10.72.6 | 8.02.5 | 12.32.5 |
| 56 | 4.71.7 | 4.01.7 | 5.22.1 | 1.31.5 | 2.11.4 |
| 57 | 6.11.9 | 7.02.1 | 6.62.1 | 7.42.4 | 7.52.1 |
| 58 | 58.94.8 | 53.04.9 | 59.15.3 | 62.25.8 | 66.35.4 |
| 59 | 0.51.1 | 1.41.3 | 2.51.5 | 4.21.9 | 0.30.9 |
| 60 | 0.20.7 | 0.51.1 | 0.11.1 | 0.51.0 | 3.21.6 |
| 61 | 14.02.6 | 18.13.1 | 18.93.4 | 20.23.6 | 17.12.9 |
| 62 | 1.61.2 | 1.01.2 | 0.41.0 | 0.21.2 | 1.41.2 |
| 63 | 20.43.0 | 33.24.0 | 29.54.0 | 30.24.3 | 27.03.6 |
| 64 | 0.10.8 | 2.91.6 | 1.41.4 | 0.21.3 | 0.91.1 |
| 65 | 1.21.2 | 1.51.2 | 0.41.0 | 0.91.2 | 1.41.2 |
| 66 | 9.22.2 | 10.72.5 | 9.52.5 | 11.42.8 | 8.82.2 |
| 67ttfootnotemark: | 0.30.7 | 6.01.9 | 12.22.7 | 8.62.6 | 6.12.1 |
| 68ttfootnotemark: | 10.42.3 | 13.82.7 | 23.13.5 | 0.10.9 | 4.52.0 |
| 69 | 15.12.6 | 19.03.3 | 10.12.7 | 12.13.1 | 13.82.7 |
| 70 | 3.41.5 | 3.61.8 | 0.41.0 | 0.81.3 | 2.41.5 |
| 71 | 4.31.6 | 5.81.9 | 5.62.0 | 5.02.0 | 4.82.1 |
| 72 | 6.12.6 | 1.41.9 | 4.32.8 | 4.32.9 | 1.31.8 |
| 73 | 12.33.5 | 11.23.6 | 10.03.6 | 9.43.8 | 17.24.1 |
| 74 | 3.61.5 | 1.51.2 | 1.11.2 | 1.71.5 | 1.01.1 |
| 75 | 5.41.7 | 3.61.7 | 3.61.8 | 2.61.7 | 10.72.4 |
| 76 | 6.31.9 | 5.11.9 | 8.62.5 | 4.42.0 | 3.71.7 |
| 77ttfootnotemark: | 0.30.7 | 0.71.1 | 9.22.6 | 5.42.2 | 9.82.3 |
| 78 | 14.92.6 | 3.41.6 | 2.51.5 | 3.21.8 | 4.01.7 |
| 79 | 1.71.2 | 5.51.9 | 1.91.4 | 2.01.6 | 0.31.0 |
| 80 | 30.33.6 | 39.04.3 | 33.04.2 | 30.44.3 | 40.34.2 |
| 81 | 0.61.1 | 2.41.6 | 2.71.6 | 1.51.5 | 0.71.1 |
| 82 | 0.91.1 | 1.91.3 | 0.41.0 | 0.91.2 | 1.51.3 |
| 83 | 3.11.5 | 7.52.2 | 4.21.9 | 5.82.4 | 7.32.1 |
| 84 | 4.21.6 | 2.41.5 | 1.31.4 | 4.22.0 | 2.91.5 |
| 85 | 4.41.7 | 6.32.0 | 4.01.8 | 2.71.8 | 6.52.0 |
| 86 | 1.51.2 | 0.51.2 | 1.91.4 | 1.11.4 | 1.51.2 |
| 87 | 12.32.4 | 7.22.1 | 7.12.2 | 9.52.6 | 8.42.5 |
| 88 | 0.70.9 | 1.81.5 | 0.11.0 | 1.31.4 | 1.91.3 |
| 89 | 6.21.9 | 5.11.8 | 5.72.0 | 4.42.0 | 7.82.1 |
| 90 | 4.51.8 | 4.51.8 | 8.12.3 | 10.22.7 | 4.71.9 |
| 91 | 1.81.3 | 1.11.2 | 0.91.4 | 1.11.7 | 1.51.3 |
| 92 | 3.31.5 | 2.21.4 | 2.01.6 | 2.31.6 | 0.91.1 |
| 93 | 0.31.0 | 1.11.2 | 2.11.5 | 3.92.1 | 1.01.1 |
| 94ttfootnotemark: | 0.71.0 | 0.30.9 | 0.10.8 | 3.72.0 | 6.52.0 |
| 95 | 1.31.2 | 1.01.2 | 2.41.7 | 1.61.6 | 0.91.1 |
| 96 | 1.41.2 | 1.51.3 | 2.01.6 | 1.21.7 | 1.81.4 |
| 97 | 3.01.4 | 1.21.2 | 0.10.8 | 0.21.2 | 1.71.4 |
| 98 | 17.42.7 | 6.62.0 | 10.22.5 | 9.62.6 | 16.83.0 |
| 99 | 8.62.1 | 12.52.7 | 4.72.0 | 7.92.5 | 9.12.3 |
| 100 | 8.12.1 | 8.62.3 | 6.92.3 | 9.92.8 | 9.92.3 |
| 101 | 18.82.9 | 15.02.9 | 17.03.2 | 29.04.3 | 15.52.8 |
| 102 | 1.11.3 | 1.21.3 | 2.81.6 | 1.31.6 | 1.51.2 |
| 103 | 31.43.6 | 34.14.1 | 39.64.6 | 41.35.0 | 27.03.6 |
| 104 | 0.20.8 | 0.01.0 | 0.31.1 | 0.31.0 | 5.21.9 |
| 105 | 1.91.3 | 0.81.2 | 1.41.4 | 2.71.9 | 3.21.6 |
| 106 | 9.82.2 | 7.12.1 | 5.72.0 | 4.01.9 | 5.52.0 |
| 107 | 0.60.9 | 1.21.3 | 1.61.4 | 0.21.2 | 1.11.2 |
| 108 | 0.00.7 | 0.81.0 | 0.71.1 | 0.61.3 | 3.11.7 |
| 109 | 2.91.5 | 3.11.6 | 3.01.6 | 4.62.1 | 1.61.3 |
| 110ttfootnotemark: | 0.21.0 | 0.40.8 | 0.01.2 | 0.21.2 | 32.54.0 |
| 111 | 4.91.7 | 4.31.8 | 4.01.8 | 5.32.2 | 9.02.2 |
| 112 | 2.11.4 | 1.91.4 | 1.71.5 | 2.51.7 | 0.81.0 |
| 113 | 1.61.3 | 0.81.1 | 1.11.3 | 0.91.5 | 0.91.1 |
| 114 | 26.73.4 | 25.13.6 | 19.73.4 | 29.44.3 | 15.62.8 |
| 115 | 3.81.7 | 11.22.5 | 9.22.5 | 6.52.3 | 8.62.3 |
| 116 | 2.91.4 | 1.21.4 | 4.82.0 | 2.21.8 | 2.51.5 |
| 117 | 96.36.1 | 127.47.4 | 81.76.3 | 40.04.8 | 117.97.1 |
| 118 | 22.33.3 | 15.52.9 | 14.33.0 | 20.13.7 | 19.83.2 |
| 119 | 1.51.3 | 2.11.4 | 0.31.1 | 0.91.5 | 0.81.0 |
| 120 | 0.11.0 | 2.31.5 | 2.11.6 | 1.61.7 | 0.20.8 |
| 121ttfootnotemark: | 6.51.8 | 0.31.1 | 0.91.3 | 1.01.4 | 0.40.9 |
| 122 | 11.22.4 | 2.31.7 | 6.52.2 | 5.72.4 | 6.63.0 |
| 123 | 1.51.3 | 2.61.7 | 3.01.9 | 2.51.9 | 2.01.5 |
| 124 | 12.62.6 | 12.02.7 | 7.12.5 | 9.42.7 | 5.82.2 |
| 125 | 16.32.7 | 15.22.9 | 15.03.0 | 22.43.8 | 10.82.4 |
| 126 | 2.21.3 | 2.01.5 | 1.61.4 | 4.12.1 | 0.81.2 |
| 127 | 0.70.9 | 1.01.2 | 0.41.0 | 1.01.4 | 2.81.6 |
| 128 | 34.53.7 | 35.34.2 | |||
| 129 | 2.71.4 | 3.71.7 | 1.51.4 | 3.81.9 | 2.91.6 |
| 130 | 27.33.4 | 21.23.3 | 13.52.9 | 20.03.6 | 12.92.7 |
| 131 | 3.51.6 | 2.01.5 | 5.62.1 | 5.42.3 | 11.32.6 |
| 132 | 5.11.8 | 1.81.4 | 0.41.2 | 1.71.7 | 2.91.5 |
| 133 | 7.22.0 | 2.41.5 | 5.02.0 | 7.32.5 | 3.11.6 |
| 134 | 154.07.6 | 195.09.4 | 171.09.3 | 181.210.1 | 163.38.3 |
| 135 | 0.41.2 | 0.51.1 | 1.11.4 | 0.01.4 | 4.22.6 |
| 136 | 3.21.5 | 2.61.6 | |||
| 137 | 9.82.3 | 10.42.5 | 7.62.3 | 8.32.6 | 10.32.5 |
| 138 | 1.01.0 | 2.61.6 | 0.41.2 | 0.81.5 | 0.61.5 |
| 139 | 3.51.5 | 1.11.3 | 3.91.8 | 2.51.8 | 1.01.3 |
| 140 | 5.22.8 | 0.61.2 | 3.01.8 | 2.11.9 | 0.81.2 |
| 141 | 4.61.9 | 1.71.6 | 3.21.8 | 2.02.1 | 4.11.7 |
| 142 | 5.41.9 | 1.41.4 | 2.91.9 | 0.81.5 | |
| 143 | 71.217.5 | 66.65.5 | |||
| 144 | 3.91.7 | 2.01.7 | 7.92.7 | 2.02.0 | 8.72.2 |
| 145 | 0.81.0 | 1.91.4 | 0.61.1 | 0.21.2 | 0.81.4 |
| 146 | 3.91.6 | 5.24.2 | 3.93.9 | 1.53.7 | 2.41.6 |
| 147 | 2.41.6 | 4.42.0 | 13.73.2 | 6.32.7 | |
| 148 | 8.22.3 | ||||
| 149 | 7.62.8 | 8.52.5 | |||
| 150 | 3.51.6 | 1.31.3 | 1.71.5 | 1.82.0 | 2.41.7 |
| 151 | 11.52.4 | 11.65.4 | |||
| 152 | 0.41.7 | 1.91.7 | 1.91.8 | 5.72.5 | |
| 153 | 14.83.3 | 7.02.4 | |||
| 154 | 36.54.3 | ||||
| 155 | 89.16.6 | 95.87.1 | 121.68.4 | ||
| 156 | 117.17.5 | 66.96.2 | 82.97.2 | ||
| 157 | 4.52.2 | ||||
| 158 | 5.93.0 | 8.53.4 | 3.03.4 |
Note. — Individual luminosities (in units of ) of Observations 0784, 4727, 4728, 4729, 4730 are indicated by , , , , and , respectively.
| Source | Not Detected | Not in FOV | ||||
|---|---|---|---|---|---|---|
| (1) | (2) | (3) | (4) | (5) | (6) | (7) |
| 1 | 35.81.8 | |||||
| 2 | ABCDE | 8.40.9 | ||||
| 3 | ABCDE | 3.90.7 | ||||
| 4 | B | 10.61.0 | ||||
| 5 | 10.11.0 | |||||
| 6 | AE | 4.10.7 | ||||
| 7 | 18.71.3 | |||||
| 8 | ABCDE | 2.00.6 | ||||
| 9 | BCD | 3.70.7 | ||||
| 10 | 18.31.3 | |||||
| 11ttfootnotemark: | 9.91.0 | |||||
| 12 | B | 4.10.7 | ||||
| 13 | E | 4.30.7 | ||||
| 14 | E | 4.90.7 | ||||
| 15 | 14.91.2 | |||||
| 16 | 3.30.7 | |||||
| 17 | ABCDE | 1.30.5 | ||||
| 18 | BCDE | 0.80.4 | ||||
| 19 | 9.41.0 | |||||
| 20 | BD | 3.30.6 | ||||
| 21 | ABCDE | 0.80.4 | ||||
| 22 | BCD | 2.60.6 | ||||
| 23 | ABCD | 0.90.4 | ||||
| 24 | ABCDE | 1.10.5 | ||||
| 25 | 7.70.9 | |||||
| 26 | ACDE | 0.80.4 | ||||
| 27 | ABD | 3.10.6 | ||||
| 28 | BCDE | 1.80.5 | ||||
| 29 | 12.31.1 | |||||
| 30 | B | 3.30.6 | ||||
| 31 | 23.11.4 | |||||
| 32 | 23.61.4 | |||||
| 33 | ABCDE | 0.90.4 | ||||
| 34 | 6.90.9 | |||||
| 35 | 10.81.0 | |||||
| 36 | ABCDE | 0.90.4 | ||||
| 37ttfootnotemark: | ABCD | 2.10.5 | ||||
| 38 | ABC | 1.90.5 | ||||
| 39 | 23.61.4 | |||||
| 40 | ABCDE | 1.50.5 | ||||
| 41ttfootnotemark: | ADE | 2.70.6 | ||||
| 42 | 10.51.0 | |||||
| 43 | ABCDE | 0.70.4 | ||||
| 44 | ADE | 2.20.5 | ||||
| 45 | BCDE | 1.70.5 | ||||
| 46 | 8.60.9 | |||||
| 47 | ABCDE | 1.20.4 | ||||
| 48 | 5.90.8 | |||||
| 49 | 12.11.1 | |||||
| 50 | BDE | 2.70.6 | ||||
| 51ttfootnotemark: | DE | 3.40.6 | ||||
| 52 | 11.51.0 | |||||
| 53 | ACDE | 2.50.6 | ||||
| 54 | 57.82.2 | |||||
| 55 | 9.71.0 | |||||
| 56 | DE | 3.50.6 | ||||
| 57 | 6.90.8 | |||||
| 58 | 59.82.2 | |||||
| 59 | D | 1.60.5 | ||||
| 60 | ABCD | 0.60.4 | ||||
| 61 | 17.41.3 | |||||
| 62 | ABCDE | 1.00.4 | ||||
| 63 | 27.71.6 | |||||
| 64 | ABCDE | 1.10.4 | ||||
| 65 | ABCDE | 1.10.4 | ||||
| 66 | 9.81.0 | |||||
| 67ttfootnotemark: | A | 6.20.8 | ||||
| 68ttfootnotemark: | DE | 10.71.0 | ||||
| 69 | 14.21.2 | |||||
| 70 | CD | 2.20.5 | ||||
| 71 | 5.10.7 | |||||
| 72 | BCDE | 3.50.9 | ||||
| 73 | 12.21.5 | |||||
| 74 | BCDE | 1.80.5 | ||||
| 75 | 5.30.7 | |||||
| 76 | 5.60.8 | |||||
| 77ttfootnotemark: | AB | 4.70.7 | ||||
| 78 | 6.00.8 | |||||
| 79 | ACE | 2.20.5 | ||||
| 80 | 34.71.7 | |||||
| 81 | ABDE | 1.50.5 | ||||
| 82 | ACDE | 1.10.4 | ||||
| 83 | 5.50.8 | |||||
| 84 | BC | 3.00.6 | ||||
| 85 | 4.80.7 | |||||
| 86 | ABCDE | 1.30.4 | ||||
| 87 | 9.00.9 | |||||
| 88 | ABCD | 1.20.4 | ||||
| 89 | 5.90.8 | |||||
| 90 | 6.20.8 | |||||
| 91 | ABCDE | 1.30.5 | ||||
| 92 | CDE | 2.10.5 | ||||
| 93 | ABCE | 1.50.5 | ||||
| 94ttfootnotemark: | ABC | 2.20.5 | ||||
| 95 | ABDE | 1.40.5 | ||||
| 96 | ABDE | 1.50.5 | ||||
| 97 | BCDE | 1.30.4 | ||||
| 98 | 12.41.1 | |||||
| 99 | 8.70.9 | |||||
| 100 | 8.70.9 | |||||
| 101 | 18.71.3 | |||||
| 102 | ABDE | 1.50.5 | ||||
| 103 | 34.21.7 | |||||
| 104 | ABCD | 0.90.4 | ||||
| 105 | ABCD | 2.00.5 | ||||
| 106 | 6.60.8 | |||||
| 107 | ABCDE | 0.90.4 | ||||
| 108 | ABCD | 1.00.4 | ||||
| 109 | E | 2.90.6 | ||||
| 110ttfootnotemark: | ABCD | 6.60.8 | ||||
| 111 | 5.60.8 | |||||
| 112 | ABCDE | 1.80.5 | ||||
| 113 | ABCDE | 1.10.4 | ||||
| 114 | 23.21.5 | |||||
| 115 | 7.80.9 | |||||
| 116 | BD | 2.70.6 | ||||
| 117 | 94.92.8 | |||||
| 118 | 18.51.3 | |||||
| 119 | ABCDE | 1.00.4 | ||||
| 120 | ABCDE | 1.10.5 | ||||
| 121ttfootnotemark: | BCDE | 1.60.5 | ||||
| 122 | B | 6.60.9 | ||||
| 123 | ABD | 2.30.6 | ||||
| 124 | 9.61.0 | |||||
| 125 | 15.71.2 | |||||
| 126 | BCE | 2.10.5 | ||||
| 127 | ABCD | 1.20.4 | ||||
| 128 | BCD | 34.92.7 | ||||
| 129 | C | 2.90.6 | ||||
| 130 | 19.31.3 | |||||
| 131 | B | 5.50.8 | ||||
| 132 | BCDE | 2.60.6 | ||||
| 133 | B | 5.00.7 | ||||
| 134 | 171.73.8 | |||||
| 135 | ABCD | 1.00.5 | ||||
| 136 | E | BCD | 2.91.0 | |||
| 137 | 9.41.0 | |||||
| 138 | ABCDE | 1.10.5 | ||||
| 139 | BDE | 2.40.6 | ||||
| 140 | ABCDE | 2.10.6 | ||||
| 141 | BCD | 3.20.7 | ||||
| 142 | BCD | E | 2.80.7 | |||
| 143 | BCD | 67.25.2 | ||||
| 144 | BD | 5.10.8 | ||||
| 145 | ABCDE | 0.60.4 | ||||
| 146 | CDE | 3.40.9 | ||||
| 147 | B | A | 6.51.0 | |||
| 148 | ABCD | 8.22.3 | ||||
| 149 | BCD | 8.11.7 | ||||
| 150 | BCDE | 2.20.6 | ||||
| 151 | BCD | 11.52.1 | ||||
| 152 | ABCD | 2.40.8 | ||||
| 153 | BCD | 10.51.9 | ||||
| 154 | ABCD | 36.54.3 | ||||
| 155 | AE | 101.14.1 | ||||
| 156 | AE | 90.03.9 | ||||
| 157 | ABCD | 4.52.2 | ||||
| 158 | BCD | AE | 6.01.7 |
Note. — Observations 0784, 4727, 4728, 4729, 4730 are indicated by A, B, C, D, and E, respectively. If an observation is listed in the “Not in FOV” column, it means the source was not in the S3 FOV for that observation, and thus could not possibly be detected. If an observation is listed in the “Not Detected” column, it means the source was in the FOV for that observation, but was not detected by wavdetect in that individual observation. Sources with ABCDE in the “Not Detected” were not detected in any individual observation, only in the combined sum of the observations. Luminosities are in units of .
| or | |||||||||||
|---|---|---|---|---|---|---|---|---|---|---|---|
| Row | GroupaaWe abbreviate in the 0.3–10 keV band as . | Model | ( cm-2) | (keV) | bbUnits are in the 0.3–10 keV band. | bbUnits are in the 0.3–10 keV band. | bbUnits are in the 0.3–10 keV band. | bbUnits are in the 0.3–10 keV band. | bbUnits are in the 0.3–10 keV band. | Counts | /dof |
| (1) | (2) | (3) | (4) | (5) | (6) | (7) | (8) | (9) | (10) | (11) | (12) |
| 1 | Power | (2.14) | 3.77 | 3.71 | 3.87 | 3.79 | 3.59 | 7190.3 | 294.26/245=1.20 | ||
| 2 | Power | 3.82 | 3.74 | 3.88 | 3.82 | 3.64 | 7190.3 | 283.16/244=1.16 | |||
| 3ccPossible cataloged optical counterpart may be the central AGN.Optical counterpart rejected as GC since . | Bremss | (2.14) | 3.42 | 3.34 | 3.46 | 3.41 | 3.26 | 7190.3 | 270.49/245=1.10 | ||
| 4 | Bremss | 3.42 | 3.34 | 3.46 | 3.41 | 3.26 | 7190.3 | 270.41/244=1.11 | |||
| 5 | Bremss | (2.14) | 0.82 | 0.84 | 0.82 | 0.90 | 0.78 | 1587.4 | 60.39/57=1.06 | ||
| 6 | Bremss | (2.14) | 0.91 | 0.53 | 0.62 | 0.76 | 0.72 | 1652.9 | 68.07/64=1.06 | ||
| 7 | Power | (2.14) | 1.00 | 0.58 | 0.71 | 0.86 | 0.79 | 1652.9 | 63.80/64=1.00 | ||
| 8 | Bremss | (2.14) | 4.18 | 4.12 | 4.22 | 4.24 | 3.99 | 8777.7 | 331.35/303=1.09 | ||
| 9 | Bremss | (2.14) | 5.12 | 4.65 | 4.84 | 5.02 | 4.72 | 10430.6 | 406.00/368=1.10 | ||
| 10 | ACS FOV: GC-LMXBs | Bremss | (2.14) | 2.17 | 2.22 | 2.13 | 2.24 | 2.19 | 4271.8 | 149.18/152=0.98 | |
| 11 | ACS FOV: GC-LMXBs | Bremss | 2.17 | 2.21 | 2.10 | 2.23 | 2.18 | 4271.8 | 146.41/151=0.97 | ||
| 12 | ACS FOV: Field-LMXBs | Bremss | (2.14) | 1.19 | 1.11 | 1.24 | 1.25 | 1.16 | 2614.8 | 92.38/98=0.94 | |
| 13 | ACS FOV: Field-LMXBs | Bremss | 0.0 [] | 1.19 | 1.11 | 1.25 | 1.25 | 1.16 | 2614.8 | 89.57/97=0.92 | |
| 14 | ACS FOV: LMXBs | Bremss | (2.14) | 3.35 | 3.30 | 3.37 | 3.49 | 3.35 | 6886.6 | 250.15/251=1.00 | |
| 15 | ACS FOV: LMXBs | Bremss | 3.35 | 3.30 | 3.37 | 3.48 | 3.34 | 6886.6 | 250.01/250=1.00 | ||
| 16 | ACS FOV: Blue-GC-LMXBs | Bremss | 0.0 [] | 99.7 [] | 0.44 | 0.53 | 0.33 | 0.42 | 0.39 | 553.1 | 13.87/15=0.92 |
| 17 | ACS FOV: Red-GC-LMXBs | Bremss | 1.80 | 1.78 | 1.84 | 1.83 | 1.79 | 3643.6 | 128.77/129=1.00 | ||
| 18 | ACS FOV: Red-GC-LMXBs + Blue GC-LMXBs | Bremss | 2.17 | 2.23 | 2.12 | 2.18 | 2.11 | 4196.7 | 148.29/146=1.02 | ||
| 19 | , | Bremss | (2.14) | 2.26 | 2.27 | 2.30 | 2.21 | 2.20 | 5008.8 | 175.71/182=0.97 | |
| 20 | , | Bremss | 0.4 [] | 2.26 | 2.27 | 2.31 | 2.22 | 2.20 | 5008.8 | 173.98/181=0.96 | |
| 21 | , | Bremss | (2.14) | 1.82 | 1.85 | 1.82 | 2.05 | 1.73 | 3709.4 | 120.28/132=0.91 | |
| 22 | , | Bremss | 1.82 | 1.83 | 1.80 | 2.03 | 1.72 | 3709.4 | 115.13/131=0.91 | ||
| 23 | , | Bremss | (2.14) | 4.07 | 4.11 | 4.11 | 4.25 | 3.92 | 8718.2 | 303.73/315=0.96 | |
| 24 | , | Bremss | 4.07 | 4.10 | 4.10 | 4.24 | 3.92 | 8718.2 | 303.36/314=0.97 |