Measurements of Variability of Low Mass X-ray Binary Candidates in the Early-Type Galaxy NGC 4697 from Multi-Epoch Chandra X-ray Observations
Abstract
Multi-epoch Chandra X-ray observations of nearby massive early-type galaxies open up the study of an important regime of low-mass X-ray binary (LMXB) behavior — long term variability. In a companion paper, we report on the detection of 158 X-ray sources down to a detection/completeness limit of using five Chandra observations of NGC 4697, one of the nearest (), optically luminous (), elliptical (E6) galaxy. In this paper, we report on the variability of LMXB candidates measured on timescales from seconds to years. At timescales of seconds to hours, we detect five sources with significant variability. Approximately of sources show variability between any two observations, and of sources do not have a constant luminosity over all five observations. Among variable sources, we identify eleven transient candidates, with which we estimate that if all LMXBs in NGC 4697 are long-term transients then they are on for and have a 7% duty cycle. These numbers are consistent with those found for brighter LMXBs in M87 and NGC 1399, which suggests that there does not appear to be a measurable difference between the outburst durations of long-term transient neutron star LMXBs and black hole LMXBs. We discuss in detail a transient supersoft source, whose properties are not easily explained by standard explanations for supersoft sources.
Subject headings:
binaries: close — galaxies: elliptical and lenticular, cD — galaxies: star clusters — globular clusters: general — X-rays: binaries — X-rays: galaxies1. Introduction
With the angular resolution of the Chandra X-Ray Observatory low-mass X-ray binaries (LMXBs) in nearby early-type galaxies can be detected. For early-type galaxies with a relatively low X-ray–to–optical luminosity ratio, known as X-ray faint galaxies, the emission from LMXBs is the dominant source (e.g., Sarazin et al. 2000, 2001, hereafter Papers I and II). In typical Chandra observations of such galaxies, tens to a few hundred LMXBs are resolved at bright X-ray luminosities, –. By stacking multi-epoch Chandra observations of early-type galaxies, larger numbers of fainter LMXB candidates can be studied, and brighter LMXB candidates can be studied in greater detail. Such observations open up the study of an important regime of behavior — long term variability. Low mass X-ray binaries exhibit a wide range of variability, including transient outbursts, type I bursts, and milder fluctuations. Our understanding of LMXB variability in the Galaxy drives models for accretion and LMXB evolution. However, there are several limitations in studying Galactic LMXBs: source distances are known for only a small subset, it is difficult to observe the whole Galaxy at once, and the size of the observed sample is very limited. Observations of nearby early-type galaxies can overcome these limitations of Galactic studies.
Examples of extragalactic LMXB candidates with extreme behaviors, such as luminous supersoft sources (SSs) and flaring sources, have also been examined with Chandra in greater detail. In our Galaxy and M31, SSs have very soft X-ray spectra and are generally believed to be accreting white dwarfs (WDs). Since the bolometric luminosities of extragalactic SSs can exceed the Eddington luminosity for a Chandrasekhar mass WD, an alternate hypothesis that these sources contain intermediate-mass (–) accreting BHs has been put forth (Swartz et al. 2002). Due to the degradation of the soft response of the Advanced CCD Imaging Spectrometer (ACIS) on Chandra, the study of SSs has been limited. Some LMXBs exhibit another extreme behavior, namely relatively short timescale (seconds to minutes) flares. Recently, XMM-Newton detected type I X-ray bursts in M31 (Pietsch & Haberl 2005) and we reported a more extreme example of flares in NGC 4697 Sivakoff et al. 2005, hereafter Paper III.
In this paper, we report on the variability of LMXB candidates measured from multi-epoch Chandra X-ray observations of NGC 4697, one of the nearest (), optically luminous (), elliptical (E6) galaxy. In a companion paper (Sivakoff et al 2008b, hereafter Paper IV) we report on the properties of LMXB candidates excluding variability, as well as the connection to globular clusters (GCs) revealed by a Hubble Space Telescope Advance Camera for Surveys (HST-ACS) observation near the galaxy center.
In § 2, we recap key aspects of the observations and data reduction of NGC 4697 discussed in Paper IV. Our observations of NGC 4697 provide five approximately equal chances to detect variability within a given observation (§ 3), as well as variability between different observations on timescales of to (§ 4). We summarize our conclusions in § 5. Unless otherwise noted, all errors refer to confidence intervals, count rates are in the – band, and fluxes and luminosities are in the – band.
2. Chandra Observations and Data Reduction
Since detailed descriptions of the Chandra observation and data reduction are reported in Paper IV, we only recap key aspects here. This analysis covers five Chandra ACIS observations (Observations 0784 (catalog ADS/Sa.CXO#obs/00784), 4727 (catalog ADS/Sa.CXO#obs/04727), 4728 (catalog ADS/Sa.CXO#obs/04728), 4729 (catalog ADS/Sa.CXO#obs/04729), and 4730 (catalog ADS/Sa.CXO#obs/04730)) taken on 2000 January 15, 2003 December 26, 2004 January 06, February 02, and August 18. The final flare-filtered live exposure times for the five observations were 37174, 39919, 35601, 32038, and . There are differences in the detector setup and instrument properties, such that the response of the Cycle-1 observation (0784) differs most from the Cycle-5 observations (4727, 4728, 4729, 4730). Key differences include the gain files used (acisD1999-09-16gainN0005.fits for Observation 0784 versus acisD2000-01-29gain_ctiN0001.fits with time-dependent gain and charge transfer inefficiency corrections for the Cycle-5 observations), smaller background due to Very-Faint mode cleaning in Cycle-5 observations, and increasing quantum efficiency (QE) degradation with time.
All Chandra observations were analyzed using ciao 3.1111See http://asc.harvard.edu/ciao/. with caldb 2.28 and NASA’s ftools 5.3222See http://heasarc.gsfc.nasa.gov/docs/software/lheasoft/.. Source positions and extraction regions were refined using ACIS Extract 3.34333See http://www.astro.psu.edu/xray/docs/TARA/ae_users_guide.html.. All spectra were fit using xspec22footnotemark: 2.
The finding charts for the sources are displayed in Figures 1 and 2 of Paper IV. In that Paper, the source properties from stacking the multi-epoch observations are listed in Tables 1 and 7, and the instantaneous luminosities for each observation are given in Table 6.
Throughout Paper IV and this paper, we refer to the Analysis Sample, which includes 126 sources that have photometric count rates determined at the level when stacking all five observations. This corresponds to having at least 18 net counts, a minimum detected count rate of , and a minimum luminosity of .
The spectral properties of sources can be crudely characterized by hardness ratios or X-ray colors (e.g., \al@SIB2000,SIB2001; \al@SIB2000,SIB2001). We defined hardness ratios of , , and , where , , and are the total counts in the soft (0.3–1 keV), medium (1–2 keV), and hard (2–6 keV) bands (Sivakoff et al. 2004).
3. Intraobservation Variability
After applying barycentric corrections to the times in event files, we applied three techniques to search for intraobservation variability: the Rayleigh statistic (e.g., Muno et al. 2003), the K-S test (e.g., Paper II, ), and a newly developed flare detection technique (Paper III). These three techniques consider all photons in the source apertures, and thus are likely to include some background photons.
| Period | |||
|---|---|---|---|
| Source | Observation | Probability Constant | (sec) |
| (1) | (2) | (3) | (4) |
| 1 | 0784 | 1.1E-02 | 21.93 |
| 101 | 4727 | 6.7E-03 | 14.98 |
| 103 | 4728 | 4.4E-02 | 20.02 |
| 143 | 0784 | 4.6E-08 | 1000.00 |
| 155 | 4728 | 8.1E-03 | 16.99 |
Note. — The value of indicates the probability that the observed periodicity is due to a statistical fluctuation. All periods, , are measured in seconds. No periodic variable sources were detected in Observations 4729 and 4730.
We used the Rayleigh statistic to search for periodic signals with frequencies between and (periods of –), testing every . Table 1 summarizes the results for level variable sources (i.e., the chance the observed source variability is due to a statistical fluctuation is %), listing the observation, probability that the detected periodicity is due to a statistical fluctuation, , and detected period, . Between zero and two sources appear periodic at the level in any given observation. Since the expected number of false detected sources at this level is , we concentrate our discussion on the one periodic source detected at the level (probability that the variability is due to a fluctuation is %). The probability that the apparent periodicity among the 26 counts of Source 143 in Observation 0784 is due to a statistical fluctuation is only . Unfortunately, this source is located near an edge of the S3 chip, and the period of is consistent with a periodicity induced by the yaw of the satellite aspect motion. Thus, it is likely that this periodicity is instrumental, and we have no cases of detected periodic variations for sources in NGC 4697.
| Source | Observation | |
|---|---|---|
| (1) | (2) | (3) |
| 2 | 0784 | 2.4E-02 |
| 10 | 4727 | 4.6E-02 |
| 11 | 0784 | 1.4E-02 |
| 12 | 4728 | 1.2E-02 |
| 40 | 0784 | 2.9E-02 |
| 42 | 4730 | 3.0E-02 |
| 54 | 4729 | 1.2E-02 |
| 65 | 4727 | 1.6E-02 |
| 71 | 4728 | 5.0E-03 |
| 75 | 4727 | 2.0E-02 |
| 76 | 4729 | 4.3E-02 |
| 78 | 0784 | 1.5E-02 |
| 79 | 0784 | 1.5E-02 |
| 83 | 0784 | 2.6E-02 |
| 96 | 0784 | 3.5E-02 |
| 100 | 4729 | 1.6E-02 |
| 115 | 4728 | 3.9E-02 |
| 130 | 0784 | 2.0E-02 |
| 137 | 0784 | 3.7E-02 |
| 4727 | 2.0E-02 | |
| 156 | 4727 | 6.9E-07 |
Note. — The value of indicates the probability that the observed variability is due to a statistical fluctuation.
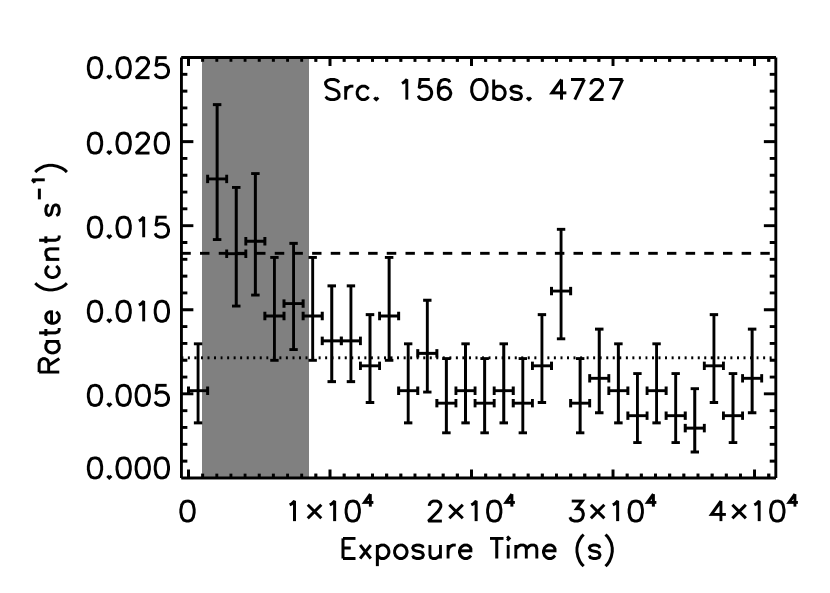
By comparing the cumulative fraction of events received from a source to a constant rate, the K-S test can identify intraobservation variability. This method has been applied to LMXB candidates in previous papers (e.g., Paper II, ). We summarize the results in Table 2 for sources which are variable at the level. We list the probability the detected variability is due to a statistical fluctuation for each observation, . Between one and nine sources appear variable in any given observation. Again, we concentrate on the one variable source detected at the level. Source 156 is the foreground star BD-05 3573 (catalog ) which undergoes a clear flare () soon after Observation 4727 begins. We display the binned lightcurve of this source in Figure 1. We note that source 137 appears as a variable source in both Observations 0784 and 4727. Following equation 3 of Paper III, the joint probability that this source is constant is , which is still less than significant.
Finally, we applied a new method developed to search for flaring sources. This technique is based on the arrival times of individual events compared to the Poisson distribution at a constant rate, and was presented previously in Paper III. This flare detection uses the ONTIME values (37651, 40447, 36072, 32462, and , respectively for observations 0784 and 4727–4730) as opposed to the live exposure times. Paper III gave the results for the most significantly flaring sources; note that Sources A, B, and C in that Paper correspond to Sources 71, 75, and 57 here, respectively. We summarize the results of these tests in Table 3 for sources which are variable at the level in at least one observation. For each observation of a flare-candidate source, we list the observation number, the total number of photons in the observation, , the number of photons in the flare, , the duration of the flare, , and the Modified Julian Date (MJD) of the arrival time of the first photon in the flare, . The value of indicates the mathematical probability of the given flare occurring due to a statistical fluctuation in a constant rate source; however, we must account for the number of non-independent flare searches undertaken. After applying corrections to based on the number of photons in the observation, is the probability a flare in a given observation is not real. The number of sources with a statistically significant flare ranges from one to seven in the different observations.

Given the number of sources expected to show a flare from a statistical fluctuation, we only consider the flaring sources in individual observations detected at the level, which are Sources 57, 155, and 156. These sources have flares ranging from a few photons over tens of seconds to nearly a hundred photons over thousands of seconds. Source 57 was discussed earlier in Paper III as Source C; note that the luminosity conversion used in this Paper is about 10% smaller than in Paper III due to updated calibrations. We display an impulse diagram of the photon arrival times for Observation 0784 of Source 57 in Figure 2. The observed count rate of the flare is over 100 times the average count rate. Source 57 has no optical counterpart in the HST-ACS image, suggesting it is most likely a flaring Field-LMXB.
| Source | Observation | |||||||
|---|---|---|---|---|---|---|---|---|
| (s) | (MJD) | |||||||
| (1) | (2) | (3) | (4) | (5) | (6) | (7) | (8) | (9) |
| 25 | 4730 | 21 | 9 | 2952 | 53235.81643 | 2.5E-03 | 6.5E-03 | 3.2E-02 |
| 42 | 4728 | 26 | 3 | 25 | 53010.59465 | 3.9E-03 | 1.0E-02 | 5.2E-02 |
| 56 | 4727 | 10 | 5 | 1919 | 52999.89337 | 8.7E-03 | 2.1E-02 | 1.1E-01 |
| 57 | 0784 | 20 | 4 | 68 | 51558.95770 | 1.3E-04 | 3.4E-04 | |
| 4727 | 20 | 3 | 50 | 53000.06223 | 5.5E-03 | 1.4E-02 | ||
| 0784, 4727 | 4.8E-05 | |||||||
| 71 | 0784 | 14 | 5 | 1047 | 51558.79423 | 7.0E-03 | 1.8E-02 | |
| 4727 | 16 | 4 | 628 | 52999.75882 | 2.7E-02 | 7.0E-02 | ||
| 4728 | 14 | 4 | 509 | 53010.70295 | 1.2E-02 | 3.1E-02 | ||
| 0784, 4727, 4728 | 3.9E-04 | |||||||
| 75 | 4727 | 10 | 5 | 1329 | 53000.04326 | 2.2E-03 | 5.5E-03 | |
| 4728 | 9 | 4 | 1420 | 53010.72444 | 3.4E-02 | 8.0E-02 | ||
| 4729 | 6 | 5 | 5654 | 53047.59915 | 4.3E-02 | 9.0E-02 | ||
| 4727, 4728 | 4.4E-03 | |||||||
| 4727–4729 | 4.0E-04 | |||||||
| 78 | 0784 | 44 | 4 | 52 | 51558.84209 | 1.5E-03 | 4.1E-03 | 2.0E-02 |
| 83 | 0784 | 10 | 8 | 6910 | 51558.83658 | 8.5E-03 | 2.1E-02 | 1.1E-01 |
| 90 | 4727 | 13 | 3 | 116 | 52999.82502 | 7.5E-03 | 1.9E-02 | 9.5E-02 |
| 107 | 0784 | 2 | 2 | 480 | 51559.09218 | 2.5E-02 | 5.2E-02 | |
| 4728 | 4 | 2 | 63 | 53010.69939 | 2.1E-02 | 4.2E-02 | ||
| 0784, 4728 | 2.2E-02 | |||||||
| 115 | 4728 | 22 | 8 | 1857 | 53010.37696 | 2.7E-03 | 6.9E-03 | 3.5E-02 |
| 118 | 4728 | 35 | 11 | 2667 | 53010.42386 | 9.0E-03 | 2.5E-02 | 1.2E-02 |
| 124 | 4728 | 20 | 4 | 270 | 53010.38518 | 8.5E-03 | 2.2E-02 | 1.1E-01 |
| 135 | 0784 | 4 | 2 | 78 | 51558.70911 | 2.4E-02 | 5.0E-02 | |
| 4730 | 6 | 2 | 57 | 53235.77593 | 4.1E-02 | 8.5E-02 | ||
| 0784, 4730 | 4.3E-02 | |||||||
| 137 | 4727 | 27 | 12 | 5529 | 53000.01065 | 2.4E-02 | 6.5E-02 | |
| 4729 | 18 | 6 | 1034 | 53047.40640 | 4.2E-03 | 1.1E-02 | ||
| 4727, 4729 | 6.9E-03 | |||||||
| 146 | 0784 | 13 | 4 | 697 | 51559.01802 | 1.9E-02 | 4.9E-02 | |
| 4727 | 4 | 2 | 22 | 52999.76129 | 6.5E-03 | 1.3E-02 | ||
| 0784, 4727 | 6.6E-03 | |||||||
| 155 | 4728 | 219 | 17 | 584 | 53010.48733 | 2.2E-04 | 7.5E-04 | 3.7E-03 |
| 156 | 4727 | 289 | 99 | 7423 | 52999.64230 | 4.0E-06 | 1.3E-05 | 6.7E-05 |
Note. — This table follows the nomenclature of Paper III: is the total number of photons during an observation. A flare candidate with photons of observed duration begins at , where we list the time measured prior to barycentric corrections. The value of indicates the mathematical probability of the given flare occurring due to a statistical fluctuation; is the same probability after accounting for the number of non-independent flare searches the technique examines. If the same type of flare occurs in multiple observations, one can calculate the joint probability the flare is not real, .

A flare of several hundred seconds with 17 counts is detected in Source 155, but was missed by the K-S test. This source was just above the criteria used in Paper III () to identify a flaring source. The observed count rate of the flare is about five times the average. As shown in Figure 3, the flare is marked by a clearly increased rate (larger slope in the cumulative light curve) that straddles the cumulative light curve for a constant rate source. Since the K-S test looks for the largest deviation from a constant rate, it is not surprising that the K-S test fails to detect this type of flare. Follow-up of the optical counterpart to Source 155 is necessary to determine if this source is an flaring LMXB in a GC or a source unrelated to NGC 4697. As discussed earlier, Source 156 is the foreground star BD-05 3573 (catalog ) that undergoes a clear flare with 99 counts. In Figure 1, we overlay the flare count rate determined by the flare detection algorithm for Source 156, which is about twice the average rate.
If we consider searching for flares over multiple observations, one can calculate the joint probability the flares are not real, . Thirteen sources in the Analysis Sample have a that indicate a detection of flaring across multiple observations; however, the detected flares in two of those sources (137 and 146) have disparate enough durations that their separate flare detections probably should not be combined. Only 4 sources (57, 71, 75, and 156) have flaring which is significant at the level across multiple observations; these are the sources discussed in (Paper III), plus the foreground star BD-05 3573 (catalog ). After correcting for the number of sources expected from statistical fluctuations, we find that of the Analysis Sample sources exhibit flaring which is detectable at the level with our new algorithm. This is consistent with the of the Analysis Sample sources that exhibit flaring which is detectable at the level.
4. Interobservation Variability
Our observations of NGC 4697 are among the first designed to measure interobservation variability with strong coverage over a wide time baseline. Some variability results have been presented before (e.g., Centaurus A: Kraft et al. 2001, M87 Jordán et al. 2004; Irwin 2006, NGC 1399 Loewenstein et al. 2005; Irwin 2006, and NGC 4636: Posson-Brown et al. 2008); however, these results did not have the same quality temporal coverage as our NGC 4697 observations. More recently, variability results were discussed for NGC 3379 (Brassington et al. 2008), with a similar coverage of time baselines as in our NGC 4697 observations. We searched for luminosity variability between any two observations, as well as luminosity or spectral variability over the entire set of observations.
4.1. Luminosity Variability Between Two Observations

We first searched for variability between pairs of observations by calculating the value of assuming a constant flux. Sources were considered possibly variable if , i.e., a detection of variability. This method differs slightly from Posson-Brown et al. (2008), which compares the individual luminosities to each other. The probability that the variability is due to a statistical fluctuation is listed in columns (2)–(11) of Table 4 for the ten pairs of observations. In Figure 4, we display the percentage of variable sources as a function of the timescale between two observations for all of the Analysis Sample sources that are in the FOV for both observations in each pair. We also display the percentage of variable sources expected due to statistical fluctuations at the level. There is a slight tendency for a higher percentage of variable sources at longer timescales; however, this is not statistically significant, based on a test. (There are two caveats with this: the error bars in Figure 4 are not independent, and there may be a slight excess variability on the four longest timescales due to the improper correction of QE degradation for SSs. This latter effect comes about because we have assumed an average spectrum when correcting for QE degradation; however SSs have a much softer spectrum that is more strongly affected by the QE degradation and the differences due to QE degradation will be most evident in comparisons to the first observation. We estimate that this latter effect is well within the displayed errors that arise from counting statistics.) If we treat the error bars as independent, we find that of the Analysis Sample sources are variable on average at the level. Given the expected number of falsely identified variable sources, of the Analysis Sample sources are intrinsically variable between any pair of observations. If we only consider sources variable at the level, the fraction of variable sources is . Thus, over timescales of – days, of sources are significantly variable. This number is roughly consistent with that found for Centaurus A () for a variability timescale of (Kraft et al. 2001); although they derive a much higher percentage when they include a generous definition of transient candidates (). Our derived variability percentage is lower than that found for a timescale in NGC 4636 (; Posson-Brown et al. 2008); however, it is consistent with the variability for a day timescale (%).
4.2. Long-Term Luminosity Variability
We can apply a similar technique to search for sources that show any luminosity variability over the entire period of five observations. We refer to these sources as Long-Term Luminosity Variables (LTLVs), and the probability that the variability arises from statistical fluctuations is given in column 12 of Table 4. The difference in compared to a single merged luminosity and combined with the appropriate degrees of freedom (one less than the number of observations a source is in the FOV) is used to calculate the probability an observed LTLV is due to a statistical fluctuation. Sources 148, 154, and 157 are excluded from these calculations as they are only in the FOV of one observation. From the Analysis Sample, 26/124 sources () are LTLVs at the significance level, while of Analysis Sample sources are LTLVs at the significance level. Statistically correcting for falsely identified LTLVs, we find of the significantly detected sources show LTLV behavior at the significance level. Three of these sources are not associated with NGC 4697: Source 45 has an optical ID that is not a GC and thus is probably due to a background AGN, Source 117 is a known background AGN, and Source 156 is a known foreground star. Two sources (25 and 155) are associated with optical counterparts that may or may not be GCs in NGC 4697. Sources 39, 41, 51, 77, and 79 are GC-LMXBs that exhibit LTLV behavior. (Sources 98 and 114 are associated with Kavelaars GC candidates; new HST-ACS data will be used to test whether these sources are really GC-LMXBs.) After correcting for the likely percentage of falsely identified LTLVs, of GC-LMXBs and of Field-LMXBs exhibit LTLV behavior at the significance level.
The recent analysis of sources in NGC 3379 found that of their LMXBs exhibited LTLV behavior (Brassington et al. 2008) using a test similar to the one used in this paper; however, they only required a source have a reduced . For sources in 2–5 observations, this corresponds to a false detection rate. After correcting for these false detections, the rate for LTLVs in NGC 4697 () and NGC 3379 () are comparable.
Since some Galactic LMXBs are known to undergo transitions between distinct luminosity states, we developed a method that groups observations together into possible luminosity states. For every LTLV, we first considered all possible combinations of observation groupings that divide into two separate states. That is, we assumed that the luminosity had two distinct values, and that one or the other of the two values applied to each observation of that source. The two luminosity values were allowed to vary, and each observation was assigned to one of the two luminosity states so as to minimize . Some sources still had a much larger than the number of dofs. Given the new , we could calculate the probability that any deviations from our two-state hypothesis were due to statistical fluctuations, given the new number of dofs and the number of combinations of states. If this probability was low (%), then we tried to divide the observations into three luminosity states. No source required more than three states to be fit acceptably. We list the states in Table Measurements of Variability of Low Mass X-ray Binary Candidates in the Early-Type Galaxy NGC 4697 from Multi-Epoch Chandra X-ray Observations. For each state, we list the observations included in a state (column 2), and the combined luminosity and hardness ratios of the state (columns 3–6). Unless otherwise noted, we placed no requirement on the temporal pattern of the states; LTLVs whose states are interspersed temporally may be switching between those states or the intrinsic variability may be poorly characterized by a simple transition between states. There are several categories of luminosity state transitions that indicate potentially interesting transitions and a few sources that bear individual scrutiny.
Sources 25, 78, and 110 are SSs that exhibit possible LTLV. As SSs, they are more affected by QE degradation than the typical source. Among these sources, the first two have a luminosity that drops precipitously in the last four observations compared to the first observation. Since the last four observations all have a similar amount of QE degradation, we reran the LTLV detection method only considering the last four observations; neither of the sources remained LTLVs. Therefore, we do not consider Sources 25 and 78 as LTLVs. Since Source 110 does not turn on until the last observation, the QE degradation does not complicate its identification as an LTLV.
Sources 68 and 117 were the only sources broken into three luminosity states. The individual luminosities of Source 68 are qualitatively described by an increase over the first three observations, followed by the source turning off, and perhaps beginning to turn on again in the last observation. Its two-state mode is consistent with this qualitative picture, containing a higher-luminosity state of the first three observations and a state where the source is not significantly detected in the last two observations; however, the probability the two-state description is correct is . In its best three-state mode, Observations 0784 and 4730 are grouped together in a lower-luminosity state that is still significantly detected; we note that the three-state set where the first two observations share a lower-luminosity state, the third observation is the higher-luminosity state, and the last two observations are a state where the source is not significantly detected has a only 0.46 higher than the best three-state set. The individual luminosities of Source 117 vary significantly with no clear temporal pattern. In its two-state set, Observation 4729 is in the lower-luminosity state and the rest of the observations are in the higher-luminosity state; however, the probability the two-state description is correct is .
Some sources had a lower-luminosity state that was consistent with no emission at the level, and a higher-luminosity state, whose observations were sequential and had emission detected at the level. We labeled sources following this pattern of states as transient candidates. For Sources 68 and 117, we considered their two-state properties for discussions of transience. Eleven of the Analysis Sample sources () are transient candidates (Sources 11, 37, 41, 45, 51, 67, 68, 77, 94, 110, and 121). For the eleven transient candidate sources we also calculated the minimum ratio of fluxes at the level. Only the flux ratio of Source 110 is above 10. We believe Source 110 is a truly transient source and in § 4.4 we discuss it in detail. The other transient candidates are either transient sources or LTLVs that have a lower luminosity state that is below the detection limit. All eleven transient candidates appeared to either turn on or turn off during the 4.6 years over which we observed; no source turned on and then off, or off and then came back on again. If we assume all the LMXBs in NGC 4697 are long-term transients, and that our detected transient sources are just those which turned off or on during our observation period, then the mean outburst duration for LMXBs in NGC 4697 is . Under this hypothesis, the duty cycle of LMXBs would also depend on their recurrence timescale. Since our observations find no recurring transients, we have adopted the crustal heating recurrence timescale for the Galactic NS-LMXB KS 1731260 of (Rutledge et al. 2002). (The adoption of a crustal reheating timescale also implies that we are assuming all the LMXBs in NGC 4697 are NS-LMXBs. While this is not necessarily true, we note that the recurrence timescale of Galactic long-term transient BH-LMXBs is unknown. As such, we present this calculation for illustrative purposes only.) We note that this implies a duty cycle of , which is comparable to the duty cycle obtained comparing active and quiescent LMXBs in Galactic GCs (; Heinke et al. 2003). We also note that the number of transient candidates and possible transient candidates in NGC 3379 yields similar duty cycles (Brassington et al. 2008), although their study uses a different definition of transience.
Six of the LTLVs have a difference in at least one of their hardness ratios between their states (Sources 11, 45, 117, 121, 134, and 156; Table Measurements of Variability of Low Mass X-ray Binary Candidates in the Early-Type Galaxy NGC 4697 from Multi-Epoch Chandra X-ray Observations, columns 4–6). These sources appear to exhibit luminosity/spectral state transitions. Since the lower-luminosity state in Sources 45 and 121 is not even a 1 significant detection, we exclude these sources from this discussion. Although Source 11 is a Field-LMXB that is a transient candidate, it may also be a luminosity/spectral state transition source. The luminosity of the lower-luminosity state (Observation 4730) is more than significant and appears to be 3.4 softer in , than the higher-luminosity state. Although this softer/fainter to harder/brighter transition is opposite of the conventional relationship in BH state transitions, it is possible that this discrepancy results from the softer bands used to calculate the hardness with Chandra (Juett et al. 2008 in preparation). Alternatively, this source may be transitioning from the thermal state (formerly called high/soft) to the steep power law state (formerly called very high). For example, in its 1996–1997 outburst, the Galactic LMXB GRO J1655-40 (catalog ) is softer and fainter in its thermal state compared to its steep power law state (Remillard & McClintock 2006). Source 117, a known AGN, appears to display the more typical harder/fainter to softer/brighter transition (e.g., the spectral correlation of Seyfert galaxy NGC 4151 in Perola et al. 1986); Observation 4729 is –5 harder in and than the two higher luminosity states. Its spectrum seems to change most in the 2–6 keV band. Source 134, a suspected AGN based on its hardness ratios, appears to undergo a change in its 1–2 keV band. The lower-luminosity state is harder in , but softer in than its higher-luminosity state. Finally, source 156, a known foreground star, undergoes a transition similar to source 11. The lower-luminosity state of source 156 is softer in than its higher-luminosity state. This behavior is not surprising given that stellar flares generally heat their corona (Güdel 2004) and the higher-luminosity state occurs in the observation where this source flares.
4.3. Long-Term Hardness Ratio Variability
Our method for identifying LTLV can also be applied to hardness ratios; we define sources whose hardness ratios vary as Long Term Hardness Variables (LTHVs). Sources that have variations in the hardnesses ratios that are significant at the level have the probabilities that their variations are due to statistical fluctuations listed in Table 4, columns 13–15. We identify fewer LTHVs than LTLVs because the errors in hardness ratios are larger than in luminosities. Therefore, we only summarize the results for the 83 sources in multiple observations and with luminosities detected at the 5 level. We detect , , and sources that exhibit , , and variability at the significance level, respectively. Corrections for falsely identified variable sources reduce the percentages of hardness variable sources to , , and . That is, the numbers of sources selected purely based on hardness ratio variations could result from statistical fluctuations.
We also applied the same grouping of observations into states as in § 4.2, using individual hardness ratios as opposed to luminosities (Table Measurements of Variability of Low Mass X-ray Binary Candidates in the Early-Type Galaxy NGC 4697 from Multi-Epoch Chandra X-ray Observations, lower portions). Here we discuss sources that were identified as LTHVs in at least two hardness ratios, or identified as LTHVs in at least one hardness ratio and also as LTLVs. Sources 10, 66, and 102 are in the first category, while Sources 11, 117, 134, and 156 are in the the second. We discuss attempts to resolve the difference in their states, and the implications of those attempts.
For Source 10, the selections by and agree, pointing to a probable decrease in the 2–6 keV count fraction for Observation 4729. Although the best-fit states disagree for Source 66, matching the selected state to the selected state leads to a that is only 0.7 higher than the best selected state. The fraction of 2–6 keV counts is higher for Observation 4729. Similarly, matching the selected state to the selected state leads to a that is only 0.2 higher than the best selected state for Source 102; the 2–6 keV count fraction is higher for Observations 4727 and 4729.
Sources 11, 117, 134, and 156 were all identified as luminosity/spectral state transitions using the LTLV selection. The hardness ratio two-state sets in Source 117 are consistent with the two-state luminosity set; the 2–6 keV count fraction is higher in the lower-luminosity state (Observation 4729). The and luminosity states match for Source 156, where the lower-luminosity state is softer in than the higher-luminosity state. Sources 11 and 134 are more difficult to resolve as clear luminosity/spectral state transitions as the the grouping of observations into states by luminosity and hardness ratios do not match. If we match the selected state to the luminosity selected state for Source 11, the is 4.1 higher; however, both sets of states are consistent with the lower-luminosity state being softer in . The resolution for Source 134 is even more problematic. This source appears best described by a non-monotonic evolution of hardness with luminosity. As the source luminosity increases, it first becomes softer and then becomes harder in all three hardness ratio bands; however, the softest observation changes between 4728 or 4729 depending on the hardness ratio.
4.4. Source 110: A Transient Supersoft Source
We consider Source 110 to be a clear transient source. In the sum of the first four observations, there were 5 counts in the source aperture and 19 counts in the (three times) larger background aperture. After correcting for QE degradation of a typical source in NGC 4697, the corresponding rate is ; the source is clearly undetected. We also calculated the corrected rate including observations 4727-4729, which have a similar level of QE degradation, to be . In the final observation, there were 87 counts in the source aperture and 4 counts in the background aperture, corresponding to a QE degradation corrected rate of . The ratio of the count rate in Observation 4730 to the other observations is at the level. Therefore, we only consider data from Observation 4730 hereafter. Within the 0.3– band, only two of the source aperture photons were above (1.03 and ). Source 110 is clearly supersoft. Its limits on observed hardness ratios are and . Analysis of our flanking-field HST-ACS observations indicates Source 110 is not associated with an optical source, although it is about away from a GC candidate. From simulated point sources at the location of Source 110 we placed 90% confidence limits on magnitudes for a single HST-ACS image of and in AB mag. Since Source 110 is in an overlapping region of two fields, these magnitudes correspond to the 99% confidence limit on an optical counterpart to Source 110.
Since Source 110 is both transient and SS, we explored its spectrum in greater detail. We examined both the raw spectrum and a binned spectrum. Since Source 110 has only 87 gross counts in Observation 4730, we created five bins with at least 16 counts in the 0.3– range and a bin with two counts from 1–. These bins were weighted by Gehrels errors.
Luminous SSs in our Galaxy and M31 are generally believed to be accreting WDs. Such sources are often fit by a blackbody (bb) model. Compared to the best-fit for this model, the spectrum appears to rise too quickly within the 0.3– band to be consistent with Galactic absorption in the raw spectrum. In the binned spectrum, the best-fit model with Galactic absorption was strongly rejected, for 4 dof (). This model is also hotter than typical fits to SS-WDs (15–; Kahabka & van den Heuvel 1997). If we allow the absorption to vary, we do get a high absorbing column and lower temperature, and (90% individual confidence limits), for an acceptable fit with for 3 dof. However, the implied X-ray and bolometric luminosity in the 0.3–, and are much too large for a WD at the distance of NGC 4697. Even the lowest X-ray and bolometric luminosities allowed by the uncertainties at 90% confidence for jointly varying absorption and temperature, and , are much too luminous for a SS-WD in NGC 4697. These luminosities come at hotter temperatures, , than seen in SS-WDs. Although more detailed WD atmosphere models can lead to luminosities lower by an order of magnitude than derived from the bb model (e.g., Heise et al. 1994; Balman et al. 1998; Orio et al. 2007), they also tend to increase the temperature. Thus, we consider it unlikely that Source 110 is a SS-WD in NGC 4697. On the other hand, our optical limit suggests that it is unlikely that Source 110 is a SS-WD within the Milky Way. Of the likely companions for a SS-WD, main sequence stars earlier than F5, red giants overflowing their Roche lobe, and asymptotic giant branch stars with winds (Kahabka & van den Heuvel 1997), an F5 main-sequence star is the faintest with (pg. 107 Binney & Merrifield 1987). We would detect such a source out to in our HST images. Thus, Source 110 is unlikely to be a SS-WD, either as a foreground Galactic source or a source in NGC 4697.
A very soft, luminous X-ray transient with an excess absorption column has been observed in M101 (M101 ULX-1; Kong & Di Stefano 2005). The combination of spectra, outburst luminosity, and transience was used to suggest that source is an intermediate-mass BH (IMBH). The disk blackbody model (hereafter diskbb, Mitsuda et al. 1984) is a multi-color blackbody model that is often used to represent BH soft X-ray transients (SXTs), which have (Tanaka & Shibazaki 1996). As with the simple blackbody model, the spectrum is poorly fit by a model with Galactic absorption; yields for 4 dof. If we allow the absorption to vary, the absorption and temperature are strongly correlated and span a fairly large range, but the fit is much improved with a for 3 dof. We find and (90% individual confidence limits). The 0.3– X-ray luminosity of acceptable spectral models (within the 90% two-dimensional confidence interval for varying absorption and temperature) ranges from – . The bolometric luminosity range is even larger, . We use the normalization of the diskbb model to estimate a BH mass following equation (3) in Fabian et al. (2004). Following Fabian et al. (2004), we also assume a correction factor of , an inclination angle of , and an innermost disk radius of , where is the BH mass. Dividing our derived bolometric luminosity by the Eddington luminosity, , gives the Eddington efficiency of the accretion disk, which we use later in evaluating the plausibility of the model. The value of the disk blackbody temperature also provides a second estimate of the black hole mass, which is roughly (Makishima et al. 2000). Considering models within the 90% two-dimensional confidence interval for varying absorption and temperature, these two estimates of BH mass agree to within a factor of two for absorption columns between 0.5 and . Within this region, our source is consistent with BH masses of – accreting at –4.7% of the Eddington limit. Thus, this source is consistent with a rather massive IMBH or a small supermassive black hole about a factor of 2–3 smaller in mass than the one at the center of the Milky Way (Ghez et al. 2000). Understanding the origin of such a large BH outside of the center of a galaxy or of a GC is a formidable challenge to our current theories of BH formation.
Some AGNs have ultrasoft spectra. For example, Puchnarewicz et al. (1992) identified 53 ultrasoft AGN candidates with Einstein Observatory. These sources had 0.16– count rates nearly three times that of their 0.56– count rates. This corresponds to steep power-law photon indices, , with Galactic absorption. In a study of variability in soft X-ray selected AGNs, Grupe et al. (2001) found that AGNs with steeper X-ray spectra had larger short-term variability than those with flatter spectra. Two of the transient sources, IC 3599 (catalog ) and HE 0036-5133 (catalog ) (also called WPVS 007) were also previously reported as ultrasoft. These sources may be analogs to Source 110. A variety of complicated models have been used to explain the spectra of AGNs with excess soft emission compared to the power-law models derived from harder bands (e.g., Gierliński & Done 2004). Given the relative paucity of our data on Source 110, we chose to only consider simple power-law and blackbody models. The power-law model with Galactic absorption, , is an exceptionally poor fit, for 4 dof. Even with a free absorption, power-law models with reasonable photon indices, , did not fit our data well, for 3 dof. From above, we know that the disk blackbody model is a good statistical representation of the spectra. However, our derivation of the BH masses in the above paragraph was predicated on the source being at the distance of NGC 4697. As we allow the source to lie farther behind NGC 4697, the agreement between the mass derived from the normalization and the mass derived from the temperature begins to break down. Thus, it is unlikely that the disk blackbody model fully represents the physical mechanism behind the emission. Regardless of the model we choose to represent the emission, we measure an absorbed X-ray flux (0.5–) of . At that flux level, we only expect sources unrelated to NGC 4697 for galactocentric radii interior to that of Source 110. Thus, the probability Source 110 is a background AGN is from the X-ray data alone. If we assume that the transient behavior observed was not an extreme flare that began between 2004 February 02 and August 18, but ended before the HST-ACS flanking field observations began in 2005 December 19, we can place an additional constraint using the logarithm of its X-ray–to–optical flux ratio, , where is the optical flux in the band. Based on our non-detection of a counterpart to Source 110, its is greater than 0.9 at the 99% confidence level. Such a large ratio is expected only from the most obscured AGNs. There are two problems with suggesting Source 110 is an obscured AGN. First, the most obscured AGNs can have columns one to two orders of magnitude larger than the estimated column for Source 110. In fact, its column is actually near the division point typically used for obscured and unobscured AGN (; Treister et al. 2004). Second, very few sources are predicted to have such high X-ray–to–optical flux ratios. In Treister et al. (2004), a model based on the AGN unification paradigm predicts only of AGNs will have . In summary, although some of its X-ray properties may be consistent with transient ultrasoft AGN behavior, the combination of the expected number of background AGNs with the high X-ray–to–optical flux ratios makes it unlikely (probability ) that Source 110 is a transient ultrasoft AGN.
5. Conclusions
Our multi-epoch Chandra observations were planned to shed light on LMXB variability in NGC 4697, the nearest, optically luminous, elliptical galaxy. We measure variability on timescales of seconds to years. Although we do not detect any periodic LMXBs at significant levels, we detect five sources with significant variability on timescales of seconds to hours (Source 57, 71, 75, 155, and 156).
When we compare the luminosities of sources between every pair of observations, we determine that of the Analysis Sample sources are variable over timescales of – days. There is a slight increase in the fraction of variable sources with the variability timescale, but it is not found to be statistically significant. Our number is roughly consistent with that found for Centaurus A for a variability timescale of (Kraft et al. 2001) and for NGC 4636 for a day timescale, but is lower than that found for a timescale in NGC 4636 (Posson-Brown et al. 2008). New multi-epoch observations of NGC 1023, NGC 3379, NGC 4278, NGC 4365, and Centaurus A will help fill in more variability timescales. As this phase space is populated, we will be able to test if more sources are variable on longer timescales than shorter timescales. Increased knowledge of the temporal evolution of variability will impact models that explore the nature of the observed LMXBs (e.g., Piro & Bildsten 2002).
We are more sensitive to variability when we consider all five observations simultaneously. We find that of Analysis Sample sources do not have a constant luminosity over all five observations. If we apply a similar requirement for a source to be considered variable to the Brassington et al. (2008) analysis of LMXBs in NGC 3379 as in this study, we find that the number of variable sources is , consistent with what we find for NGC 4697. The fraction of GC-LMXBs that are variable is statistically indistinguishable from the fraction of variable Field-LMXBs in our sample due to the small number of variable sources. To better test for any difference between the two populations, multi-epoch variability from multiple galaxies will need to be combined.
For the detected sources we group observations into sets of luminosity and hardness ratio states. Among these variable sources, we identify eleven transient candidates. If we assume all the LMXBs in NGC 4697 are long-term transients, we estimate that they are on for and have a 7% duty cycle. The latter is comparable to the duty cycle obtained comparing active and quiescent LMXBs in Galactic GCs (Heinke et al. 2003).
The mean outburst duration for LMXBs in NGC 4697 of is consistent with a lower limit of found for 33 luminous LMXBs in NGC 1399 and M87 that had X-ray luminosities exceeding ergs s-1 (Irwin 2006). These 33 sources were assumed to be BH-LMXBs because of their sustained super-Eddington luminosities over several year timescales, and most likely represent extragalactic analogs of the Milky Way X-ray binary GRS1915+105. Since a majority of the sources in NGC 4697 are probably NS-LMXBs, there does not appear to be a measurable difference between the outburst durations of long-term transient NS-LMXBs and BH-LMXBs.
We also find four sources with a combined luminosity/spectral transition, only one of which is likely associated with NGC 4697. One limit to our ability to detect such sources is the duration of our single observations. Although observations of NGC 3379 and NGC 4278 have longer single observation durations, this issue is likely to be best addressed by a recently completed set of six, 100 ks observations of Centaurus A, which is at least 2.5 times closer than any other massive early-type galaxy.
Source 110 is clearly a supersoft transient source with no detected counterpart in HST observations. Although it only has X-ray counts, our spectral analysis rules out the possibility that this source is a luminous supersoft WD. The high X-ray–to–optical flux ratio and relative small number of expected background AGNs argue against the source being a transient ultrasoft AGN. Our spectral fit could be consistent with an accreting BH with a mass in the range of –; however, the origin of such a large BH outside of the galaxy center or a GC is a formidable challenge to our current theories of BH formation. Further observations of NGC 4697 could increase the information we can extract from the spectra of Source 110; however, more work must also be done to increase our understanding of the X-ray spectra of non-stellar-mass black holes.
References
- Balman et al. (1998) Balman, S., Krautter, J., & Oegelman, H. 1998, ApJ, 499, 395
- Binney & Merrifield (1987) Binney, J., & Merrifield, M. 1987, Galactic Astronomy (Princeton, NJ, Princeton University Press), 1–796
- Brassington et al. (2008) Brassington, N. J., Fabbiano, G., Kim, D. ., Zezas, A., Zepf, S., Kundu, A., Angelini, L., Davies, R. L., Gallagher, J., Kalogera, V., Fragos, T., King, A. R., Pellegrini, S., & Trinchieri, G. 2008, arXiv:0711.1289
- Fabian et al. (2004) Fabian, A. C., Ross, R. R., & Miller, J. M. 2004, MNRAS, 355, 359
- Ghez et al. (2000) Ghez, A. M., Morris, M., Becklin, E. E., Tanner, A., & Kremenek, T. 2000, Nature, 407, 349
- Gierliński & Done (2004) Gierliński, M., & Done, C. 2004, MNRAS, 349, L7
- Grupe et al. (2001) Grupe, D., Thomas, H.-C., & Beuermann, K. 2001, A&A, 367, 470
- Güdel (2004) Güdel, M. 2004, A&A Rev., 12, 71
- Heinke et al. (2003) Heinke, C. O., Grindlay, J. E., Lugger, P. M., Cohn, H. N., Edmonds, P. D., Lloyd, D. A., & Cool, A. M. 2003, ApJ, 598, 501
- Heise et al. (1994) Heise, J., van Teeseling, A., & Kahabka, P. 1994, A&A, 288, L45
- Irwin (2006) Irwin, J. A. 2006, MNRAS, 371, 1903
- Jordán et al. (2004) Jordán, A., et al. 2004, ApJ, 613, 279, J2004
- Kahabka & van den Heuvel (1997) Kahabka, P., & van den Heuvel, E. P. J. 1997, ARA&A, 35, 69
- Kong & Di Stefano (2005) Kong, A. K. H., & Di Stefano, R. 2005, ApJ, 632, L107
- Kraft et al. (2001) Kraft, R. P., Kregenow, J. M., Forman, W. R., Jones, C., & Murray, S. S. 2001, ApJ, 560, 675
- Loewenstein et al. (2005) Loewenstein, M., Angelini, L., & Mushotzky, R. F. 2005, Chinese Journal of Astronomy and Astrophysics Supplement, 5, 159
- Makishima et al. (2000) Makishima, K., et al. 2000, ApJ, 535, 632
- Mitsuda et al. (1984) Mitsuda, K., et al. 1984, PASJ, 36, 741
- Muno et al. (2003) Muno, M. P., Baganoff, F. K., Bautz, M. W., Brandt, W. N., Garmire, G. P., & Ricker, G. R. 2003, ApJ, 599, 465
- Orio et al. (2007) Orio, M., Zezas, A., Munari, U., Siviero, A., & Tepedelenlioglu, E. 2007, ApJ, 661, 1105
- Perola et al. (1986) Perola, G. C., et al. 1986, ApJ, 306, 508
- Pietsch & Haberl (2005) Pietsch, W., & Haberl, F. 2005, A&A, 430, L45
- Piro & Bildsten (2002) Piro, A. L., & Bildsten, L. 2002, ApJ, 571, L103
- Posson-Brown et al. (2008) Posson-Brown, J., Raychaudhury, S., Forman, W., Donnelly, R. H., & Jones, C. 2008, arXiv:astro-ph/0605308
- Puchnarewicz et al. (1992) Puchnarewicz, E. M., et al. 1992, MNRAS, 256, 589
- Remillard & McClintock (2006) Remillard, R. A., & McClintock, J. E. 2006, ARA&A, 44, 49
- Rutledge et al. (2002) Rutledge, R. E., Bildsten, L., Brown, E. F., Pavlov, G. G., Zavlin, V. E., & Ushomirsky, G. 2002, ApJ, 580, 413
- Sarazin et al. (2000) Sarazin, C. L., Irwin, J. A., & Bregman, J. N. 2000, ApJ, 544, L101, Paper I
- Sarazin et al. (2001) —. 2001, ApJ, 556, 533, Paper II
- Sivakoff et al. (2004) Sivakoff, G. R., Sarazin, C. L., & Carlin, J. L. 2004, ApJ, 617, 262
- Sivakoff et al. (2005) Sivakoff, G. R., Sarazin, C. L., & Jordán, A. 2005, ApJ, 624, L17, Paper III
- Swartz et al. (2002) Swartz, D. A., Ghosh, K. K., Suleimanov, V., Tennant, A. F., & Wu, K. 2002, ApJ, 574, 382
- Tanaka & Shibazaki (1996) Tanaka, Y., & Shibazaki, N. 1996, ARA&A, 34, 607
- Treister et al. (2004) Treister, E., et al. 2004, ApJ, 616, 123
| Source | ||||||||||||||
|---|---|---|---|---|---|---|---|---|---|---|---|---|---|---|
| (1) | (2) | (3) | (4) | (5) | (6) | (7) | (8) | (9) | (10) | (11) | (12) | (13) | (14) | (15) |
| 6 | 1.7E-02 | 1.4E-02 | ||||||||||||
| 7 | 3.0E-02 | 2.1E-02 | 4.1E-02 | |||||||||||
| 8 | ||||||||||||||
| 9 | 3.4E-02 | 1.6E-02 | 3.5E-02 | |||||||||||
| 10 | 5.1E-04 | 2.4E-02 | ||||||||||||
| 11aaSource is a transient candidate. | 3.0E-03 | 7.9E-04 | 2.1E-03 | 8.5E-04 | 2.4E-04 | 3.0E-02 | ||||||||
| 15 | 1.8E-02 | |||||||||||||
| 19bbVariations in the QE degradation may be misinterpreted as variability when comparing Observation 0784 to Cycle 5 observations for this supersoft source. | 8.9E-03 | |||||||||||||
| 23 | 1.5E-03 | 2.7E-04 | 4.7E-04 | 9.4E-03 | 2.5E-02 | |||||||||
| 25bbVariations in the QE degradation may be misinterpreted as variability when comparing Observation 0784 to Cycle 5 observations for this supersoft source. | 3.1E-07 | 7.9E-08 | 1.9E-03 | 5.1E-03 | 7.8E-06 | |||||||||
| 26 | 6.3E-03 | 2.5E-02 | ||||||||||||
| 28 | 2.1E-02 | |||||||||||||
| 31 | 2.9E-02 | 3.7E-02 | ||||||||||||
| 34 | 4.0E-02 | |||||||||||||
| 37aaSource is a transient candidate. | 6.8E-11 | 6.1E-07 | 1.9E-06 | 7.6E-04 | 2.8E-05 | |||||||||
| 39 | 1.3E-05 | 3.7E-06 | 2.5E-04 | 1.7E-04 | 6.8E-05 | |||||||||
| 41aaSource is a transient candidate. | 2.6E-03 | 2.8E-02 | 2.7E-02 | |||||||||||
| 45 | 1.4E-05 | 3.4E-05 | 1.1E-04 | 3.3E-08 | 3.0E-04 | |||||||||
| 48 | 6.5E-04 | |||||||||||||
| 51aaSource is a transient candidate. | 1.1E-02 | 2.0E-02 | 2.5E-04 | 1.0E-03 | 4.7E-07 | 9.2E-06 | ||||||||
| 52 | 2.3E-02 | 2.0E-02 | ||||||||||||
| 53 | 8.7E-03 | |||||||||||||
| 58 | 1.5E-02 | |||||||||||||
| 59 | 2.9E-02 | |||||||||||||
| 60 | 1.2E-02 | 2.3E-02 | ||||||||||||
| 63 | 8.8E-03 | 2.9E-02 | ||||||||||||
| 66 | 1.5E-02 | 2.5E-03 | ||||||||||||
| 67aaSource is a transient candidate. | 3.9E-06 | 1.0E-15 | 6.4E-09 | 8.4E-06 | 1.0E-15 | |||||||||
| 68aaSource is a transient candidate. | 1.4E-03 | 3.1E-12 | 4.3E-02 | 3.2E-02 | 1.0E-15 | 2.9E-03 | 1.0E-15 | 5.4E-08 | 4.1E-03 | 1.0E-15 | ||||
| 69 | 3.1E-02 | |||||||||||||
| 75 | 1.0E-02 | 1.2E-02 | 2.9E-03 | |||||||||||
| 77aaSource is a transient candidate. | 7.0E-10 | 2.4E-04 | 3.6E-13 | 6.8E-05 | 2.5E-02 | 3.3E-06 | 4.3E-15 | |||||||
| 78bbVariations in the QE degradation may be misinterpreted as variability when comparing Observation 0784 to Cycle 5 observations for this supersoft source. | 1.3E-05 | 5.9E-07 | 2.1E-05 | 8.5E-05 | 1.1E-04 | |||||||||
| 79 | 2.8E-04 | 3.4E-02 | ||||||||||||
| 81 | 3.5E-02 | |||||||||||||
| 94aaSource is a transient candidate. | 1.6E-03 | 1.9E-04 | 1.6E-02 | 7.6E-06 | 6.9E-04 | |||||||||
| 97 | 2.5E-02 | |||||||||||||
| 98 | 7.1E-04 | 3.6E-02 | 2.5E-03 | 3.8E-03 | ||||||||||
| 99 | 1.4E-02 | |||||||||||||
| 100 | ||||||||||||||
| 101 | 4.3E-02 | 4.5E-03 | 1.9E-02 | 5.8E-03 | ||||||||||
| 102 | 4.1E-02 | 2.4E-02 | ||||||||||||
| 103 | 2.9E-02 | 1.8E-02 | 2.7E-04 | |||||||||||
| 104 | 8.1E-04 | 2.4E-03 | 2.7E-03 | 6.2E-04 | 2.9E-02 | |||||||||
| 106 | 3.6E-02 | |||||||||||||
| 108 | 1.4E-02 | |||||||||||||
| 110aaSource is a transient candidate. | 1.0E-15 | 1.0E-15 | 1.0E-15 | 1.0E-15 | 1.0E-15 | |||||||||
| 114 | 9.7E-03 | 3.4E-02 | 5.6E-03 | 2.0E-02 | ||||||||||
| 115 | 9.9E-03 | |||||||||||||
| 117 | 1.0E-03 | 8.0E-15 | 2.1E-02 | 1.6E-06 | 1.0E-15 | 3.5E-08 | 1.1E-04 | 1.0E-15 | 1.0E-15 | 5.3E-04 | 1.8E-05 | |||
| 121aaSource is a transient candidate. | 1.1E-04 | 4.1E-03 | 2.4E-04 | 8.2E-05 | 2.9E-03 | |||||||||
| 122 | 9.8E-04 | 3.6E-02 | ||||||||||||
| 124 | 3.9E-02 | |||||||||||||
| 125 | 6.9E-03 | |||||||||||||
| 130 | 1.4E-03 | 5.1E-04 | 3.7E-03 | |||||||||||
| 131 | 4.4E-03 | 2.1E-04 | 1.3E-02 | |||||||||||
| 132 | 1.5E-02 | |||||||||||||
| 133 | 4.1E-02 | |||||||||||||
| 134 | 6.0E-04 | 3.0E-02 | 1.1E-02 | 8.9E-03 | 9.9E-03 | 1.0E-03 | 2.0E-02 | |||||||
| 140 | 3.5E-02 | |||||||||||||
| 142 | 3.8E-02 | |||||||||||||
| 144 | 4.0E-02 | 9.6E-03 | 1.9E-02 | 4.2E-02 | ||||||||||
| 147 | 1.3E-04 | 7.8E-03 | 4.8E-03 | |||||||||||
| 151 | 1.4E-02 | |||||||||||||
| 152 | 3.9E-03 | |||||||||||||
| 155 | 2.2E-03 | 1.9E-02 | 7.7E-03 | |||||||||||
| 156 | 1.1E-07 | 9.0E-04 | 8.5E-07 | 4.2E-02 |
Note. — Observations 0784, 4727, 4728, 4729, 4730 are indicated by A, B, C, D, and E, respectively. The subscripts to the probability, , indicate the parameter (luminosity or hardness ratio) and the observations a source is variable over, while the value of indicates the probability that the observed variability is due to a statistical fluctuation.
| Source | Obs.State | ||||
|---|---|---|---|---|---|
| (1) | (2) | (3) | (4) | (5) | (6) |
| States Determined by Luminosity Selection | |||||
| 11 | ABCD | ||||
| E | |||||
| 23 | ABCD | ||||
| E | |||||
| 25 | A | ||||
| BCDE | |||||
| 37 | ABCD | ||||
| E | |||||
| 39 | A | ||||
| BCDE | |||||
| 41 | A | ||||
| BCDE | |||||
| 45 | A | ||||
| BCDE | |||||
| 51 | ABC | ||||
| DE | |||||
| 67 | A | ||||
| BCDE | |||||
| 68 | AE | ||||
| BC | |||||
| D | |||||
| 77 | AB | ||||
| CDE | |||||
| 78 | A | ||||
| BCDE | |||||
| 79 | ACDE | ||||
| B | |||||
| 94 | ABC | ||||
| DE | |||||
| 98 | AE | ||||
| BCD | |||||
| 104 | ABCD | ||||
| E | |||||
| 110 | ABCD | ||||
| E | |||||
| 114 | ABD | ||||
| CE | |||||
| 117 | AC | ||||
| BE | |||||
| D | |||||
| 121 | A | ||||
| BCDE | |||||
| 122 | A | ||||
| BCDE | |||||
| 130 | ABD | ||||
| CE | |||||
| 131 | ABCD | ||||
| E | |||||
| 134 | ACE | ||||
| BD | |||||
| 144 | ABD | ||||
| CE | |||||
| 147 | BCE | ||||
| D | |||||
| 155 | BC | ||||
| D | |||||
| 156 | B | ||||
| CD | |||||
| States Determined by Selection | |||||
| 11 | ABE | ||||
| CD | |||||
| 63 | ACD | ||||
| BE | |||||
| 103 | AC | ||||
| BDE | |||||
| 134 | AE | ||||
| BCD | |||||
| 140 | AD | ||||
| BCE | |||||
| 152 | AC | ||||
| BD | |||||
| 156 | B | ||||
| CD | |||||
| States Determined by Selection | |||||
| 10 | ABCE | ||||
| D | |||||
| 48 | ACDE | ||||
| B | |||||
| 58 | ABCE | ||||
| D | |||||
| 66 | ABCE | ||||
| D | |||||
| 102 | ABCE | ||||
| D | |||||
| 117 | ABCE | ||||
| D | |||||
| 134 | ABE | ||||
| CD | |||||
| States Determined by Selection | |||||
| 10 | ABCE | ||||
| D | |||||
| 66 | AD | ||||
| BCE | |||||
| 81 | ABD | ||||
| CE | |||||
| 102 | ACE | ||||
| BD | |||||
| 117 | ABCE | ||||
| D | |||||
| 134 | ABDE | ||||
| C | |||||
| 151 | A | ||||
| E | |||||