A new Comptonization model for low-magnetized accreting neutron stars in low mass X-ray binaries
Abstract
We developed a new model for the X-ray spectral fitting xspec package which takes into account the effects of both thermal and dynamical (i.e. bulk) Comptonization. The model consists of two components: one is the direct blackbody-like emission due to seed photons which are not subjected to effective Compton scattering, while the other one is a convolution of the Green’s function of the energy operator with a blackbody-like seed photon spectrum. When combined thermal and bulk effects are considered, the analytic form of the Green’s function may be obtained as a solution of the diffusion Comptonization equation. Using data from the BeppoSAX, INTEGRAL and RXTE satellites, we test our model on the spectra of a sample of six persistently low magnetic field bright neutron star Low Mass X-ray Binaries, covering three different spectral states. Particular attention is given to the transient powerlaw-like hard X-ray ( keV) tails that we interpret in the framework of the bulk motion Comptonization process. We show that the values of the best-fit -parameter, which represents the importance of bulk with respect to thermal Comptonization, can be physically meaningful and can at least qualitatively describe the physical conditions of the environment in the innermost part of the system. Moreover, we show that in fitting the thermal Comptonization spectra to the X-ray spectra of these systems, the best-fit parameters of our model are in excellent agreement with those of comptt, a broadly used and well established xspec model.
Subject headings:
stars: individual: Sco X–1, GX 17+2, Cyg X–2, GX 340+0, GX 3+1, GX 354–0 — stars: neutron — X-rays: binaries — accretion, accretion disks1. Introduction
The study of the transient hard X-ray tails in neutron star (NS) Low Mass X-ray Binaries (LMXBs) has recently received a strong theoretical impulse. The first approach has been mainly phenomenological, with the hard tails simply fitted by a powerlaw (pl) model (see review by Di Salvo & Stella 2002). Subsequently, using 0.4-120 keV BeppoSAX data, Farinelli et al. (2005, hereafter F05) tried a more physical approach, describing the hard tail of GX 172 by means of Comptonization of soft ( 0.6 keV) seed photons off a hybrid (thermal plus non-thermal) electron population. More recently, Paizis et al. (2006, hereafter P06), using long-term time-averaged INTEGRAL/IBIS spectra ( 20 keV), confirmed the presence of hard X-ray emission in the Z sources Sco X–1, GX 5–1, GX 172, GX 3400, Cyg X–2, and they also discovered it in the atoll source GX 131, which, in fact, is characterized by a stable Z-like X-ray continuum (thermal component with low electron temperature and high optical depth ).
Motivated by observations of the intermediate and soft states of black hole candidates (BHCs), P06 proposed that bulk motion Comptonization can be responsible for the formation of the well-known hard X-ray tails in NSs observed in these sources as well. In their analysis, they used the Bulk Motion Comptonization (bmc) model in xspec, whose description is reported in Titarchuk et al. (1996, 1997, hereafter TMK96 and TMK97, respectively). Moreover, merging their results with those of Falanga et al. (2006, hereafter F06) on the atoll source 4U 1728–34 (GX 354–0), P06 identified four main spectral states for NS LMXBs (see Fig. 4 in P06): hard/pl state (H 1750–440 and H 1608–55), low/hard state (GX 354–0), intermediate state (e.g., GX 5–1) and very soft state (e.g., GX 31). In their picture, the relative contribution of thermal and bulk Comptonization (TC and BC, respectively), in turn related to the accretion rate and the radiation pressure from the NS, is the main parameter explaining both the different spectral states among several sources and the spectral evolution of a single source. However, the lack of data below 20 keV prevented P06 from drawing more stringent conclusions on the accretion geometry of the systems and on the physical parameters.
Re-analyzing broad-band BeppoSAX data, Farinelli et al. (2007, hereafter F07) applied the bmc model to GX 172. They found that the source spectrum can be described by a blackbody (bb)-like emission, plus an unsaturated TC component plus a pl. The TC component, fitted with the comptt model (Titarchuk 1994, hereafter T94), is suggested to come from the region (called transition layer, TL) between the Keplerian accretion disk and the NS surface, while the pl-like emission is attributed to BC of the NS seed photons on the in-falling material, which is in turn the innermost part of the TL itself. This accretion scenario proposed by F07 is supported by results obtained by numerical solutions of the equation for the radial velocity profile in accretion disks (Titarchuk & Farinelli 2008, hereafter TF08, in preparation), where the quasi free-fall behaviour of inside the TL from some radius to the NS surface, is unambiguously shown.
It is thus evident that BC is gaining strong theoretical and observational support in the study of LMXB spectral evolution. This is true also for the case of accretion powered X-ray pulsars for which a new theoretical model based on TC and BC, occurring in the accreting shocked gas, was recently presented (Becker & Wolff, 2007, hereafter BW07). In the BW07 Comptonization model the effects of the strong magnetic field ( G) are very important, as the accreting gas column is channelized at the NS magnetic poles and the presence of this field also has important consequences for the photons propagating through the plasma.
From the observational point of view, the energy index and the cutoff energy are only parameters which can be determined by fitting the observable spectral shapes to the Comptonization models; additional assumptions have to be adopted however in order to relate them to the physical parameters of the particular models.
However in this Paper we concentrate in the study of sources where the magnetic field is low, so that it has second-order effects with respect to radiation pressure in driving the accretion process. For a such class of low-magnetized compact objects, in the current xspec package it is available the bmc model, which was used, as mentioned above, by P06. It is in fact a general Comptonization model, i.e. widely applicable, given that the output emerging Comptonized spectrum is given by the convolution of the analytical approximation of the Green’s function (response of the system to injection of a monochromatic line at energy ) with a bb seed photon spectrum, regardless of the Comptonization process, i.e. only due to thermal or combined thermal and bulk effect.
The bmc model parameters are the bb seed photons color temperature () and normalization, the energy index of the Comptonized spectrum and the illumination factor . The information on the efficiency of the Comptonization is carried-out by the index : the lower , the higher the energy exchange from hotter electrons to softer seed photons. As we mention above, does not specify which kind of Comptonization process produces it, but it is simply related to an observable quantity in the photon spectrum of the data. The Green’s function of the model is approximated by a broken pl, a condition that holds when the average energy of the seed photons is much lower than the average energy of the plasma (Sunyaev & Titarchuk 1980, hereafter ST80, and TMK97). The bmc model however lacks the electron recoil-effect term in the Green’s function, which is responsible for the rollover in the spectrum (the energy of the rollover, depending on the plasma temperature and on the first and second order of the bulk velocity, at about ).
Thus the Comptonized part of the emerging spectrum is in the bmc model always a pl with no cutoff. However the lack of the energy cutoff in the model becomes critical in fitting of the TC spectra of LMXBs in their high-luminosity state, when the rollover is well observed around 10 keV.
Motivated by these limitations in the currently available version of the bmc model for xspec and by the recent observational results on LMXBs (see above), we developed a new model for xspec which can be considered as an extension and completion of bmc. In Section 2 we summarize the main results of the Bulk Motion Comptonization theory and show the mathematical background of our model. In Section 3 we show the results of the X-ray spectral fitting using our model on a sample of six persistently bright NS LMXBs. In Section 4 we discuss the main results and the limits of applicability of the model itself, with a breif theoretical comparison to the model of BW07, and in Section 5 we draw our conclusions.
2. Description of the model
2.1. Solution of the Comptonization equation for bulk flow of non-relativistic electrons
The Comptonization equation (a particular type of Fokker-Planck equation, see e.g. T94) describes an evolution of the photon field due to Compton scattering of photons off non-relativistic thermal electrons. It is obtained as the approximation of the full kinetic Boltzmann equation when the photon field is almost isotropic, the average number of scatterings is high and the average energy exchange per scattering is small, namely . When the divergence of the velocity field of the electrons is zero (namely when electrons are subjected to pure Brownian motion) only TC contributes to the total emerging spectrum (ST80). On the other hand, if the plasma flow is subjected to inward bulk motion (), the latter provides a further channel to Comptonization. The Comptonization equation including the bulk motion term was first derived and introduced by Blandford & Payne (1981). A slightly modified version of the equation, which includes the second order bulk term is presented in TMK97. The equation for the photon occupation number in the case of a free-fall velocity profile () reads as
| (1) |
where is a dimensionless energy, is a dimensionless electron temperature, is the accretion rate in units of the Eddington accretion rate, is the inverse of scattering free path of electron and is the optical depth. The term in equation (1) is a function of and and represents the seed photons source function and , .
The quantity of interest in the above equation is the bulk parameter , which is derived in TMK97 as
| (2) |
where is the fractional Eddington luminosity impinging on the flow.
It is worth noting that in equation (1), the term depends on through the bulk term . Given that depends on it is possible to find an analytical solution of the equation (using the separation of variables method) only neglecting the term, namely by setting =1. In this case the Green’s function = (see also Eqs. [B4]-[B8] in TMK97) with given by
| (3) |
Here is energy index, = and , represent the dimensionless scattered and injected photon energies, respectively, namely , . This is in fact the complete form of the Green’s function for the Comptonization equation, while in equation (22) of TMK97 it is reported the asymptotic case of low-energy ( 1) monochromatic line injection. The dependence of spectral energy index on the model physical parameters , and is presented in equations (7) and (23) of TMK96 and TMK97, respectively. We note that the dependence of on and in equation (3) is implicit through the presence of the first eigenvalue of the space diffusion operator.
In equation (3), is a confluent hyper-geometric function (Abramowitz & Stegun 1970), and is an integral function expressed through the formula
| (4) |
Given that Comptonization conserves the photon number, this photon conservation law can be rewritten as the integral equation for the Green’s function:
| (5) |
Thus the normalization factor in equation (3), which is dependent of the injected line energy reads as
| (6) |
When the energy of the injected line is much smaller than the plasma energy, i.e. when , the Green’s function is a broken pl and (see TMK97).
The emergent Comptonized spectrum is given by the convolution of the Green’s function with if the input spectrum, instead of being a simple monochromatic line, has a continuum shape . Let us consider seed photons distributed according to the law
| (7) |
where and are the electron and seed photon temperatures, respectively, and is the normalization factor. This is evidently a blackbody spectrum if =3. The Comptonization spectrum is thus given by
| (8) |
Given that the two integrals in equation (8) do not have analytic presentation, we have to calculate them numerically. This step is performed using the Gnu Scientific Library111The Gnu Scientific Library is freely available at the web site www.gsl.org package. Note also that in the same equation the functions and are themselves integrals (see Eqs. [4] and [6] ) and thus should be preliminary calculated before putting them into the integral. This embedded integral operation is however very high CPU-time consuming, and it makes the whole convolution process very slow, for xspec running.
To avoid this problem, the integral function in equation (4) is analytically solved at each integration step using the steepest descend method, described in Appendix C of TMK97. This method provides very high accuracy (within few percent) for high -values ( 10), while when is close to zero the discrepancy may reach 10% (depending on the corresponding and -values). To better approximate the integral value when is low, we produced a three-dimensional correction matrix of , and -values (with in the interval 0-10) which provides a correction factor between the numerical and analytical results of integral (4). The correction factor is computed using linear interpolation among the , and -bounds of the grid. The same approach is adopted to compute the normalization constant ; for we simply use the value , while for lower -values we use an interpolation grid. A subsequent numerical check reveals that the photon number is conserved with high accuracy (within few percent) over a very large spanning of the and -values.
2.2. The free parameters of comptb
Following the same approach of the bmc model (TMK96, TMK97), we structure our model as being the sum of two components: one represents the emission of the soft seed photons which are not affected by a noticeable up-scattering in the plasma cloud, while the other one is a result of efficient Comptonization. The emergent spectrum, similarly to bmc, can thus be described as
| (9) |
where (see Eq. [7]) and the convolution is given by equation (8). The free parameters of our model are the seed photon temperature , the index (if =3 seed photons have pure bb spectrum), the Green’s function energy index (see Eq. [3]), the bulk parameter , the temperature of the electrons , the illuminating factor log(A) and the normalization constant . The latter is chosen is such a way that when (and =3) the model simply reduces to the standard bb model for xspec. We note also that must be multiplied by the factor in order to express the flux in physical units (erg cm-2 s-1 keV-1). In equation (9) the factor is the fraction of the seed photon radiation directly seen by the observer, whereas the factor is the fraction of the seed photon radiation up-scattered by the Compton cloud.
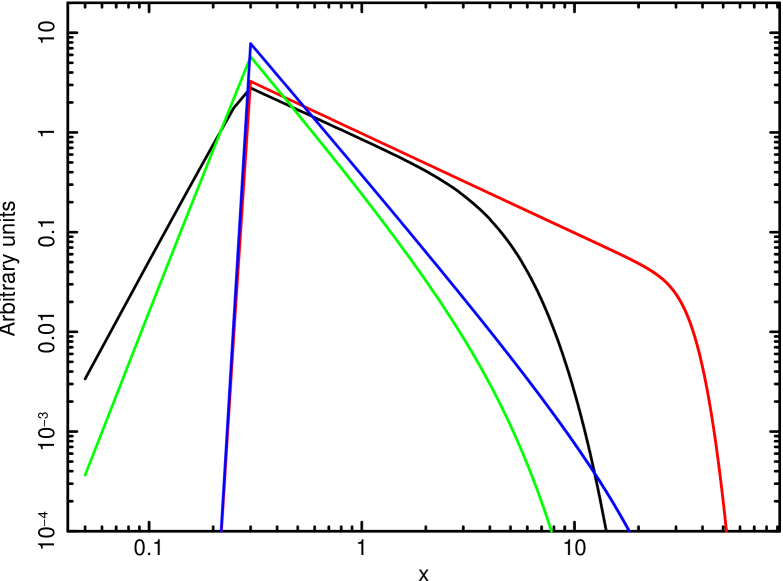
As it can be clearly seen, we expand the parameter set with respect to bmc. In principle, this allows one to extract a more detailed physical information from the observed spectra. In Figure 1 we demonstrate the bulk motion effect presenting the Green’s functions for a couple of -values (1 and 2.5) and two different -values (0 and 30) for each . The cutoff energy is higher for greater -values (see red and blue with respect to black and green curves related to for which =0). Note that the photon number is the same for all . We want also to emphasize however, that our model is not specific to bulk motion: it is evident indeed from equations (3) and (9) that setting and =0, a pure TC spectrum is reproduced, like the mostly used models compst (ST80) and comptt (T94).
It is also important to point out the difference between the standard ones and our Comptonization model. In our case the code provides, as the best-fit parameters, the electron temperature and the energy spectral index instead of and optical depth as in compst and comptt. Thus, once and are provided, it is possible to infer the Thomson optical depth using the relations reported in Titarchuk & Lyubasrkij (1995, hereafter TL95) for both spherical and slab geometry of the Comptonizing plasma. For example, in the non-relativistic limit the following equation holds:
| (10) |
where is the optical radius of the sphere and optical half-thickness of the slab for spherical and plane geometries, respectively, =3 for a sphere and =12 for a slab. When bulk is present ( 0), the relation between , and is not straightforward and must be calculated numerically (see TMK97).


| Parameter | Sco X–1 | GX 172 | Cyg X–2 | GX 3400 | GX 3+1 | GX 354–0 |
| [0.18] | 2.43 | 0.29 | 7.92 | [1.7] | [3.0] | |
| bb | ||||||
| (keV) | – | 1.57 | 1.18 | 1.40 | – | – |
| (km) | – | 4.6 | 8.0 | 6.5 | – | – |
| comptt | ||||||
| (keV) | 1.08 | 0.55 | 0.17 | 0.43 | 0.62 | 1.18 |
| (keV) | 2.75 | 3.37 | 2.79 | 2.80 | 2.54 | 31.1 |
| 4.9 | 5.9 | 6.9 | 9.2 | 5.3 | 1.5 | |
| powerlaw | ||||||
| 4.15 | 2.75 | 2.52 | 3.41 | – | – | |
| 524 | 1.75 | 0.33 | 8.4 | – | – | |
| gaussian | ||||||
| (keV) | – | 6.70 | 6.78 | 6.79 | [6.4] | – |
| (keV) | – | 0.24 | 0.21 | 0.29 | 1.02 | – |
| – | 5.1 | 2.0 | 3.3 | 13 | – | |
| (eV) | – | 43 | 27 | 48 | 357 | – |
| /dof | 212/167 | 155/144 | 196/152 | 174/137 | 50/42 | 151/131 |
| a Equivalent hydrogen column in units of 1022 cm-2. | ||||||
| b Temperature of the blackbody spectrum. | ||||||
| c Computed assuming isotropic emission and given distance for each source (see text). | ||||||
| d Temperature of the Wien seed photon spectrum of comptt. | ||||||
| e Powerlaw normalization in units of photons cm-2 s-1 keV-1 at 1 keV. | ||||||
| f Total photons in the line in units of 10-3 cm-2 s-1. | ||||||
| Parameter | Sco X–1 | GX 17+2 | Cyg X–2 | GX 340+0 | GX 3+1 | GX 354–0 |
| [0.15] | 2.10 | 0.26 | 6.35 | [1.7] | [3.0] | |
| comptb (thermal: log(A)=8, =0) | ||||||
| (keV) | [0.4] | 0.55 | 0.16 | 0.35 | 0.61 | 1.20 |
| (keV) | 2.66 | 3.38 | 2.74 | 2.95 | 2.61 | 26 |
| 0.96 | 0.93 | 0.83 | 0.86 | 1.26 | 1.69 | |
| CAF(c) | 2.1 | 2.1 | 3.4 | 2.5 | 1.5 | 1.7 |
| comptb (thermal plus bulk) | ||||||
| (keV) | 1.21 | 1.45 | 0.96 | 1.38 | – | – |
| log(A) | -0.47 | 0.28 (-1.00) | 0.26 (-0.14) | -0.44 | – | – |
| 3.63 | 2.37 () | [2.5] | 1.76 | – | – | |
| 63 | 89 (15) | 60 (27) | 52 (23) | – | – | |
| [=] | [=] | [=] | [=] | – | – | |
| gaussian | ||||||
| (keV) | – | 6.69 | 6.77 | 6.73 | [6.4] | – |
| (keV) | – | 0.24 | 0.28 | 0.34 | 0.95( 0.51) | – |
| – | 5.5 | 2.5 | 4.3 | 11 | – | |
| (eV) | – | 47 | 39 | 62 | 286 | – |
| L erg s-1 | 3.65 | 1.53 | 0.96 | 1.42 | 0.19 | 0.06 |
| L/Ltot | 0.79 | 0.86 | 0.74 | 0.90 | – | – |
| /dof | 214/165 | 158/143 | 189/152 | 182/136 | 48/42 | 155/131 |
| a Equivalent hydrogen column in units of 1022 cm-2. | ||||||
| b Temperature of the comptb blackbody seed photon spectrum (same as in Tab. LABEL:fit_comptt). | ||||||
| c Compton amplification factor, see text for definition. | ||||||
| d Total photons in the line in units of 10-3 cm-2 s-1. | ||||||
| e Estimated in the energy range 0.1-200 keV. | ||||||
3. Application of the model to a sample of LMXBs
In order to test our model, we used a data set from a sample of six LMXBs belonging to the Z and atoll classes (Hasinger & van der Klis 1989): sources of the former class are Sco X–1, GX 172, Cyg X–2 and GX 3400, while GX 354–0 (4U 1728–34) and GX 3+1 belong to the latter one.
The choice of the first four sources was mainly motivated by the fact that they show transient pl-like hard ( 30 keV) X-ray emission over their stable continuum (Sco X–1: D’Amico et al. 2001, P06; GX 172: Di Salvo et al. 2000b, F05, F07; Cyg X–2: Di Salvo et al. 2002, hereafter DS02; GX 3400: Lavagetto et al. 2004, hereafter L04). Other sources, such as GX 5-1 (Asai et al. 1994, Paizis et al. 2005), GX 349+2 (Di Salvo et al. 2001) and, most recently, GX 13+1 (P06) have shown the same high-energy transient behaviour. The stable continuum spectra of these source are usually fitted with a two-component model consisting of a photoelectrically-absorbed bb plus the TC model comptt by T94; when the hard X-ray tail appears, an additional pl is included in the model to fit to the data. The presence of a gaussian emission line around 6.7 keV is also observed in these sources.
The persistent continuum spectrum of the bursting atoll GX 3+1 is very similar to that of classical Z sources, with a Comptonization spectrum characterized by 3 keV and 10 (Oosterbroek et al. 2001, P06) plus contribution from a 1 keV bb-like component. Neither spectral transitions nor hard X-ray tails have been observed up to now in this source.
Finally, the bursting atoll source GX 354–0 is characterized by the presence of different spectral states that correlate with its position on the hardness-intensity diagram (HID). Long-term monitoring performed with INTEGRAL by F06 has shown that in the lower island state of the HID, the source spectrum is quite hard and can be described by a TC spectrum with 30 keV and optical depth 1.5 (assuming slab geometry) with no evidence of soft bb-like emission. As the source moves across the HID, reaching the banana state, the TC spectrum gets softer, with electron temperature dropping to 3 keV (with correspondingly increasing to 5) and simultaneous appearance of a soft ( 0.6 keV) bb-like component which was attributed by F06 to the accretion disk.
Selection of a sample of sources like these thus allows us to test our model over a wide range of spectral states which are experienced by NS LMXBs, as it is also noticed by P06. Following the state terminology of P06, we can apply our model to the intermediate state spectra (Sco X–1, GX 172, Cyg X–2 and GX 3400) where the combined effect of the thermal and bulk Comptonization is suggested to be the origin of the hard X-ray emission, to very soft state spectra (GX 3+1), where thermal Comptonization by a relatively cold plasma ( keV) dominates, and to low/hard state spectra (GX 3540), in which the thermal Comptonization component characterized by relatively hot electron temperature ( 30 keV) dominates.
We refer the reader to P06 for a more complete discussion on the interpretation of the evolution among these spectral states. It is worth noting that the fit of the fourth spectral state identified by P06 (hard/pl state) with comptb (similarly to comptt) will not provide physically meaningful parameters, due to the presence of the non-attenuated pl that results in very high plasma temperatures (hundreds of keV), i.e. out of the regime of validity of the model. The spectral shape can be, in fact, fitted, but the resulting parameters are not physically meaningful (see discussion in Section 4.3).
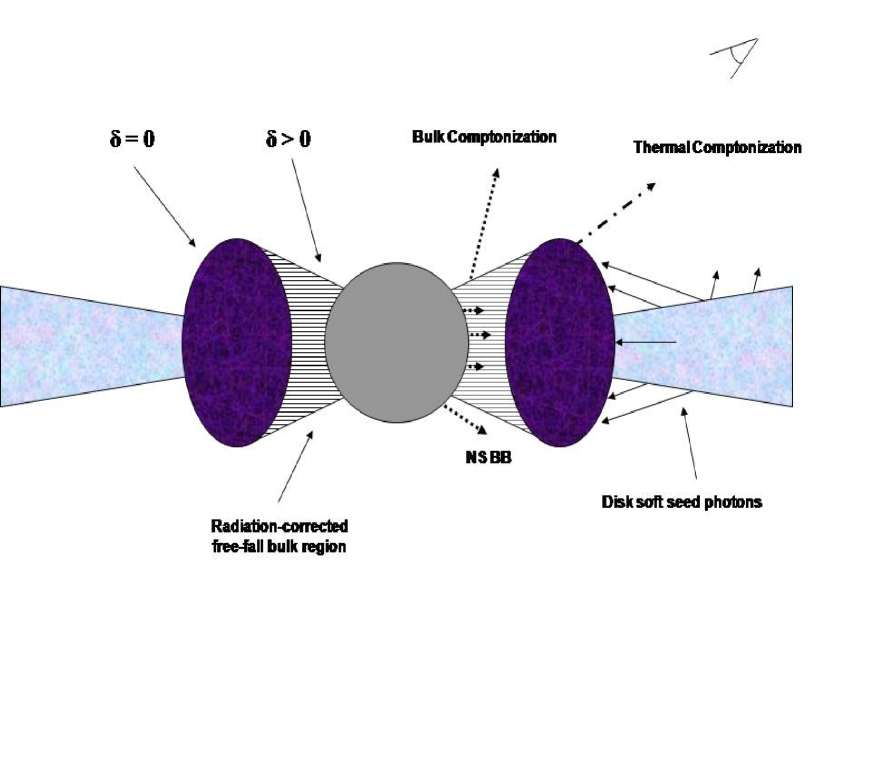
As a complement to the interpretation by P06, in their analysis of GX 172, F07 proposed an accretion scenario in which the bb-like component in the X-ray spectrum arises from the NS surface, while the TC spectrum originates in the outer part of the TL region. The pl-like hard X-ray emission is instead the result of bulk Comptonization of the bb-like (NS) seed photons by the inward in-falling material in the innermost part of the TL (see Fig. 2).
In the analysis of the intermediate state sources, we proceed in the following way: first we fit their spectra with a mostly used multi-component model consisting of a bb plus comptt plus a pl plus, when required, gaussian emission lines (see above). Given that the radial extension of the TL is small compared to its vertical height-scale (e.g., Titarchuk & Osherovich 1999, TF08), so that it can be somewhat approximated to a geometrically thick equatorial belt around the NS, we assumed a slab geometry for comptt for all the sources but GX 354–0, whose spectral state seems to be more related to a quasi-spherical accretion. Using this multi-component model we do not report the unabsorbed bolometric (0.1-200 keV) source fluxes because the presence of the pl component gives origin to a strong bias at low energies, where in fact the flux diverges, and this effect gets worse as the pl steepness increases. It is worth pointing out this problem when one fits spectra with pl components.
Subsequently, we replace comptt with comptb, fixing the illuminating factor to (i.e. =8, corresponding to no direct seed photons emission, see Eq. [9]) and =0 (no bulk contribution); hereafter we call this comptb as thermal comptb. A second comptb is used instead of the bb and pl components, letting, this time, and free to vary during the fit (Table 2). The main idea is that the first comptb should just reproduce the TC spectrum from the outer TL and presumably most of a Comptonized disk component, while the second one takes into account the TC and BC of the NS surface seed photons, which produce the observed pl-like hard X-ray tail. For the low/hard state spectra, GX 354–0, and the high/soft state spectra, GX 3+1, that are characterized by pure thermal Comptonization, the comptt model was replaced by a single thermal comptb (Table 2) with no need for the second, bulk-related, comptb component. For all of the sources, the optical depth of the TC region is later estimated using the comptb best-fit values and and equations (17), (24) in TL95 and then compared to the value reported from comptt (see Table LABEL:fit_comptt).
3.1. Sco X–1
The spectrum of Sco X–1 was obtained from observations of the INTEGRAL satellite (Winkler et al. 2003) using data from the Joint European X-ray Monitor (JEM-X, Lund et al. 2003) and the high-energy imager IBIS/ISGRI (Ubertini et al. 2003, Lebrun et al. 2003). The ISGRI spectrum was obtained by summation of all the INTEGRAL observations of the source in the period 2003-2005 (see P06), while for JEM-X, because of the very high brightness of the source (which may give rise to problems in the standard observing mode of the instrument) we considered a single pointing ( 1800 sec). We thus caution the reader that the high-energy source spectrum ( 20 keV) shows, in fact, the average behaviour of the source.
The inclusion of the JEM-X data at lower energies is very important in order to get a wide energy coverage, which is of key importance to constrain the model parameters. Using these two instruments we can indeed analyze the source spectrum in the energy range 4–150 keV. The lack of data below 4 keV however, does not allow xspec to determine the photoelectric interstellar absorption along the source direction, so we fixed its value to 0.19 cm-2, as found by the Solid-State Spectrometer on-board the Einstein Observatory (Christian & Swank 1997). A simple comptt plus pl model formally would not be completely acceptable from a statistical point of view (/dof=212/167), even though no systematic deviation are observed in the residuals between the data and the model. Moreover, this result is obtained adding a systematic error of 1% to both ISGRI and JEM-X spectra, which is likely below the current uncertainty on the instrument calibrations. If systematics are increased to 2%, we obtain /dof=189/167. The best-fit parameters of the comptt plus pl model are reported in Table LABEL:fit_comptt.
We subsequently use a two-comptb model: in this case, we deal with two seed photon temperatures, which can not be determined simultaneously, because the JEM-X low-energy threshold ( 3 keV) is well above the peak of the softer seed photon temperature usually observed in LMXBs ( 0.5 keV, see Barret 2001).
We thus fix related to the thermal comptb to 0.4 keV, allowing instead to vary the seed photon temperature suggested to be related to the NS surface. The results of the fit with a two-comptb model are reported in Table LABEL:fit_comptb: from the best-fit values and of the thermal comptb component and equations (17) and (24) in TL95, we estimate =5.6, which is not far away from that directly find by comptt ( 5, see Table LABEL:fit_comptt). As it concerns the second comptb component, aimed to describe the hard X-ray tail, we find that the bulk parameter would be pushed up to unreasonably high values by xspec, with no apparent minimum in the space. It is, in fact, just possible to put a lower limit on , as reported in Table LABEL:fit_comptb, whereas good constrains are instead obtained for the seed photon temperature and the energy index . In Figure 3 we report the deconvolved unabsorbed source spectrum and best-fit two-comptb model. For estimating the source 0.1–200 keV luminosity we assumed a distance of 2.8 kpc (Bradshaw et al. 1999).
3.2. GX 172
For GX 172 we use BeppoSAX (Boella et al. 1997a) observations performed on April 3, 1997, when the source was in the left part of the horizontal branch (HB, see Fig. 2 in F07) and a hard X-ray tail was present in the source spectrum. The data set is the same previously used in the analysis by F05 and F07.
Following Di Salvo et al. (2000b) and F05, we fit the 0.4–120 keV source spectrum with a photo-electrically absorbed bb plus TC (comptt) component, plus pl to fit the hard X-ray tail, plus a gaussian emission line around 6.7 keV. The best-fit parameters of the model are reported in Table LABEL:fit_comptt. Assuming a distance from the source of 7.5 kpc (Penninx et al. 1988) and using the best-fit bb temperature and flux, we estimate a bb radius, 5 km. While keeping in mind all the limitations in making such an estimate (i.e. color to effective temperature correction, possible anisotropy in the emission), the order of magnitude of the bb radius supports the idea that this component very likely originates close to the NS surface. The pl photon index is the same already reported in Di Salvo et al. (2000b) and F05.
In the next step, we have good constrains on the best-fit parameters of the pure thermal comptb component using the two-comptb model: they are reported in Table LABEL:fit_comptb. Again, from the thermal and -values, we estimate =5.2, close to 6 found by comptt. The situation is a bit more critical in the thermal plus bulk related comptb component. In particular, for the illuminating factor and the bulk parameter , the lower limits (at 90% confidence level) can be only put by xspec, while, on the contrary, we obtaine only the upper limit on the -value. These statistical uncertainties are mainly related to the small amount of high-energy ( keV) points, as it can be seen in Figure 3, where we report the deconvolved source spectrum with the two-comptb model.
3.3. Cyg X–2
For Cyg X–2 we use a BeppoSAX data set which has been already analyzed by DS02. These data are related to a source observation performed on 1996 July 23. During this observation, the source traced the full HB across its colour-intensity diagram. The HB was divided into two parts (upper and lower HB, respectively, see Fig. 2 of DS02) for which separated spectral analysis was carried out; in both cases a hard X-ray tail was detected.
In this Paper we report results from the upper HB. DS02 fitted the 0.1-100 keV continuum with a multi-colour disk blackbody (diskbb in xspec, Mitsuda et al. 1984) plus comptt plus pl plus two gaussian emission lines at 1 keV and 6.7 keV, respectively. We note however that DS02 used for the Low-Energy Concentrator Spectrometer (LECS, Parmar et al. 1997) the standard on-line available response matrix. The latter may give rise to spurious features when the instrumental count rate exceeds 50 counts s-1. For this Cyg X–2 observation, the LECS count rate is 60 counts s-1, thus requiring the production of an observation-related response function, which was generated using the LEMAT package (v5.0.1).
With the newly produced matrix we establish, in fact, that there is no more strong evidence of the 1 keV emission line. On the other hand, an excess around 2.6 keV is still found in the residuals of both the LECS and the Medium-Energy Concentrator Spectrometer (MECS, Boella et al. 1997b). We fit this excess with a gaussian emission line, even though it is not clear whether its origin may be attributed to the source or arise from some instrumental effect. The results of the fit with a bb plus comptt plus pl model are reported in Table LABEL:fit_comptt. The pl index results steeper than that reported in DS02. This is mainly due to the different response matrix used at low energies ( 4 keV), namely in the region where the interstellar absorption and pl normalization must be simultaneously determined by xspec. We also estimate the bb radius, finding 8 km, for a source distance of 8 kpc.
Replacing the above model with the two-comptb one, similarly to Sco X–1 and GX 17+2, we find very good constraints on the best-fit parameters related to the thermal comptb (see Table LABEL:fit_comptb). As in the previous sources, the optical depths inferred from best-fit and -values, and estimated by comptt are very close each other, ( and , respectively).
As it concerns the thermal plus bulk parameters, unlike Sco X–1 and GX 17+2, where, even though poorly constrained, they can be left free in the fit, there is no way to perform serious analysis leaving all the parameters free. For Cyg X–2 we thus performed spectral fitting in several steps with fixed at each step in the range from 0.5 to 3.5, finding that the minimum in the parameter space is obtained for =2.5. Fixing , just allows us to put lower limit (90% confidence level) for and . In Figure 3 we report the deconvolved source spectrum with the two-comptb models.
3.4. GX 3400
The spectrum of GX 3400 refers to a pointed BeppoSAX observation of the source performed between 2001 August 9 and 10. A more detailed description of the data reduction can be found in L04. The results with the bb plus comptt plus pl model, with an additional gaussian emission line, are reported in Table LABEL:fit_comptt. It is worth pointing out that the comptt model with slab geometry gives a slightly worse result with respect to that with spherical geometry (for which we obtain /dof=160/137). We also want to emphasize the different values of the direct bb and comptt seed photons temperature ( and , respectively) reported in Table LABEL:fit_comptt in comparison with the results of L04. As discussed in F05, the usually adopted model bb plus comptt for description of the persistent continuum spectra of LMXBs, may give rise to a dichotomy in the solutions, given that two solutions (statistically indistinguishable) are possible, one with and the other with . In the former case, the bb-like emission is suggested to mainly come from the NS surface, while in the latter one it is presumably related to the accretion disk. These different interpretations are also suggested by the inferred bb-radii which are of order of the NS radius in the former case or significantly greater ( 78 km in L04) in the latter one. On the basis of the accretion scenario proposed by F07, we prefer the first solution (see Table LABEL:fit_comptt).
The results with the two-comptb model are instead reported in Table LABEL:fit_comptb. In this case, the general considerations on the other three sources can be extended to GX 340+0: the constraints on the best-fit parameters of the thermal comptb component are very good, while they are worse for the thermal plus bulk related one, except for the seed photon temperature. Noticeably, the inferred from the best-fit (thermal) and is lower () than the one directly estimated with comptt (, see Discussion). For the estimation of the bolometric (0.1–200 keV) source luminosity we assumed a distance of 10 kpc (L04).
3.5. GX 3+1
We use the data from the RXTE (Bradt et al. 1993) public archive related to a source observation performed on August 21 2004. A joint spectrum from the second units of the Proportional Counter Array (PCA, Jahoda et al. 2006) and High-Energy X-ray Timing Experiment (HEXTE, Rothschild et al. 1998) on-board the spacecraft was obtained, following the standard procedure for data reduction. At high energies the source was detected by HEXTE only up to 30 keV. Similarly to Sco X–1 INTEGRAL spectra, the low-energy threshold of 3 keV does not allow us to constrain the photoelectric interstellar absorption in the source direction, so we fixed its value to 1.7 cm-2 (Christian & Swank 1997).
We find that a simple photoelectrically-absorbed comptt model is good enough to describe the source continuum spectrum. However, a clear excess in the region 6-7 keV reveals the presence of a iron emission line which is fitted with a simple gaussian. The poor instrumental resolution in this energy region, and the uncertainty calibration of the instrument because of the diffuse Galactic ridge emission, do not allow us to simultaneously constrain all the line parameters. We thus fix the line energy centroid at 6.4 keV during the fit. Because of these uncertainties, both the line broadening and equivalent width values, must be considered with some caution. The best-fit parameters of the comptt plus gaussian model are reported in Table LABEL:fit_comptt.
As in the case of Sco X–1 (see 3.1), the absence of a direct bb-like component in the spectrum is very likely due to a combination of the low-energy PCA threshold (3 keV) and data quality. Subsequently, replacing comptt with thermal comptb, we find the same statistical result, with best-fit values reported in Table LABEL:fit_comptb. The inferred optical depth of the TC region, obtained from best-fit and values, is 4.9, very close to that found by comptt ( 5.3, see Table LABEL:fit_comptt). The bolometric 0.1–200 keV source luminosity is estimated assuming a distance of 5 kpc. We note that this value is certainly underestimated, as it includes the region below 3 keV, not covered by PCA, where a bb-like component has been already observed from the source (Oosterbroek et al. 2001).
3.6. GX 354–0
The spectral analysis on GX 354–0 is carried-out using data obtained by F06 with JEM-X and ISGRI onboard the INTEGRAL satellite. Among the nine spectra extracted by F06 as a function of the source position in the HID, we consider the hardest one (see Fig. 3 and Table 2 in F06). Unlike F06 however, we assume a spherical geometry for the plasma in comptt, given that it seems to be more representative for the hard state accretion scenario. A simple photoelectrically-absorbed comptt model is good enough to fit the source spectrum and no soft X-ray emission is seen in the spectrum.
Replacing comptt with a thermal comptb, we obtain the same results of comptt, both in terms of statistics and as it concerns the agreement between the seed photon and electron temperatures (see Tabs. LABEL:fit_comptt and LABEL:fit_comptb). Using equations (17) and (24) of TL95 for the spherical case, from the best-fit and -values we derive 1.5, which perfectly matches the best-fit value directly obtained from comptt. The source bolometric 0.1–200 keV luminosity was computed assuming a source distance of 5 kpc (Di Salvo et al. 2000a; Galloway et al. 2003). Figure 3 shows the deconvolved source spectrum and superposed best-fit model.
4. Discussion
We present a new model for the X-ray spectral fitting package xspec, named comptb. The principal aim of this model is to provide a more physical description of the transient pl-like hard X-ray ( keV) tails observed in LMXBs, in the framework of the bulk motion Comptonization theory. We recall however that comptb is actually not just specific to bulk motion. Indeed, setting the bulk parameter to zero, it reduces to a generalized thermal Comptonization model, in the same fashion as the widely used models compst or comptt.
4.1. Thermal Comptonization component
In the six sources that we analyzed, the spectra are dominated by a TC component which carries-out most of the total energetic budget (see Table LABEL:fit_comptb and Fig. 3). In the case of GX 3+1 and GX 354–0 this is in fact the only component observed in the X-ray spectrum.
In the GX 3+1 case, this is a result of a low-energy ( 3 keV) threshold effect of PCA, given that a bb-like emission has been previously observed with BeppoSAX (Oosterbroek et al. 2001). On the other hand, in the case of GX 354–0, it is possible that this soft emission was intrinsically absent or very weak in the analyzed spectrum of the source given that it was detected when the source was in the intermediate state (see F06 and also Di Salvo et al. 2000a). F06 attributed the appearance of the soft bb-like emission, in the soft state, to the accretion disk. Instead, in our accretion scenario (as already reported in F05), the bb-like emission is related to the emission from the NS star surface. Independently of the emission region from which it comes, the fact that this component is not observed in the low/hard state spectrum of GX 354–0 is consistent with an accretion geometry where the TC corona is significantly extended and being almost spherical. This spherical configuration should completely cover the central object, intercepting all the seed photons coming from the NS surface.
For all of the studied sources, we compute the Compton amplification factor (CAF) defined as the ratio of the Comptonized to seed photon energy fluxes. Noticeably, the Compton amplification factor (CAF) gets the highest value in Cyg X–2 (3.5), despite the fact that its TC component provides the lowest fractional contribution to the total spectrum among the six studied sources (see Table LABEL:fit_comptb). This is ultimately related to the fact that the seed photon energy is softer ( 0.2) in Cyg X–2 than in the remaining five sources (see Chakrabarti & Titarchuk 1995, for the CAF dependence on the seed photon energy).
It is important to emphasize that the energy index directly provides the efficiency of the Comptonization process (see e.g. Bradshaw et al. 2007, hereafter BTK07), no matter which is the plasma geometry (i.e. slab or sphere). For a given geometry (taking into account hydrodynamical considerations), one can infer Thomson optical depth using the best-fit and values provided by comptb and using equations (17) and (24) in TL95.
We find that the derived values are in very good agreement with those obtained from comptt, except for GX 340+0, where provided from comptt ( 9.2) is higher than that estimated using comptb ( 5.8). This difference likely comes from the slightly different description of the Comptonization by these two models.
4.2. Combined thermal-bulk Comptonization component
The bulk motion Comptonization process as a possible origin of hard X-ray tails in LMXB systems hosting either a NS or a BH has been suggested from both observational (Shrader & Titarchuk 1998; Borozdin et al. 1999; P06, F07) and theoretical (TMK96, TMK97, Laurent & Titarchuk 1999, 2001; TF08) works. A model which can be used to describe these emerging spectra is already present in the xspec package (bmc, TMK97), but as previously discussed in Section 1, it presents some limitations, which are the lack of the electron recoil term (cutoff) in the Green’s function and the parameterization of the high-energy Comptonized component in terms of just the spectral index (no bulk parameter). In fact, index has only information about the efficiency of Comptonization, no matter whether it is purely thermal or due to combined effects of thermal and bulk Comptonization (see TMK97 and BTK07).
We try to overcome these limitations, including the full Green’s function expression (Eq. 3) in our model and using numerical convolution of the Green’s function with the seed photon spectrum (Eq. 8).
One of the advantages of this numerical approach is that the condition (seed photons energy much less than plasma energy and Green’s function approximated by a broken pl, see ST80, TMK97) is not required. This model modification is, in fact, important in the spectra of high-luminosity NS LMXBs, where the seed photon and plasma energy (electron temperature) differ just for a factor of a few (see Tables LABEL:fit_comptt and LABEL:fit_comptb).
We apply our combined thermal plus bulk Comptonization model () to the four LMXBs of our sample which shows a pl-like hard X-ray tail, namely in Sco X–1, GX 17+2, Cyg X–2 and GX 340+0 spectra. In particular, we use a two-comptb model for these sources in which the first comptb takes into account the pure TC part of the spectrum (see previous subsection) while the second comptb describes both the bb-like emission observed at low energies and the pl-like emission above 30 keV. We assumed the same temperature for the thermal and thermal plus bulk Comptonization region. The correctness of this assumption depends on how the two regions are physically and geometrically coupled and whether an actual temperature gradiend does exist on the region where Comptonization occurs.
In the accretion geometry proposed by F07, bulk Comptonization occurs in the innermost part of the transition layer region, while TC is dominant in the outer TL and presumably in some extended region located above the accretion disk. The latter statement is suggested by the lack of a direct soft ( 0.5 keV) bb-like X-ray emission in the spectra, usually attributed to the accretion disk. It is likely that most of the disk emission is up-scattered in the TL or somewhat embedded in the total spectrum, without possibility to split it as a single spectral component. We find some indication of contribution of disk soft seed photons to the TC component using the best-fit values of the BB temperature of these photons. Note this temperature is significantly lower than that of the bb-like seed photon component presumably coming from NS surface (see Tabs. LABEL:fit_comptt and LABEL:fit_comptb for comptt and comptb, respectively). Particularly for Cyg X–2 we obtain a value 0.2 keV, in contrast to higher values of that found by DS02 or by Done & Gierlinski (2003). Higher disk temperatures are also found by Gilfanov et al. (2003) and Revnivtsev & Gilfanov (2006).
However we should point out that all these authors (but DS02) used PCA/RXTE data for which the low-energy band is higher than 3 keV, whereas our best-fit seed photon temperatures are based on the BeppoSAX spectra in the broad energy band from 0.4 to 120 keV. The PCA/RXTE with its low-energy threshold above 3 keV cannot in principle determine any trace of the soft component whose temperature is lower than 1 keV given that its maximum emission ( 3 keV) would still fall outside the PCA energy band. On the other hand the disk photon temperatures of 0.8-1.4 keV found by DS02 is inferred using a response matrix for the low-energy instrument (LECS) which is not correct for such bright sources and thus (as also testified by strong decrease of the 1 keV emission line in our data) must be considered very cautiously.
The uncertainties of the bulk-related parameters of comptb (see Table LABEL:fit_comptb) do not allow us to check the actual differences among them as it concerns their innermost bulk-dominated region given the presence of a few points only at high-energies ( 30 keV) in the spectra of the four intermediate state studied sources (see four upper panels in Fig. 3).
However we should note that in all cases , through which the relative importance of BC to TC is parametrized, is of order of tens, which values are expected in the case of efficient BC, when the hard pl-like emission should be seen. The fact that we can not constrain the upper value (at 90% confidence level) of is not surprising because of the measurement of the high-energy cutoff (not observed in the analyzed spectra) is required.
Indeed, the most important effect of the bulk term in the Green’s function is to push forward the rollover energy, with respect to the pure TC case: higher -values lead to higher energies at which the spectrum exponentially falls down. This can be clearly seen in Figure 1. On the other hand, it is possible to provide only a lower limit of if the high-energy behaviour of the available data goes as an unbroken pl. This is exactly what happens for the INTEGRAL/IBIS spectrum of Sco X-1 (see Fig. 3).
In the case of GX 17+2, Cyg X–2 and GX 340+0, the thermal plus bulk comptb component predicts a rollover of the spectrum in the energy range 100-200 keV (see Fig. 3). However, it is not possible with the present data to really confirm this prediction, even the fact that xspec finds a minimum of in the parameter space could not be indicative of that.
In the thermal plus bulk comptb component, the Green’s function energy index is, for all sources, higher than that obtained for pure TC, with the highest difference observed in Sco X–1. In Figure 1, we plot the Green’s function for monochromatic input line at energy =0.3 (where ), for two different values of (1 and 2.5, respectively) considering pure thermal (=0) and bulk-dominated (=30) cases. The chosen value of is, in fact, representative of the NS local environment condition under this study, as 1 keV and 3 keV (see Tables LABEL:fit_comptt and LABEL:fit_comptb). Looking at Figure 1, one can note that high -values push forwards the high-energy cutoff, as already mentioned above. It is evident that the higher -values related to the BC region with respect to those related to TC region (see Table LABEL:fit_comptt), are indicative of the fact that in the innermost part, for all four sources, the TC efficiency is reduced but the BC effect dominates over the TC one given that the power-law hard tail is detected.
4.3. Limitations and applicability of the model
When one uses comptb to fit the X-ray spectra of NS LMXBs, there are some issues which must be kept in mind.
Let us first consider the case of pure TC spectra (=0 in the Green’s function, see TMK97 and Eq. [3] here). The Green’s function of the model is derived as a solution of the diffusion Comptonization equation, which is in turn obtained as an approximation of the Boltzmann kinetic equation in the diffusion regime. This means that the average photon energy exchange per scattering is small () and photons suffer many scatterings when traveling across the plasma before escaping.
This condition holds when the plasma temperature is about 20–30 keV and less but its optical depth is high, such as observed in the persistent spectra of Z sources and high-luminosities atoll sources (see Barret 2001 for a review). In general most of the NS LMXBs obey this condition, as the strong radiation flux coming from the central object acts as a thermostat in controlling, through Compton cooling, the plasma temperature (Barret et al. 2000).
In the case of BHCs, the situation is quite different and typical hard states for this class of sources are characterized by plasma temperatures of 60 keV (see e.g. Remillard & McClintock 2006) and optical depth a few. In this case, the diffusion approximation should be used with some care (the photon energy exchange for scattering is not so small but the number of scatterings before photons escape is relatively small), and a different treatment of the Compton scattering should be addressed: models such as compps (Poutanen & Svensson 1996), which use iterative scattering numerical procedures are thus most suitable to be used for fitting BHCs hard state spectra. This is one of the reasons why comptb (but also compst or comptt) should be applied preferably to NS LMXBs spectra with plasma temperatures below 20–30 keV. In other cases, BHs or NS in their hard/pl state (see Section 3), the model can just fit the shape of the spectrum: while this may result satisfactory in terms of value, the output parameters should be taken cautiously.
Let us now concentrate on the case where BC dominates over TC (1). The analytical solution of the Comptonization equation (1), for the Green’s function, does exist only neglecting the term, in equation (1), where . Whether this assumption is correct enough, it depends on the local environment conditions close to the central object. In the case of systems hosting a NS, the presence of a firm surface plays a key role in determining the global inward motion of the accreting material. At high accretion rates, the NS surface on one side is the source of a strong radiation pressure due to kinetic energy release of the matter, but on the other hand its mirror-like behaviour (reflecting inner boundary condition) is crucial in determining, at any radius, the pressure gradient due to local gravitational energy release of the in-falling material.
In many cases, these concurring effects may efficiently stop (or strongly decrease) the in-falling matter velocity , thus suppressing the bulk Comptonization effect (and associated hard X-ray tail). Numerical simulations by TF08 show that under this conditions is 0.2 c, and typical in-falling velocities close to the NS surface are 0.1 c. In this case, for an electron temperature =3 keV, it results =0.6.
In the case of BHCs, the different inner boundary condition at the event horizon (e.g, Titarchuk & Fiorito 2004) strongly modifies the radiation pressure behaviour with respect to the NS case, and may lead the inward bulk velocity to get values of 0.3-0.4 in proximity of the last stable marginal orbit, even at accretion rates higher than Eddington limit. Given that the typical temperatures for these states are similar to those of the NS intermediate and very soft states (e.g., Titarchuk & Fiorito 2004), namely 3-5 keV, we derive that may reach a few. The full kinetic treatment should be used to determine the Green’s function for this case (see Titarchuk & Zannias 1998, Laurent & Titarchuk 1999) because the value of and the photon energy change is not small in the bulk flow into BH.
The numerical solution of the Comptonization equation including the second order bulk term shows that it produces two net effects on the the emerging spectrum: it pushes forward the high-energy cutoff and makes higher the Comptonized spectrum normalization (see Fig. 1 in TMK97). In terms of our model parameterization, given that the high-energy cutoff is not observed in the data, we would expect that this higher Compton normalization, actually due to , would be somewhat compensated by a higher illuminating factor value. The model can thus always fit the shape of the spectrum, whereas its best-fit parameters should be taken with some precaution as in the case of pure thermal, high-, TC spectra (see above).
A second issue to be pointed out is how one should define . The analytic form reported in equation (2) is derived for a plasma subjected to a pure free-fall radiation-corrected velocity profile, where only gravity and radiation pressure from the central object are the concurring processes. In particular, if the compact object is a BH, only gravity is present.
The condition where only gravity and radiation pressure are at work holds, in fact, in the case of a optically thin medium, where the radiation flux (from the NS) follows the law. However, it is known that high-luminosity LMXBs systems which show hard X-ray tails (the six known Z sources and, recently, also GX 13+1, see P06) are characterized by high values (mainly inferred from their luminosity), and consequently optically thick environments. In this case, additional (and even dominant) effects due to radiation pressure from local gravitational and kinetic energy releases, viscous energy transportation, gas and magnetic pressure, cannot be neglected. The numerical simulations performed by TF08 show that under these conditions the radial velocity behaviour of the in-falling material deviates from a pure free-fall law across the whole TL. Nevertheless, in the innermost part of the TL itself, gravity and radiation pressure actually dominate and the velocity profile is almost free-fall radiation-corrected like and definition as defined in equation (2) can be almost safely used.
To strengthen this statement, we tried to make a independent -estimation as it would be derived in the optically thin case (see Appendix). It is worth noting that in equation (A3), the only parameter which cannot be directly obtained from the observations is the dimensionless accretion rate . We find the -values 155/, 145/, 178/ and 169/ for Sco X–1, GX 17+2, Cyg X–2 and GX 340+0, respectively. While keeping in mind the issues discussed above, the similarity of the -values, as order of magnitude, between these values and those reported in Table LABEL:fit_comptb is interesting. Higher values of would even reduce this difference.
4.4. Similarities and differences between comptb and BW07 model
As already pointed out in the Introduction, BW07 developed a TC and BC model for accreting X-ray pulsars. The radiative transfer form reported in equation (34) of BW07 is sligthly different from that reported in equation (14) of TMK97, which we adopted in our Paper (see Eq. [1]). The difference mainly arises because of the different assumptions on the velocity profiles in TMK97 and BW07.
A free-fall velocity profile is used by TMK97 which leads to and using the continuity equation (see TMK97 and also TMK96). This result is obtained keeping in mind that the surface through which matter flows scales as .
Instead, in the model of BW07, plasma motion channeled by the strong magnetic field is modelized as a flow passing through a cylindric column whose area does not change with the distance from the NS polar cap (see their Eq. [19]). Using this particular form of the continuity equation BW07 show that . In order to analytically treat (by mean of variable separation) the problem, BW07 assume that and thus . This direct, instead of inverse, proportionality between , and would obviously modify the form of the spatial term in the Comptonization equation when writing it as a function of the optical depth instead of the distance .
Moreover we note that in BW07 optical depth is defined as such that = (where is the Thomson cross-section for photons propagating in parallel direction to the magnetic field lines and is a radial length coordinate), while TMK97 use an effective optical depth, defined such that =1, where is the photon trapping radius. Looking at equations (1) and (5) in TMK97 is evident that with such a parametrization but .
It is worth noting that also BW07 neglect the second order velocity bulk term, which is essential in order to separate Comptonization equation in space and energy. Another important difference between the two models is that BW07 study the BC effect in the presence of a strong magnetic field ( G) which modifies the electron cross section in the photon direction parallel and perpendicular to the magnetic field lines. However it is not our case, as the class of sources we consider are characterized by B-fields of order B G and less (see Titarchuk et al. 2001, for details of B-field determination in LMXBs). For such low magnetic fields the B-field modification of the electron cross-section can be neglected.
However it is remarkable that for both models the Green’s function is a broken pl in the energy band where the recoil effect can be neglected (compare Fig. 3 in our Paper and Fig. 5 in BW07). Also it is common for these two models that the high-energy pl is followed by exponential turnover when the recoil effect is taken into account. It implies that the shape of the emergent spectrum is similar and it can be also fitted by the xspec models comptt and bmc. The main difference is how the pl index of the Green’s function and high-energy cutoff are related to the physical parameters of the particular model. We can consider our models to be somewhat complementary as, starting from the same physical process but in very different enviroments, they are supposed to describe emergent spectra for two classes of NS binary systems.
5. Conclusions
We developed a new model for the X-ray spectral fitting package xspec (comptb) which can be considered a general Comptonization model and more specifically the extension of the previously developed Bulk Comptonization Model (bmc), already present in xspec. Similarly to bmc, our model consists of two components: one represents the bb-like seed photons which escape the plasma cloud without appreciable energy exchange, the other one gives the effectively Comptonized spectrum, obtained as the convolution of the system Green’s function with the seed input photon spectrum.
Using spectra of the BeppoSAX, INTEGRAL and RXTE satellites, we tested the model on a sample of six NS LMXBs which experience different spectral states: intermediate state (Sco X–1, GX 172, Cyg X–2 and GX 3400), where a pl-like hard X-ray component appears over the stable continuum dominated by thermal Comptonization, low-, high- spectrum, a very soft state (GX 31), similar to the previous one but without the pl-like component, and a low/hard state (GX 354–0) where only thermal Comptonization from a hot plasma ( 30 keV, 1.5) is observed in the spectrum.
We find an excellent agreement, as it concerns fitting the TC components, between the best-fit parameters of comptb and those of comptt (the most widely used model to this scope), which confirms the goodness of the code.
On the other hand, one of the most important goals of comptb is to try a more physical approach, in the framework of the bulk motion Comptonization process, in explaining the transient pl-like hard X-ray ( keV) emission observed in NS LMXBs. This is what we have done in analyzing the spectra of the four intermediate state sources. It is worth noting that bulk motion Comptonization is supposed to be at work, with even higher efficiency, also in BH systems in their soft states, where a unbroken pl extended up to MeV energy is usually observed.
We show that the values of the -parameter, which represents the importance of bulk with respect to thermal Comptonization, obtained from the fit, can be physically meaningful and can quantitatively describe the physical conditions of the environment in the innermost part of the NS systems. For three of the intermediate state sources (GX 17+2, Cyg X–2 and GX 340+0) the best-fit model predicts a high-energy cutoff in the spectrum in the energy range 100-200 keV, which is however not possible to confirm on the basis of the present available data.
The next generation of high-energy missions, with their improved sensitivity and extended energy coverage, will definitively address this issue. On the other hand, the theoretical results coming from a full magneto-hydrodynamical treatment of the TL region in NS and BH systems are very promising. We are planning to perform Monte Carlo simulations where the derived radial velocity profiles for NS systems will be of key importance in order to predict the position of the high-energy cutoff due to BC effect, to be then compared with future observations.
Appendix A Estimation of the -parameter from observable quantities
The -parameter for an optically thin accreting plasma is given by
| (A1) |
where is the ratio of the actual to Eddington fluxes at any distance R, is the accretion rate in Eddington units and is the dimensionless electron temperature . In the case of isothermal plasma, given that both F(R) and (R) go as , the parameter is independent of R. Let us define now as the flux measured by the observer at distance D. This is related to the flux at a given distance R by
| (A2) |
Keeping in mind the definition of the Eddington flux = (where =0.4 cm2 g-1 and is the average electron molecular weight, which we assume equal to 1.14 as for solar abundances) and using equation (A2) we may rewrite equation (A1) as
| (A3) |
If we relate to the bb-like flux coming from the NS, then we can estimate using the best-fit comptb parameters, by setting to zero the illuminating factor A, or correspondingly, log(A)1. This would indeed provide just the flux of the direct bb-like component of the spectrum (see Eq. 9). On the other hand the dimensionless parameter can be estimated using the best-fit temperature . Thus, assuming a NS mass =1.4 and if the distance from the source is known, it is possible to estimate as a function of the mass accretion rate , which is the only quantity not directly measurable from the observations.
References
- Abramowits, Stegun (1970) Abramowitz, M., Stegun, I. A., 1970, Handbook of Mathematical Functions (New York: Dover)
- Asai et al (1994) Asai, K., Dotani, T., Mitsuda, K., Nagase, F., Kamado, Y., Kuulkers, E., & Breedon, L. M., 1994 PASJ 46, 479
- Barret et al. (2000) Barret, D., Olive, J. F., Boirin, L., Done, C., Skinner, G. K., & Grindlay, J. E. 2000, ApJ, 533, 329
- Barret (2001) Barret, D. 2001, Adv. Space Res., Vol. 28, p. 307
- Becker & Wolff (2007) Becker, P. A. & Wolff M. T. 2007, ApJ, 654, 435
- Blandford & Payne (1981) Blandford, R. D., & Payne, D. G. 1981, MNRAS, 194, 1033
- Boella et al. (1997a) Boella, G., Butler, R. C., Perola, G.C., Piro, L., Scarsi, L., & Bleeker, J. A. M. 1997a, A&AS, 122, 299
- Boella et al. (1997b) Boella, G. et al. 1997b, A&AS, 122, 327
- Borozdin et al. (1999) Borozdin K., Revnivtsev, M. G., Trudolyubov, S., Shrader, C., & Titarchuk, L. 1999, ApJ, 517, 367
- (10) Bradshaw, C. F., Fomalont, E. B., & Geldzahler, B. J. 1999, ApJ, 512, L121
- Bradshaw et al. (2007) Bradshaw, C. F., Titarchuk, L., & Kuznetsov , S. I. 2007, ApJ, 663, 1225 (BTK07)
- Bradt et al. (1993) Bradt, H. V., Rothschild, R. E., & Swank, J. H. 1993, A&AS 97, 355
- Chakrabarti & Titarchuk (1995) Chakrabarti , S. K. & Titarchuk, L. 1995, ApJ, 455, 623
- Christian & Swank (1997) Christian, D. J., & Swank, J. H. 1997, ApJS, 109, 177
- D’Amico et al. (2001) D’Amico, F., Heindl, W. A., Rothschild, R. E., & Gruber, D. E. 2001, ApJ, 547, L147
- Di Salvo et al. (2000a) Di Salvo, T., Iaria, R., Burderi, L., & Robba, N. R. 2000a, ApJ, 542, 1034
- Di Salvo et al. (2000b) Di Salvo, T., et al. 2000b, ApJ, 544, L119
- Di Salvo & Stella (2000) Di Salvo, T., & Stella, L. 2000, Proceeding of the XXXVIIth Rencontres de Moriond, Eds. A. Goldwurm, D. Neumann, J. Tran Tranh, p. 67
- Di Salvo et al. (2001) Di Salvo, T., Robba, N.R., Iaria, R., Stella, L., Burderi, L., & Israel, G. L. 2001, ApJ, 554, 49
- Di Salvo et al. (2002) Di Salvo, T., et al. 2002, A&A, 386, 535 (DS02)
- Falanga et al. (2006) Falanga, M., Gotz, D., Goldoni, P., Farinelli, R., Goldwurm, A., Mereghetti, S., Bazzano, A., & Stella, L. 2006, A&A, 458, 21 (F06)
- Farinelli et al. (2005) Farinelli, R., Frontera, F., Zdziarski, A. A., Stella, L., Zhang, S. N., van der Klis, M., Masetti, N., & Amati, L. 2005, A&A, 434, 25 (F05)
- Farinelli et al. (2007) Farinelli, R., Titarchuk, L., & Frontera, F. 2007, ApJ, 662, 1167 (F07)
- Galloway et al. (2003) Galloway, D. K., Psaltis, D., Chakrabarty, D., & Muno, M. P. 2003, ApJ, 590, 999
- Gilfanov et al. (2003) Gilfanov, M. R., Revnivtsev, M. G., & Molkov, S. 2003, A&A, 410, 217
- Hasinger & van der Klis (1989) Hasinger, G. & van der Klis, M. 1989, A&A, 225, 79
- Jahoda et al., (2006) Jahoda, K., Markwardt, C. B., Radeva, Y., Rots, A. H., Stark, M. J., Swank, J. H., Strohmayer. T. E., & Zhang, W. 2006 ApJS 163, 401
- Lavagetto et al. (2004) Lavagetto, G., Iaria, R., Di Salvo, T., Burderi, L., Robba, N. R., Frontera, F., & Stella, L. 2004, NuPhS, 132, 616 (L04)
- Laurent & Titarchuk (1999) Laurent, P., & Titarchuk, L. 1999, ApJ, 511, 289
- Laurent & Titarchuk (2001) Laurent, P., & Titarchuk, L. 2001, ApJ, 562, L67
- Lebrun et al. (2003) Lebrun, F., et al. 2003, A&A, 411, L141
- Lund et al. (2003) Lund, N., et al. 2003, A&A, 411, L231
- Mitsuda et al. (1984) Mitsuda, K., et al. 1984, PASJ, 36, 741
- Oosterbroek et al. (2001) Oosterbroek, T., Barret, D., Guainazzi, M. & Ford, E. C., 2001, A&A, 366, 1380
- Paizis et al. (2005) Paizis, A., Ebisawa, K., Tikkanen, T., Rodriguez, J., Chenevez, J., Kuulkers, E., Vilhu, O., & Courvoisier, T. J.-L., 2005, A&A, 443, 599
- Paizis et al. (2006) Paizis, A., et al. 2006, A&A, 459, 187 (P06)
- Parmar et al. (1997) Parmar, A. N., et al. 1997, A&AS, 122, 309
- Penninx et al. (1988) Penninx, W., Lewin, W. H. G., Zijlstra, A. A., Mitsuda, K., & van Paradijs, J. 1988, Nature, 336, 146
- Poutanen and Svensson (1996) Poutanen, J., & Svensson, R., 1996 ApJ470, 249
- Remillard & McClintock (2006) Remillard, R. A., & McClintock, J. E. 2006, ARA&A, vol. 44, 49
- Revnivtsev & Gilfanov (2006) Revnivtsev, M. G., & Gilfanov, M. R. 2006, A&A, 453, 253
- Rothschild et al. (1998) Rothschild, R. E., et al. 1998, ApJ496, 538
- Shrader & Titarchuk (1998) Shrader, C.R., & Titarchuk, L. 1998, ApJ, 499, L31
- Sunyaev & Titarchuk (1980) Sunyaev, R., & Titarchuk, L. 1980, A&A 86, 121
- Titarchuk (1994) Titarchuk, L. 1994, ApJ, 434, 570 (T94)
- Titarchuk & Lyubarskij (1995) Titarchuk, L., & Lyubarskij, R. 1995, ApJ, 450, 876 (TL95)
- Titarchuk, Mastichiadis & Kylafis (1996) Titarchuk, L., Mastichiadis, A., & Kylafis, M.D. 1996, A&AS 120, 171 (TMK96)
- Titarchuk, Mastichiadis & Kylafis (1997) Titarchuk, L., Mastichiadis, A., & Kylafis, M.D. 1997, ApJ, 487, 834 (TMK97)
- Titarchuk & Zannias (1998) Titarchuk, L., & Zannias, T. 1998, ApJ, 493, 863
- Titarchuk et al. (1998) Titarchuk, L., Lapidus, I., & Muslimov, A. 1998, ApJ, 499, 315
- Titarchuk & Osherovich (1999) Titarchuk, L., & Osherovich, V. 2004, ApJ, 518, L95
- Titarchuk et al. (2001) Titarchuk, L., Bradshaw, C.F., & Wood, K. S. 2001, ApJ, 560, L55
- Titarchuk & Fiorito (2004) Titarchuk, L., & Fiorito, R. 2004, ApJ, 612, 988
- Titarchuk & Farinelli (2008) Titarchuk, L., & Farinelli, R. 2008, in preparation (TF08)
- Ubertini et al., (2003) Ubertini, P., et al. 2003, A&A, 411, L131
- Winkler et al., (2003) Winkler, C., et al. 2003, A&A, 411, L1