Sh2-205: I. The surrounding interstellar medium
Abstract
We investigate the distribution of the interstellar matter in the environs
of the H ii region Sh2-205, based on neutral hydrogen 21–cm line data and radio continuum images at 408 and 1420 MHz obtained from the CGPS, 12CO (J=10) observations, high resolution IRAS data (HIRES), and
MSX data.
Sh2-205 can be separated in three independent optical structures: SH 149.25–0.0, SH 148.83–0.67, and LBN 148.11–0.45. The three regions are detected both at 408 and 1420 MHz. The derived spectral indices show the thermal nature of SH 148.83–0.67 and LBN 148.11–0.45.
LBN 148.11–0.45 is a classical H ii region surrounded by an H i shell. The associated neutral atomic and ionized masses are 65 M⊙ and 70 M⊙, respectively. Dust and molecular gas ( 6 104 M⊙) are found related to this ionized region. Particularly, a photodissociation region is detected at the interface between the ionized and molecular regions. If the proposed exciting star HD 24094 were an O8–O9 type star, as suggested by its near-infrared colors, its UV photon flux would be enough to explain the ionization of the nebula.
The optical, radio continuum, and 21–cm line data allow us to conclude that SH 148.83–0.67 is an interstellar bubble powered by the energetic action of HD 24431. The associated neutral atomic and ionized masses are 180 M⊙ and 300 M⊙, respectively. The emission of SH 149.25–0.0 is too faint to derive the dust and gas parameters.
An H i shell centered at (l,b) = (149°0′, –1°30′) was also identified. It correlates morphologically with molecular gas emission. The neutral atomic and molecular masses are 1600 M⊙ and 2.6 104 M⊙, respectively. The open cluster NGC 1444 is the most probable responsible for shaping this H i structure.
keywords:
stars: individual: HD 24431, ALS 7793, and HD 24094 - ism: structure - ism: bubbles1 Introduction
O-type stars emit a large amount of UV photons capable of ionizing the neutral atomic gas and photodissociating molecular material, creating H ii regions (Osterbrock 1989) and photodissociation regions at the interface between the ionized and the molecular gas (Hollenbach & Tielens 1997). H ii regions evolve from ultracompact to classical modifying the characteristics of their natal environment. They appear surrounded by neutral atomic and molecular gas, which generally constitute the remains of their natal clouds. Subsequent dynamical expansion favors the formation of dense low expanding neutral envelopes behind front shocks (Spitzer 1978) where conditions for stellar formation may be fulfilled.
Massive stars also lose mass at rates of 10-6 – 10-7 M⊙ yr-1 with terminal velocities of 1000 - 2000 km s-1 (Prinja et al. 1990; Chlebowski & Garmany 1991; Lamers & Leitherer 1993). Although clumpy stellar winds result in lower mass loss rates (Moffat & Puls 2003), the huge amount of mechanical energy released into the interstellar medium (ISM) through the stellar wind mechanism during the lifetime of a massive star is capable of creating stellar wind bubbles. An outer dense neutral shell will appear between the outer shock front and the ionization front if this last front is trapped within the expanding bubble (Weaver et al. 1977; Lamers & Cassinelli 1999).
The action of massive stars on their surrounding interstellar medium can be analyzed using radio continuum data, which allow us to know the characteristics of the ionized gas. Neutral hydrogen 21–cm line emission and molecular data allow us to investigate the distribution of the neutral atomic and molecular gas in the environs of the stars, while interstellar dust characteristics can be studied through its infrared emission.
Massive stars are the main source of energy injection into the interstellar medium in the Galaxy. This causes the re-distribution of interstellar material by photodynamical and photochemical processes. To improve theoretical scenarios, comprehensive observational studies are necessary. This is possible by achieving complete multiwavelength studies of H ii regions and interstellar bubbles.
To contribute to the knowdledge of the ISM and the processes that modify it, we are carrying out a systematic study of the kinematics and
energetics of the ionized and neutral gas in the environs of massive stars.
In this paper we specially analyze the H ii region Sh2-205 in the region of Camelopardalis based on radio continuum, H i 21–cm line, 12CO line, and infrared data at several wavelengths.
2 The H ii regions and their exciting stars
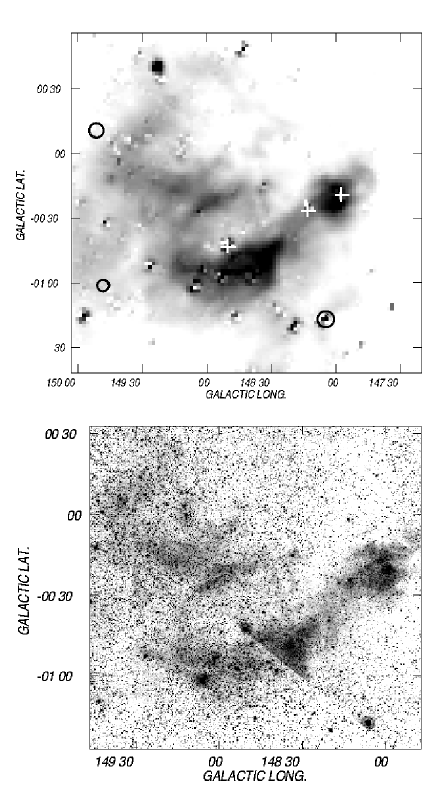
Figure 1 displays the VTSS and DSS-R images of a region of 2°2° centered at (l,b) = (148°40′, –0°20′), showing the H ii region Sh2-205 (Sharpless 1959) of about 120′ in size. The images reveal the presence of diffuse extended emission with two bright areas. One of them consists of an arc-like structure located at (l,b) = (148°45′, –0°50′). The VTSS image shows that the edges of this arc are brighter than the inner region. Along with the fainter optical emission region detected at (l,b) (149°0′, –0°20′), the arc-like feature delineates an almost complete shell centered approximately at (l,b) = (148°50′, –0°40′), of 60′ in diameter. From here on, this structure will be referred to as SH 148.83–0.67.
The exciting star of this H ii region is the O-type star HD 24431 (Sharpless 1959), located at (l,b) = (148°50′, –0°43′), projected close to the center of this structure. This star was classified as O9 IV-V by Hiltner & Johnson (1956) and as O9 III by Walborn (1973). Fabricius et al. (2002), based on Tycho2 data identifies this star as a double system.
Distance determinations for HD 24431 span the range between 710 and 1000 pc (Zdanavičius et al. 2001; Gies 1987; Garmany 1982; Humphreys 1978). Cruz-González et al. (1974) adopted a distance of 2.28 kpc, considering this star to be a member of Persei. However, this open cluster is located at (l,b) = (135°,–3°36′), 14° far from HD 24431. This fact makes its relation to the cluster doubtful.
Table 1 lists the main photometric and astrometric parameters of HD 24431 taken from the literature. The star was related to Cam OB1 ([l,b] = [142°, +2°] of 17 10° in size) by Humphreys (1978) and Garmany (1982). Lyder (2001) carried out an extensive analysis of the optically identified Population I objects in the Cam OB1 region, deriving a distance of 975 90 pc for the OB association. This author, however, does not consider HD 24431 to be a member of Cam OB1. In what follows, we adopt a distance d = 1.0 0.2 kpc for HD 24431, in agreement with previous determinations.
| HD 24431 | ||||||
| l | b | Sp.T. | Vr(LSR) | Distance | ||
| [°] | [°] | [kms-1] | [pc] | Ref. | ||
| 148°50′ | –0°43′ | O9 IV-V 1 | –9.9 2 3 | 957 | 4 | |
| O9 III 2 | 1000 | 3,5 | ||||
| 2280 | 6 | |||||
| ALS 7793 | ||||||
| l | b | Sp.T. | mv | |||
| [°] | [°] | [mag] | ||||
| 148°17′ | –0°26′ | B1 V 1 | 11.1 1 | |||
| HD 24094 7 | ||||||
| l | b | Sp.T. | P | B-V | ||
| [°] | [°] | [days] | [mag] | |||
| 147°58′ | –0°20′ | B8 V | 1.052 | 0.4 | ||
Notes: 1: Hiltner & Johnson (1956); 2: Walborn (1973); 3: Humphreys (1978); 4: Zdanavičius et al. 2001; 5: Gies (1987); Garmany (1982); 6: Cruz-González et al. (1974); 7: Duerbeck (1997).
The other bright extended area shown in Fig. 1 is the conspicuous H ii region centered at (l,b) = (148°5′, –0°28′). This region was catalogued as LBN 148.11–0.45 (43′25′ in size) by Lynds (1965), although it had originally been included in Sh2–205 by Sharpless (1959). Two B-type stars appear projected onto this region. One of them is ALS 7793 ([l,b] = [148°17′, –0°26′]), whose spectral type is B1 (Hiltner 1956). The star is situated onto the border of the H ii region. The other star, HD 24094 (CY Cam, [l,b] = [147°58′, –0°20′]), is seen projected near the center of LBN 148.11–0.45. Based on the Hipparchos catalogue, HD 24094 was identified as a slowly pulsating contact binary by Duerbeck (1997), its primary component being classified as a B8 star. The main parameters of these stars are listed in Table 1. No information about the distances to HD 24094 and ALS 7793 is available. As a working hypothesis, we adopt d = 1.0 0.2 kpc.
Radio studies of the Sh2-205 H ii region have been performed by several authors. Blitz, Fich & Stark (1982) detected a molecular component at –25 1 km s-1 in their CO study of H ii regions, pointing the telescope towards the position (l,b) = (148°504, –1°144). Based on radio continuum data at 1400 MHz with an angular resolution of 10 arcmin, Felli & Churchwell (1972) found two radio sources. One of them, centered at (l,b) = (147°54′, –0°24′), has a flux density of 7.4 Jy and is 307 227 in size. This source spatially coincides with LBN 148.11–0.45. The other radio source was detected at (l,b) = (148°42′, –0°7′), has a flux density of 0.2 Jy, and is 14′ 108 in size. It appears projected onto a region almost free of optical emission.
No radial velocity information corresponding to the ionized gas in the bright regions is available. The only measurement comes from Fabry-Perot H observations obtained by Fich, Dahl & Treffers (1990), who found a radial velocity of –16.8 0.3 km s-1 observing towards the position (l,b) = (147°558, –0°346).
In addition to the above mentioned optical features, a shell-like structure of faint diffuse optical emission is also detected centered at (l,b) = (149°15′, 0°) (from here on SH 149.25–0.00), spread over a circle of 1° in size. No stellar object seems to be related to this feature. This structure, together with the one probably related to HD 24431, were catalogued as LBN 149.02–00.13 by Lynds (1965).
The positions of the open clusters NGC 1496 at (l,b) = (149°51′, +0°11′), NGC 1444 at (l,b) = (148°6′, –1°18′), and King 7 at (l,b) = (149°46′, –1°1′) are indicated in the VTSS image. Their distances are 1.2 kpc (del Rio & Huestamendia 1988), 1.19 kpc (Lindoff 1968), and 2.2 kpc (Durgapal et al. 1997), respectively. Although they are seen projected close to the regions under study, their physical relation to the optical nebulae is doubtful.
3 Data sets
Radio continuum images at 408 MHz and 1420 MHz, and 21–cm H i line emission data were taken from the Canadian Galactic Plane Survey (CGPS) observed with the DRAO Synthesis Telescope, in Penticton, Canada. The CGPS is a high resolution survey of atomic hydrogen and radio continuum emission from the Galaxy. The spectral line observations are presented as data-cubes with 272 spectral channels having a velocity resolution of 1.3 km s-1. Table 2 presents the most important observational parameters of the DRAO data base (Taylor et al. 2003). Both the radio continuum images at 408 MHz and 1420 MHz, and H i line data cube were spatially smoothed to an angular resolution of 2 arcmin.
The radio continuum image at 2695 MHz, obtained using the Effelsberg 100-m telescope with an angular resolution of about 4.3 arcmin and an rms noise of 0.05 K (Fürst et al. 1990), was also analyzed.
Images in the mid and far infrared obtained with the MSX and IRAS satellites were used to investigate the dust emission distribution. The MSX data consist of images at 8.3m
(Band A), 12.1m (Band C), 14.7m (Band D), and 21.3m (Band E), obtained with an angular resolution of 183. The IRAS (HIRES)111IPAC is funded by NASA as part of the IRAS extended mission under contract to Jet Propulsion Laboratory (JPL) and California Institute of Technology (Caltech). data include images at 12, 25, 60, and 100m with angular resolutions in the range 05 to 20. The IRAS images are included in the DRAO dataset.
12CO (J =1 0) data from Dame et al. (2001) were used to analyze the molecular gas distribution in the region. These data have an angular resolution of 7.5 arcmin, a velocity resolution of 1.3 km s-1, and an rms noise of 0.05 K.
| Parameter | Value |
|---|---|
| H i | |
| Synthesized beam | 122 097 |
| rms noise (single channel) [K] | 1.0 |
| Bandwith [MHz] | 1.0 |
| Channel separation [km s-1] | 0.82 |
| Velocity resolution [km s-1] | 1.3 |
| Velocity range [km s-1] | –165, +45 |
| 1420 MHz | |
| Synthesized beam | 103 096 |
| rms noise [K] | 0.06 |
| Bandwith [MHz] | 30.0 |
| 408 MHz | |
| Synthesized beam | 35 28 |
| rms noise [K] | 0.4 |
| Bandwith [MHz] | 4.0 |
4 The gas and dust distributions
4.1 The ionized gas
Figure 2 shows the radio continuum emission distributions at 408 MHz and 1420 MHz (upper panels), and overlays of the radio continuum emissions and the VTSS image (lower panels). The images at both frequencies show emission from LBN 148.11–0.45, and from the shell-like features at (l,b) = (148°50′, –0°40′) and (l,b) = (149°15′, –0°).
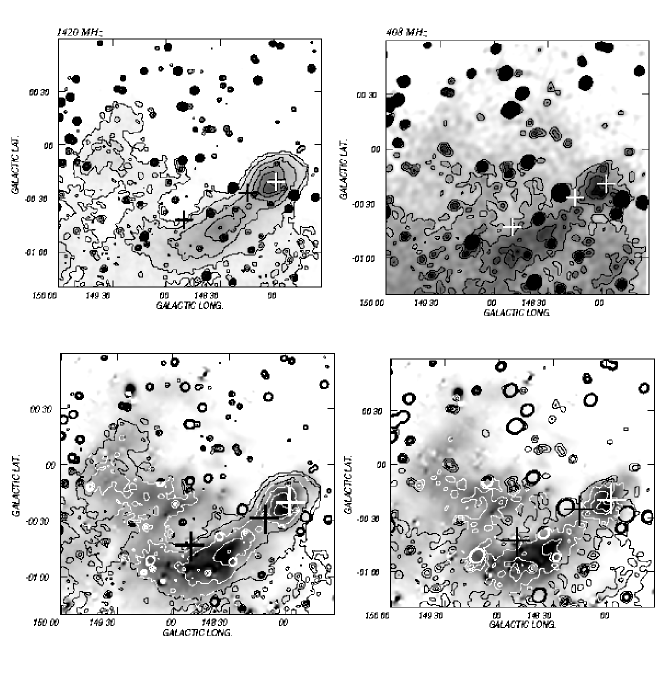
The 1420 MHz radio continuum emission associated with LBN 148.11–0.45 is strong. It consists of an almost circular, centrally picked region, of 30′ 24′ in size. The radio peak at (l,b) = (147°594, –0°25′) does not coincide with the maximum in optical emission at (l,b) = (147°58′, –0°19′).
As regards SH 148.83–0.67 (related to HD 24431), the radio emission at 1420 MHz is smooth and very well defined, with the brighter optical region coincident with the highest radio continuum emission at (l,b) = (148°30′, –0°46′). The borders of the optical arc are brighter than the inner region, with the radio image displaying a rather uniform region instead. This radio emission extends towards the galatic plane, appearing as a diffuse and faint almost complete ring of 13′ in width, and 60′ in diameter, which correlates with the diffuse optical emission in the shell. Due to the lower angular resolution of the image at 408 MHz, the ring is not as well defined as at 1420 MHz. HD 24431 is seen projected onto the inner border of this ring, near one of the bright optical emission regions.
Diffuse radio continuum emission also correlates with SH 149.25–0.00. It is not clear if the two shell-like features, namely SH 149.25–0.0 and SH 148.83–0.67, are linked.
| Position | S1420 | S408 | Source | ||
| l [] | b [] | [mJy] | [mJy] | designation | |
| sources seen onto LBN 148.11–0.45 | |||||
| 147°49′ | –0°28′ | 503 0.93 | 1038 18 | –0.58 0.03 | NVSS J035125+532828 |
| 147°52′ | –0°35′ | 80 0.92 | 167 17 | –0.59 0.17 | NVSS J035107+532041 |
| 147°54′ | –0°25′ | 13.3 0.91 | 14 10 | –0.03 1.25 | NVSS J035205+532753 |
| 148°02′ | –0°33′ | 19.9 0.89 | 39 21 | –0.54 0.92 | NVSS J035210+531621 |
| 148°11′ | –0°28′ | 21.2 0.84 | 60 32 | –0.8 0.2 | NVSS J035320+531453 |
| 147°59′ | –0°11′ | 13 0.9 | 45 27 | –1.0 0.2 | NVSS J035327+533601 |
| sources seen onto SH 148.83–0.67 | |||||
| 148°23′ | –0°24′ | 405.4 1.5 | 1288 19 | –0.92 0.02 | NRRF J035430.6+530759 |
| 148°35′ | –0°39′ | 59.2 1.6 | 177 20 | –0.88 0.16 | 6C B035049.0+524145 |
| 148°37′ | –0°37′ | 17.8 1.5 | 149 62 | –1.7 0.6 | NVSS J035337+530130 |
| 148°28′ | –0°52′ | 70.9 1.6 | 81 19 | –0.12 0.38 | 87GB 034917.6+523604 |
| 148°22′ | –0°47′ | 9.2 1.8 | 17 8 | –0.48 0.57 | NVSS J035256+525159 |
| 148°16′ | –0°58′ | 24.9 1.6 | 14 5 | +0.47 0.51 | NVSS J035651+521521 |
| 149°12′ | –0°51′ | 20.4 1.5 | 419 19 | –0.57 0.074 | 87GB 035303.4+520859 |
| 148°51′ | –0°09′ | 123.4 1.5 | not resolved | 87GB 035414.7+525443 | |
| 148°52′ | –0°14′ | 5.06 0.32 | 18 5 | –1.01 0.34 | NVSS J035748+525933 |
| 148°59′ | –0°21′ | 15.7 1.5 | 35 18 | –0.64 0.2 | NVSS J035751+524924 |
| 148°41′ | –0°58′ | 1.94 0.25 | 33 16 | –2.27 0.68 | NVSS J035347+523208 |
| 148°13′ | –0°59′ | 30.3 1.9 | 30 7 | +0.01 0.36 | NVSS J035115+525046 |
Notes:
Col. 6: References found in NED catalogue:
6C: Hales, Baldwin & Warner (1988),
NVSS: Condon et al. (1998),
87GB: Gregory & Condon (1991),
NRRF: Newberg et al. (1999)
As a first step to derive the physical parameters of the extended radio structures, we have analyzed the small diameter sources projected onto and near the optical emission regions. Their galactic coordinates and derived flux densities measured at 1420 MHz and 408 MHz are listed in Table 3. Their spectral indices (Sν ) derived using fluxes at these frequencies are shown in the fifth column. The sixth column indicates a previous reference to the sources. The derived spectral indices indicate that all but two sources are non-thermal in nature. These results are reinforced by the fact that all sources are identified as extragalactic sources in the NASA Extragalactic Database (NED). Two sources are particularly interesting. One of them, NRRF J035430.6+530759, is a galaxy. The other one, NVSS J035347+523208, has a steep spectral index (-2.27), which could correspond to a pulsar. However, this source is not listed in pulsars’ catalogues (see for example Taylor, Manchester & Lyne (1993).
Flux densities at 2700 MHz, 1420 MHz, and 408 MHz for LBN 148.11–0.45 and SH 148.83–0.67, along with angular and linear sizes, are listed in Table 4. Flux densities corresponding to the small diameter non-thermal sources were substracted from the measured fluxes at 1420 MHz, 408 MHz, and 2700 MHz for the two nebulae. The expected flux density of the non-thermal sources at 2700 MHz was estimated from the spectral index. The spectral indices derived using the resulting flux densities at 408, 1420, and 2700 MHz are listed in Table 4, indicating that the emission originates in thermal bremsstrahlung. We note that the emission at 2700 MHz is very low and may lead to a large uncertainty in the estimate of the spectral index. By including the flux densities at 408 and 1420 MHz only, the spectral index results = +0.14 0.02 for SH 148.83–0.67 and +0.4 0.04 for LBN 148.11–0.45, also compatible with thermal nature. Thus, the derived spectral indices show that the sources are thermal in nature.
| SH 148.83–0.67 | |
|---|---|
| Related star | HD 24431 |
| Size (′) | 60 54 |
| Adopted distance (kpc) | 1.0 0.2 |
| Size (pc) | 17.5 15.7 |
| Radius (pc) | 8.3 |
| S1420 (Jy) | 7.2 0.2 |
| S408 (Jy) | 6 0.3 |
| S2700 (Jy) | 3.7 1.8 |
| –0.20 0.12 | |
| Te (K) | 8000 2000 |
| EM () | 520 120 |
| f = 1 | |
| ne (cm-3) | 6 1 |
| Mi (M☉) | 420 170 |
| f = 0.1–0.3 | |
| ne (cm-3) | 15 4 |
| Mi (M⊙) | 180 90 |
| LBN 148.11–0.45 | |
| Related stars | HD 24094, ALS 7793 |
| Size (′) | 30 24 |
| Adopted distance (kpc) | 1.0 0.2 |
| Size (pc) | 8.7 7.0 |
| Radius (pc) | 3.9 |
| S1420 (Jy) | 3.2 0.1 |
| S408 (Jy) | 1.90 0.07 |
| S2700 (Jy) | 2.3 1 |
| +0.13 0.1 | |
| Te (K) | 10000 |
| EM () | 1000 160 |
| f = 1 | |
| ne (cm -3) | 12 1 |
| Mi (M☉) | 70 25 |
The physical parameters of the Hii regions, namely, emission measure EM, electron density ne, and ionized mass Mi, were obtained using the expressions by Mezger & Henderson (1967) and correspond to a filling factor f = 1. For the case of SH 148.83–0.67, a more realistic volume filling factor was estimated considering a shell-structure with inner radius Rin and outer radius Rou. Both radii were measured using the radio continuum map at 1420 MHz, taking into account the contour level of 5.15 K ( 85 ) (see Fig. 2). The values 28′ and 13′ were obtained for Rou and Rin, respectively. For the adopted distance, d = 1 kpc, Rou = 8.2 pc and Rin= 3.8 pc. Assuming that 10–30 per cent of the shell surface is occupied by plasma, the derived volume filling factor is in the range 0.1–0.3.
The assumed electron temperature is 10 4 K for the case of LBN 148.11–0.45, and values in the range (0.6-1.0) 10 4 K were used for SH 148.83–0.67. The derived ionized masses were multiplied by 1.27 to take into account singly ionized Helium (Goss & Lozinskaya 1995). The results are listed in Table 4. Uncertainties in masses and electron densities come mainly from the distance uncertainty. For the case of LBN 148.11–00.45, the central radio peak suggests f = 1.
4.2 Dust emission distribution
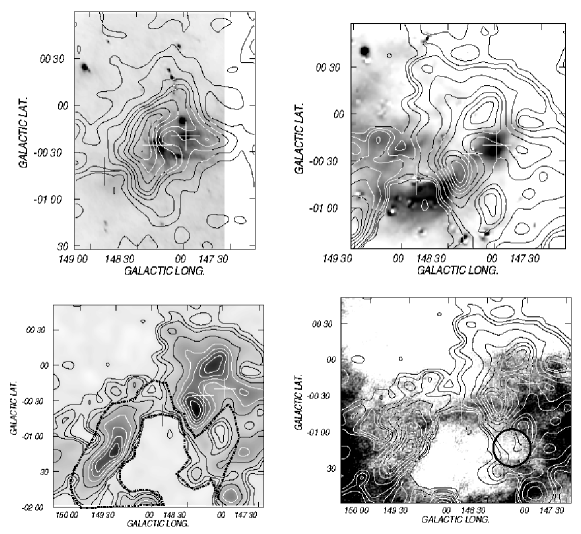
Figure 3 illustrates the infrared emission distribution in the area under study. The top left panel displays the emission at 60m in contours and grayscale, while the top right panel shows an overlay of the infrared emission at 60m (grayscale) and the radio continuum emission at 1420 MHz (contours).
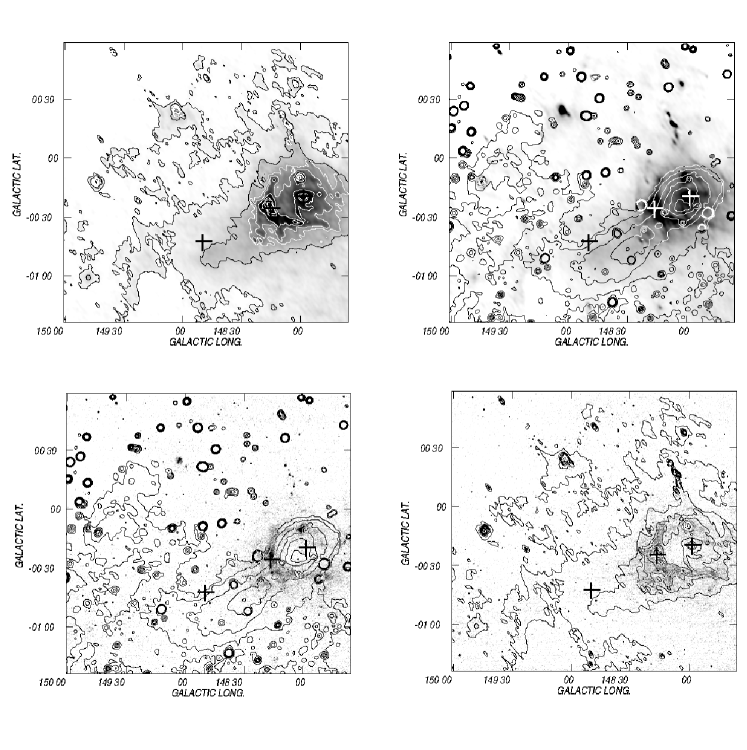
The emission distribution in the far infrared differs from the radio continuum emission. Strong emission comes from LBN 148.11–0.45. Arc-shaped extended emission at 60m strikingly surrounds the border of the H ii region towards larger galactic longitudes and separates this region from SH 148.83–0.67.
Two small emission regions are easily distinguished in LBN 148.11–0.45. One of them is a relatively extended feature coincident with the stellar position. This 60m maximum is shifted 5 arcmin from the maximum at 1420 MHz. The other infrared region is detected towards (l,b) = (148°0′, –0°10′). Its position is coincident with the small diameter source NVSS J035327+533601, detected in the radio continuum and suspected to be an extragalactic source.
Faint diffuse infrared emission also overlaps part of SH 148.83–0.67. This weak feature coincides with the arc-like structure seen at 1420 MHz and at optical wavelengths (see Fig. 1). No far infrared emission is identified near (l,b) = (149°00′, –0°20′), where faint optical emission belonging to SH 148.83–0.67 was detected.
The image at 100m is not shown here since the emission distribution is similar to that at 60m.
The bottom right panel of Fig. 3 shows an overlay of the infrared emission at 8.3m (Band A of MSX satellite) (grayscale) and the infrared emission at 60m (contours). The bottom left panel shows an overlay of the infrared emission at 8.3m (grayscale) and the radio continuum emission at 1420 MHz (contours). The image at 8.3m reveals an arc-shaped feature, 5′ in width, which delineates the border of the H ii region towards larger galactic longitudes and lower galactic latitudes, and coincides with a similar feature seen at 60m. No emission in the MSX band A is detected close to HD 24431. Very likely, the image at 8.3m shows radiation from polycyclic aromatic hydrocarbons (PAHs), which can survive in the neutral gas around H ii regions (Hollenbach & Tielens 1997), but not inside the ionized regions. Thus, this emission traces a PDR lying in the outskirts of LBN 148.11–0.45.
NVSS J035327+533601 also has a bright counterpart at 8.3m. No significant emission at 8.3m is detected in the rest of the area. We note that band E is free of emission in the whole area.
The IRAS (HIRES) image at 12m (not shown here) presents the same spatial distribution as the 8.3m image, since the filter responses of A and 12m bands are similar (Egan 1996). These bands are detecting dust with the same physical conditions.
| H ii region | S | S | Td (K) | Md (M⊙) | |
|---|---|---|---|---|---|
| (Jy) | (Jy) | (n =1.0–2.0) | n = 1.0 | n= 2.0 | |
| LBN 148.11–0.45 (a) | 680 | 1410 | 32 3 | 0.2 0.1 | 0.8 0.3 |
| LBN 148.11–0.45 (b) | 910 | 2470 | 29 3 | 0.6 0.3 | 2.0 0.9 |
| LBN 148.11–0.45 (c) | 260 | 740 | 29 3 | 0.2 0.1 | 0.6 0.3 |
| LBN 148.11–0.45 (d) | 2900 100 | 8100 300 | 29 3 | 0.4 0.2 | 1.5 0.6 |
| SH 148.83–0.67 | 620 180 | 1750 450 | 29 3 | 2.0 0.8 | 7.0 3.0 |
Table 5 lists flux densities at 60m and 100m, dust temperatures, and dust masses associated with LBN 148.11–0.45 and SH 148.83–0.67. The parameter is related to the dust absorption efficiency ( ). The dust temperature was estimated for in the range 1 to 2. The infrared emission related to LBN 148.11–0.45 was split in three regions to obtain the physical parameters of the associated dust. The first region involves the infrared emission which correlates with the central part of the H ii region (a), the second one is the arc-shaped structure (b), and the third one is the extended emission coincident with NVSS J035327+533601 (c). Region (d) corresponds to the H ii region as a whole. Uncertainties in listed dust masses originate in the adopted distance error and in different infrared background emissions. No significant difference in dust color temperature is apparent among the different sections of LBN 148.11–0.45. Derived dust temperatures for SH 148.83–0.67 and LBN 148.11–0.45 are typical for H ii regions.
4.3 The H i gas emission distribution
To find possible H i structures associated with the ionized regions, the H i data cube was carefully examined within the velocity range from –165 to +45 km s-1 (all velocities in this paper are with respect to the LSR).
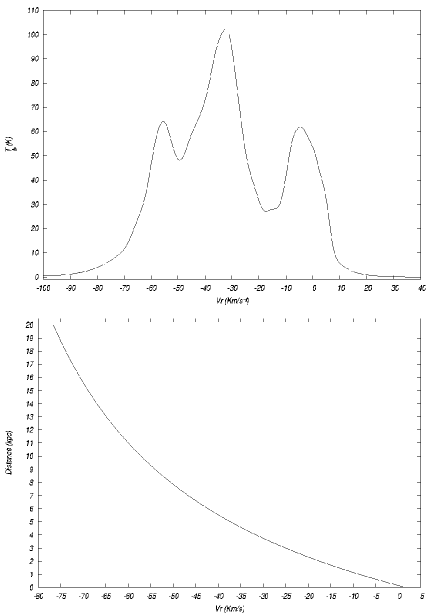
The average H i spectrum corresponding to a region of 2°2° in size centered at (l,b) = (148°29′, –0°19′) is displayed in Fig. 4 to facilitate visualization of the large scale characteristics of the H i in the area. The H i profile shows the presence of significant emission covering the velocity range from –80 to +10 km s-1. Three main H i components can be distinguished. According to circular galactic rotation models (Brand & Blitz 1993), components centered at +4 km s-1, –32 km s-1 and –56 km s-1 should be located at kinematical distances 1 kpc, 4 1 kpc and 9 2 kpc, respectively. These features are probably related to emission from the local and the Perseus spiral arms (Georgelin & Georgelin 1976).
The H i profile presents a minimum at –15 km s-1. The circular galactic rotation model predicts a kinematical distance of 1.6 0.8 kpc for gas at this velocity, compatible with distance estimates for HD 24431 (see Table 1). In order to look for cavities and holes that may be associated with HD 24431 and HD 24094 we have meticulously inspected the velocity interval [+6,–50] km s-1.
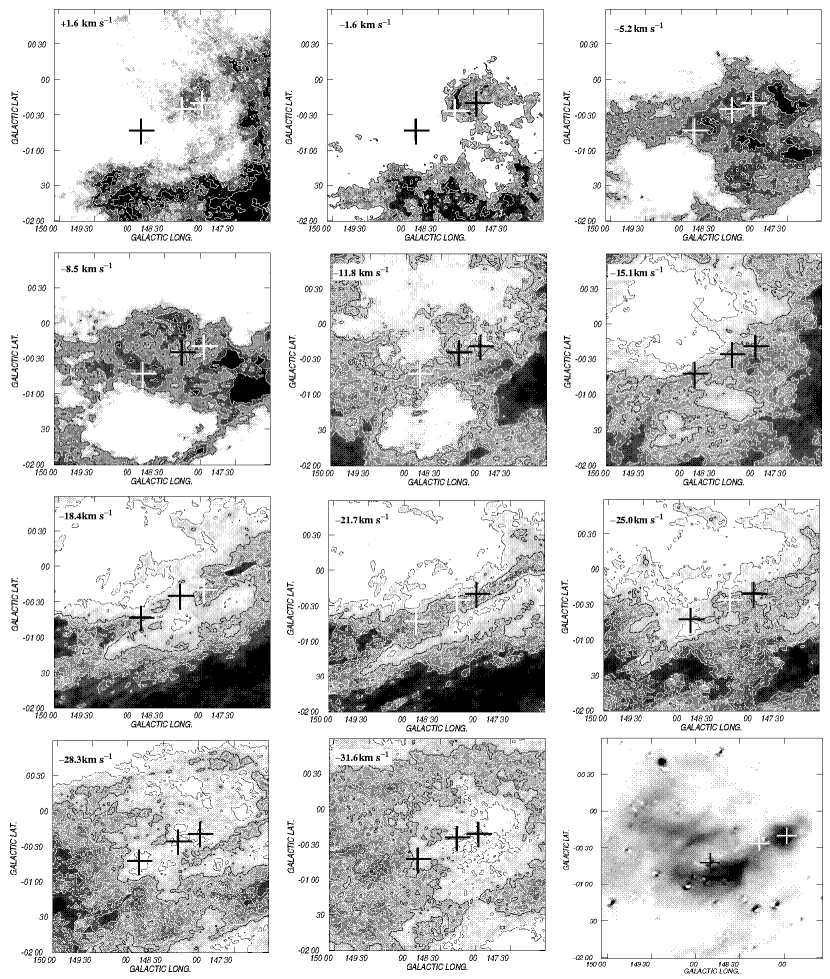
Figure 5 shows the H i emission within the velocity interval +1.6 to –31.6 km s-1 in steps of 3.3 km s-1. Each image is the average of four consecutive H i maps. In order to facilitate the display of the images, a constant background, equal to the mean value of each image within a box of 2° 2° in size centered at (l,b) = (148°29′, –0°19′) was substracted from every map. The H i gas distribution is quite complex and, as a consequence, the identification of the neutral gas associated with the ionized regions is hard to establish. We will discuss each case separately, along with an H i shell centered at (l,b)=(149°0′, –1°30′).
4.3.1 H i gas related to LBN 148.11–0.45
An inspection of Fig. 5 shows that H i gas related to LBN 148.11–0.45 is detected within the velocity range from +1.6 to –15.1 km s-1. At +1.6 km s-1, a region of enhanced H i emission is seen partially coincident with the H ii region. This feature consists of a faint elongated H i cloud centered at (l,b) = (148°10′, –0°15′) that extends 30 arcmin at a position angle of 45°. Within the velocity interval from –1.6 to –5.2 km s-1, H i gas is clearly seen surrounding the H ii region near (l,b) (148°15′, –0°15′). In the velocity range from –5.2 to –11.8 km s-1, a patchy envelope encircles the H ii region almost completely. At –8.5 km s-1, the brightest section of the H i structure surrounds the H ii region towards b –0°40′. The envelope is hardly identifiable at v –15.0 km s-1. At v –22.0 km s-1, HD 24094 and ALS 7793 are seen projected onto a bright H i filament that runs along a position angle of 30° across the area.
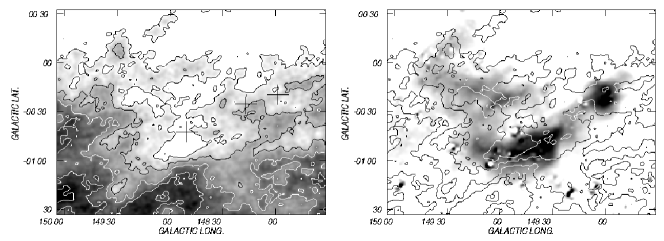
Figure 6 shows the H i emission in the velocity range from –1.5 to –11.8 km s-1 (left panel), and an overlay of the 1420 MHz continuum emission and the H i image (right panel). H i gas most probably related to LBN 148.11–0.45 is clearly seen in the left panel, where the H i envelope is identified. We believe that the H i gas that encompasses LBN 148.11–0.45 represents an atomic gas shell associated with the ionized region. H i gas projected onto the central part of the H ii region, which is detected within the velocity interval +1.5 to –5.2 km s-1, may represent part of the receding cap of the envelope.
4.3.2 H i gas related to SH 148.83–0.67 and SH 149.25–0.0
Identification of neutral atomic gas related to these features is particularly difficult.
Figure 5 shows a low emission region surrounded by an almost complete shell centered at (l,b) = (148°50′, –0°35′), which can be identified in the velocity range from –22.0 to –32.0 km s-1.
Figure 7 shows the H i emission averaged in the velocity range from –25.0 to –28.0 km s-1, where this feature is better defined. The cavity and the outer shell, 18 13 in size, are shown in the left panel. The borders of the cavity are defined by the contour line corresponding to 70 K at b –0°30′ and by the contour line of 60 K at b –0°30′. The right panel, which displays a superposition of the H i and optical images, reveals that the optical arc-like feature at (l,b) = (148°45′, –0°50′) appears projected onto the cavity. The faint optical emission at (l,b) = (149°, –0°20′) is seen within the cavity. The comparison between the H i and optical emission suggests that this H i shell is related to SH 148.83–0.67.
A bright H i filament running along the complete interval of galactic longitudes at a position angle of 30° can be easily distinguished at –22.0 km s-1 (Fig. 5), with HD 24431 projected onto the H i filament. Thin H i areas surround the bright knots seen in the optical image near (l,b) = (148°40′, –0°45′) suggesting that H i gas at this velocity interacts with the nebula.
For a systemic velocity of –27 km s-1, the circular galactic rotation model (see Fig. 4) predicts a kinematical distance of 3.3 0.8 kpc, assuming a velocity dispersion of 6 km s-1. The derived distance is larger than spectrophotometric distance estimates for HD 24431 (see Table 1). Based on the spectrophotometric distance to this star, we adopt d = 1.0 0.2 kpc as the distance to SH 148.83–0.67 and the surrounding H i shell.
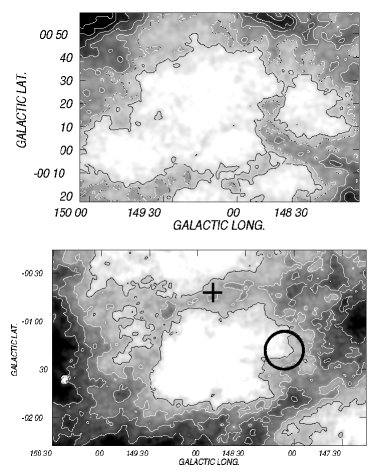
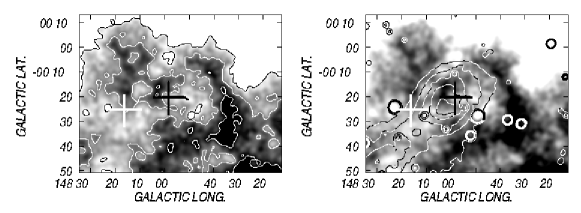
Other H i structure in the area is centered at (l,b) = (149°15′, +0°25′) at v = – 15.1 km s-1, of 60′ in size. The structure can be followed within a velocity range from –12.0 to –18.4 km s-1. At –15 km s-1, this feature presents its largest angular size, and its borders are better defined than at other velocities (Fig. 8, upper panel). For gas at this velocity, the analytical fit by Brand & Blitz (1993) predicts a kinematical distance d = 1.8 0.8 kpc. The comparison with the radio continuum emission at 1420 MHz reveals that the weak radio emission at (l,b) = (149°15′, +0°20′), related to SH 149.25–0.00, is seen projected onto the innermost part of the cavity, suggesting that the H i structure is linked to it.
4.3.3 An H i shell centered at (l,b) = (149°0′, –1°30′)
The analysis of the H i emission allows identification of an H i structure within the velocity range –5.2 to –15.1 km s-1, centered at (l,b) = (149°0′, –1°30′), with a systemic velocity of –12 km s-1. The open cluster NGC 1444, at a distance of 1.2 kpc (see Section 1), is placed near the border of the H i hole. The kinematical distance of the shell is compatible with the optical distance to the cluster. The structure is 22 15 in size and is shown in the lower panel of Fig. 8.
4.3.4 Physical parameters of the H i structures
Table 6 lists the main data of the neutral atomic structures identified in the region: the (l,b) centroid of the H i shells, the velocity interval spanned by the structures, the systemic and expansion velocities, and the kinematical and adopted distances. The expansion velocity was estimated from the velocity range spanned by the H i feature as (v2 – v1) + . The size of the H i structures was derived from the position of the maxima in the shells. The radius Rs, is defined as half the geometric mean of the axes of the H i structure. The neutral atomic mass corresponds to the mass excess in the shell. It was obtained within a circle of radius Re, assuming that the gas is optically thin, and includes a He abundance of 10 per cent. The neutral atomic mass associated with the H i shell probably linked to SH 149.25–0.00 is difficult to establish.
| Related ionized regions | LBN 148.11–0.45 | SH 148.83–0.67 | – | Sh 149.25–0.0 |
|---|---|---|---|---|
| Neutral H i shells | ||||
| (l,b) centroid | 147°55′, –0°20′ | 148°50′, –0°35′ | 149°0′, –1°30′ | 149°15′, +0°25′ |
| Velocity interval v1,v2 (km s-1) | +1.6, –18.0 | –22,–32 | –5,–15 | –20, –12 |
| Systemic velocity (km s-1) | –9 1 | –27 1 | –12 1 | –15 1 |
| Vexp (km s-1) | 11 | 7 | 7 | 6 |
| Kinematical distance d (kpc) | 1.3 | 3.3 | 1.5 | 1.8 |
| Adopted distance (kpc) | 1.0 0.2 | 1 0.2 | 1.0 0.2 | 1.0 0.2 |
| Size of the H i structure (r1 r2) (′) | 51 49 | 105 80 | 129 90 | 60 60 |
| Size of the H i structure (r1 r2) (pc) | 15 14 | 31 23 | 38 26 | 17 17 |
| Radius Rs (pc) | 7.2 | 13.4 | 15.7 | 8.5 |
| Re (′) | 25 | 27 | 56 | – |
| Neutral atomic mass (M⊙) | 65 25 | 300 120 | 1600 640 | – |
| Molecular gas | ||||
| Velocity interval v1,v2 (km s-1) | –0.65,–11.1 | – | –0.65,–11.1 | – |
| WCO (K km s-1) | 41 | – | 9 | – |
| Mean H2 column density (1021 mol cm-2) | 8 0.8 | – | 2 0.2 | – |
| Mass (104 M⊙) | 6.0 3.0 | – | 2.6 1.3 | – |
| Ambient density (cm-3) | 800 | 2 | 70 |
4.4 The molecular gas emission distribution
The analysis of the 12CO emission distribution in the region shows the presence of molecular gas associated with LBN 148.11–0.45 within the velocity range from –0.65 to –11.1 km s-1. Figure 9 (upper left panel) shows an overlay of the 12CO emission distribution within the velocity range [–3.2, –4.5] km s-1 (contours) and the infrared emission at 60 m (grayscale). The molecular cloud at l = (148°25′) delineates strikingly well the border of the PDR detected at 8.3m. Note that this CO cloud encompasses the brightest H i emission arc detected at v = –1.6 km s-1 (Fig. 5), suggesting that the thin H i filament can originate in the photodissociation of the molecular gas.
CO emission seen towards the central part of the H ii region LBN 148.11–0.45 is likely placed behind the ionized region.
The upper right panel of Fig. 9 shows the 12CO emission distribution in the velocity range [–0.65, –11] km s-1 overimpossed onto the VTSS image. 12CO gas emission at (l,b) = (148°25′, –0°40′) coincides with the faint optical emission region which separates the optically bright regions SH 148.83–0.67 and LBN 148.11–0.45. The slight distorsion in the molecular clump at (l,b) = (148°25′, –0°40′) following the border of SH 148.83–0.67, and the morphological correlation among the optical, radio continuum, and 12CO emissions indicates that the molecular gas is interacting with the ionized material.
The bottom panels of Fig. 9 show the 12CO emission within the velocity interval –3.1 to –17.1 km s-1 and a superposition of the CO and H i gas distributions in the region of the H i shell centered at (l,b) = (149°0′, –1°30′). The morphological correspondence between the H i and CO emissions reveals that this H i shell has a clear molecular counterpart.
The open cluster NGC 1444, marked in Fig. 9 by a circle, is seen projected close to the border of the CO and H i emission rings.
Towards the region under study, identification of molecular structures related to the ionized regions is easier than recognition of the associated H i structures, as can be expected bearing in mind confusion effects in the line of sight.
Table 6 summarizes the physical parameters of the molecular clouds associated with the ionized and neutral regions. The column density () was derived from the 12CO data, taking into account the empirical relation between the integrated emission ,) and . We adopted = (1.90.3) WCO 1020 cm-2 (K km s-1)-1, obtained from -ray studies of molecular clouds in the Cepheus Flare (Digel et al. 1996; Denier & Lebrun 1990). To derive the molecular mass associated with LBN 148.11–0.45 we took into account the region enclosed by the contour level of 1.5 K centered at (l,b) = (148°10′, –0°20′). For the case of the molecular mass associated with the H i shell centered at (l,b) = (149°0′, –1°30′), we considered the region enclosed by the dash-dot line (Fig. 9). Errors in the derived molecular masses arise in uncertainties in distance and in N.
The ambient density was derived by distributing the ionized, neutral atomic and molecular
masses over a sphere of radius . For the case of LBN 148.11–0.45, = 31′ ( 9 pc), which corresponds to the region showing CO emission.
The comparison between the low neutral atomic mass related to LBN 148.11–0.45 and the associated molecular mass suggests that the H i mass originated in the photodissociation of the molecular gas. This region is clearly evolving in a highly dense ambient medium.
5 The origin of the structures
5.1 SH 148.83–0.67
We can estimate the number of UV photons (s-1) necessary to ionized the gas in the H ii region from the radio continuum results and compare our estimate with the UV photon flux emitted by the exciting star, , as derived from stellar atmosphere models. From the expression for the Stromgren’s sphere (see Spitzer 1978), and adopting a radius of 8.3 pc for the H ii region SH 148.83–0.67 and the electron density listed in Table 4 corresponding to f = 1, we derived log = 47.9.
Following Smith et al. (2002) and Martins et al. (2005), the number of Lyman continuum photons emitted by an O9 III star is in the range = 47.9 - 48.4, indicating that HD 24431 can maintain SH 148.83–0.67 ionized if a small amount of interstellar dust is related to the structure (Inoue 2001). Indeed, the lack of infrared emission related to this H ii region suggests that little interstellar dust is present (see also Table 5).
To investigate whether the ring-like structure originated in the action of the stellar winds of HD 24431 on the surrounding gas, we will estimate the energy conversion efficiency, , defined as the ratio between the kinetic energy Ek in the shell and the mechanical energy supplied by the stellar wind Ew.
To evaluate the kinetic energy in the expanding shell, Ek = 0.5 M V, we consider that the ionized, H i, and molecular gas expand at Vexp. The kinetic energy results to be Ek = 2.3 1047 erg.
A rough estimate of the stellar wind energy of HD 24431, can be obtained adopting a mass loss rate ̇M =1 10-7 M⊙ yr-1 (Chlebowski & Garmany 1991) and a terminal velocity Vw= 2000 km s-1 (Prinja et al. 1990). We assume that this wind blew during at least the dynamical age of the bubble, td = 0.55 Rs/Vexp (McCray 1983). For the values listed in Table 6, t = 1.1 106 yr. The lifetime in the main sequence can be considered as an upper limit to this time. From Schaller et al. (1992), t = 4.0 106 yr. For t = (1.1 – 4.0) 106 yr, we estimate Ew = 0.5 Ṁ V t = (5–16) 1048 erg.
The parameter = 0.015 – 0.05, similar to values derived for other interstellar bubbles (Cappa et al. 2003), indicating that SH 148.83–0.67 probably originated in the stellar winds of the O9 III star.
5.2 LBN 148.11–0.45
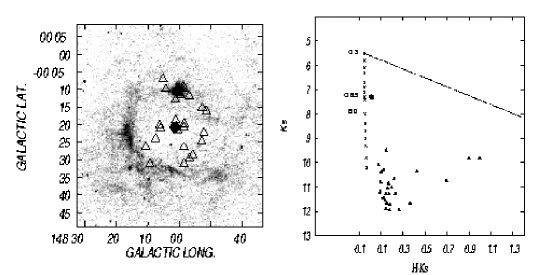
Adopting the radius and electron density derived for this region from Table 4, we estimate that the UV photon flux necessary to ionize the gas is log = 47.7. Clearly this UV photon flux is higher than that provided by HD 24094 (B8V) and ALS 7793 (B1V) star. To look for additional sources of ionizing photons associated with the H ii region, we investigated the presence of main sequence O-type stars which may contribute to the ionization of the H ii region by using the 2MASS data base. We identified the main sequence candidates based on the position of the sources in the color-magnitude (CCD) and color-color (CMD) diagrams according to the q parameter. Following Hanson et al. (1997), the parameter q is defined as:
| (1) |
Main sequence stars have q-values in the range –0.15 to 0.10. Using this selection criteria, we found 28 candidates to be main sequence stars in the region of LBN 148.11–0.45. Fig. 10 shows the spatial distribution of these sources superpossed onto the image at 8.3 m, and the CMD. Most of the sources have Ks-magnitudes greater than 10 mag, suggesting that they are foreground late-type stars (later than B1 V). HD 24094, indicated in Fig. 10 as a filled circle, has values (H-Ks, Ks) = (0.023,7.35), corresponding to an O-type star (O8.5 or O9) with Av = 10 mag, different from the B-type star determination by Duerbeck (1997). Were HD 24094 an O8.5 V – O9 V star, it would supply an UV photon flux N∗ = 1 1048 s-1 (Martins et al. 2001), enough to explain the ionization of the H ii region. Spectroscopic data are nedded to confirm this point.
Note that a number of B-type star candidates are projected onto NVSS J035327+533601.
We can roughly estimate the age of the H ii region LBN 148.11–0.45 from the expression (12-20) by Spitzer (1978), which considers the expansion of an H ii region with time. The radius of the H ii region at the beginning of the expansion phase, , can be derived from the expression for the Strongrem’s sphere, adopting an electron density equal to the ambient density (see Table 6) and log = 47.7. For Ri = 0.35 pc and adopting the present radius Ri = 7.2 pc, the age of the H ii region is 4 106 yr.
5.3 Shell centered at (l,b) = (149°0′, –1°30′)
The question that raises is whether this neutral gas structure is physically related to NGC 1444. The estimated age of this cluster is in the range (25-41) 106 yr (Lynga 1983, 1987). The spectral type of its earliest star is B2 (Lynga 1983) and four blue stragglers were found to be related to it (Ahumada & Lapasset 1995). Leisawitz (1990) carried out a molecular survey around open clusters and found molecular clouds within the velocity range [–0.4, –26] km s-1 probably associated with NGC 1444. Clouds labelled by Leisawitz (1990) as I and E centered at (l,b) = (149°12′, –0°24′) and (l,b) = (149°36′, –1°6′) with mean radial velocities of –4.5 and –8.1 km s-1, respectively, coincide in position and velocity with the CO ring shown in Fig. 9. No other OB stars projected onto the cavity were found in the literature. The origin of this shell is still an open question.
6 Summary
We have examined the interstellar medium in the surroundings of Sh2-205. We based our study on radio continuum data at 408 and 1420 MHz, and 21–cm H i line emission data belonging to the Canadian Galactic Plane Survey, 12CO from the survey by Dame et al. (2001), IRAS (HIRES) and MSX data.
The main findings can be summed up as follows:
1. Sh2-205 can be separated in three independent structures called: SH 149.25–0.00, SH 148.83–0.67, and LBN 148.11–0.45. To obtain the physical properties of these optical nebulae we have adopted a distance of 1.00.2 kpc.
2. We conclude that SH 148.83–0.67 is an interstellar bubble powered by the energetic winds of HD 24431. Low infrared emission is detected in this region. The H i shell related to SH 148.83–0.67 is identified in the velocity range from –22 to –32 km s-1. It is 31 23 pc in size and expands at 6 km s-1. The electron density and the associated ionized mass are 15 4 cm-3 and 180 90 M⊙, respectively, adopting a filling factor f = 1. The associated neutral atomic mass is 65 M⊙.
3. LBN 148.11–0.45 is a classical H ii region. The optical, mid- and far- infrared emissions reveal that dust and gas are well mixed in this region. The dust temperature is 29 K, typical of H ii regions. Molecular gas within the velocity range [–0.65, –11.1] km s-1 is found to be associated with the H ii region. We estimated a molecular mass of 60 103 M⊙. The distribution of the emission in the MSX band A encircles the H ii region and correlates with the molecular emission, indicating the presence of a PDR. Neutral atomic gas in the velocity range [+1.6, –18.0] km s-1 is related to LBN 148.11–0.45. H i gas with velocities in the range from +1.6 to –5.2 km s-1 is seen projected onto the central part of the H ii region, which may represent part of the receding cap of the envelope. The H i structure is 15 pc 14 pc in size and expands at about 9 km s-1. The associated neutral atomic mass is 300 M⊙. The electron density and ionized mass are 12 1 cm-3 and 70 25 M⊙, respectively. The H ii region is evolving in a dense interstellar medium. We estimate that the H ii region has been expanding for 4 106 yr.
The ionizing source of LBN 148.11–0.45 remains uncertain. The earliest spectral type stars seen in projection onto this region are ALS 7793 (B1 V) and HD 24094. Duerbeck (1997) determined a B8 V spectral type for HD 24094. However, results from the 2MASS point source catalogue showing main sequence stars in the area of the nebula suggest that HD 24094 is an O8.5 – O9 star. A star with this spectral type would provide the necessary UV photon flux to keep the H ii region ionized. High quality spectroscopic data are nedded to elucidate this point.
4. An H i structure within the velocity range –5.2 to –15.1 km s-1 was identified centered at (l,b) = (149°0′, –1°30′). This shell correlates morphologically with molecular gas emission detected in the velocity range from –0.65 to –11.1 km s-1. The neutral and molecular mass are 1600 M⊙ and 20 103 M⊙, respectively. Possible progenitors of this structure are the stellar members of NGC 1444.
5. An H i shell was also found possibly associated with SH 149.25–0.00. The neutral atomic structure is expanding at 6 km s-1 and is about 17 pc in size. The radio continuum emission is too faint to allow us to determine the physical properties of this nebula. No early type stars were found responsible for the ionization and expansion of SH 149.25–0.00 in the literature.
6. A relatively large number of main sequence candidates were found in the region of LBN 148.11–0.45 by making use of the 2MASS point source catalogue. Particularly interesting are the main sequence candidates projected onto NVSS J035327+533601 at (l,b) = (148°0′, –0°10′).
Finally, the presence of a photodissociation region at the interface between the molecular material and the ionized gas in LBN 148.11–0.45, strikingly bordering the ionized region, is suggestive of the existence of regions of active stellar formation. This suggestion is reinforced by the high density medium where the H ii region is evolving.
The observed scenario favors the conditions for the collect and collapse process (Elmegreen 2000), as was found by Deharveng et al. (2003) for Sh2-104. In a forthcoming paper, we analyze the stellar formation activity in the area.
Acknowledgments
We thank Dr. T. Dame for making his CO data available to us. We are grateful to the anonymous referee for their helpful suggestions. This project was partially financed by the Consejo Nacional de Investigaciones Científicas y Técnicas (CONICET) of Argentina under project PIP 5886/05, Agencia PICT 14018, and UNLP under projects 11/G072. The Digitized Sky Survey (DSS) was produced at the Space Telescope Science Institute under US Government grant NAGW-2166.
References
- (1) Ahumada J. & Lapasset E., 1995, A&AS, 109, 375
- Blitz, Fich & Stark (1982) Blitz L., Fich, M., & Stark A.A., 1982, APJS, 49, 183
- (3) Brand J. & Blitz L., 1993, A&A, 275, 67
- (4) Cappa, C., Niemela, V.S., McClure-Griffiths, N.M. 2003, RMxAC, 15, 47
- (5) Chlebowski T., & Garmany C.D., 1991, ApJ, 368, 241
- Condon et al. (1998) Condon J.J., Cotton W.D., Greisen E.W. et al. 1998, AJ, 115, 1693
- (7) Cruz-Gonz lez C., Recillas-Cruz E., Costero R., Peimbert M., Torres-Peimbert S., 1974, RMxAA, 1, 211
- (8) Dame T. M., Hartmann Dap, Thaddeus P., 2001, APJ, 547, 792
- (9) Deharveng, L., Zavagno, A., Caplan, J., Lefloch, B., Salas, L., Porras, A., Cruz-Gonz lez, I. 2003, A&A, 408, L25-28
- (10) del Rio, G., Huestamendia G., 1988, A&AS, 73, 425
- (11) Digel S.W., Lyder D.A., Philbrick A.J., Puche D., & Thaddeus P. 1996, APJ, 458, 561
- Duerbeck (1997) Duerbeck H.W., 1997, IBVS, 4513, 1
- (13) Durgapal Alok K., Pandey Anil K., Mohan V., 1997, BASI, 25, 489
- (14) Egan S.D., Tedesco E.F., Cohen M. et al., 1996, Bull.Am.Astron.Soc, 28, 1341
- (15) Fabricius C., Hog E., Makarov V.V., Mason B.D., Wycoff G.L., Urban S.E., 2002, A&A, 384, 180
- Felli & Churchwell (1972) Felli M., & Churchwell E., 1972, A&AS, 5, 369
- Fich, Dahl, & Treffers (1990) Fich M., Dahl G.P., Treffers R.R., 1990, AJ, 99, 622
- (18) Fürst E., Reich W., Reich P., Reif K., 1990, A&As, 85, 691
- (19) Garmany C. D., Conti P. S., Chiosi C. , 1982, APJ, 263, 777
- (20) Georgelin Y. M., Georgelin Y. P., 1976, A&A, 49, 57
- (21) Gies D. R., 1987, APJS, 64, 545
- Goss & Lozinskaya (1995) Goss W.M., Lozinskaya T., 1995, APJ, 439, 637
- Gregory & Condon (1991) Gregory P.C., Condon J.J., 1991, APJS, 75, 1011
- Hales, Baldwin & Warner (1988) Hales S.E.G., Baldwin J.E., Warner P.J., 1988, MNRAS, 234, 919
- Hiltner & Johnson (1956) Hiltner W. A., Johnson H. L., 1956, APJ, 124, 367
- (26) Hollenbach D.J. & Tielens A.G.G.M, 1997, ARA&A, 35, 179
- (27) Humphreys R. M., 1978, APJS , 38, 309
- (28) Inoue A.K. 2001, AJ, 122, 1788
- (29) Lamers Henny J. G. L. M. & Leitherer C., 1993, ApJ, 412, 771
- (30) Lamers Henny J. G. L. M. & Cassinelli J. P., 1999, JBAA, 109, 347
- (31) Leisawitz D, 1990, ApJ, 359, 319
- Lynds (1965) Lynds B.T. , 1965, APJS, 12, 163
- (33) Lynga, G., 1983, Catalogue of Open Cluster Data (3rd edition), available through NSSDC, Greenbelt, Maryland, USA
- (34) Lynga, G., 1987, Catalogue of Open Cluster Data (5th edition), available through NSSDC, Greenbelt, Maryland, USA
- (35) McCray R. in Highlights of astronomy. Volume 6 - International Astronomical Union, General Assembly, 18th, Patras, Greece, August 17-26, 1982, Proceedings (A84-28901 12-90). Dordrecht, D. Reidel Publishing Co., 1983, p. 565-579.
- Mezger & Henderson (1967) Mezger P.D., Henderson A.P. 1967, APJ, 147, 471
- (37) Moffat A. & Puls J., 2003, IAUS, 212, 773
- Newberg et al. (1999) Newberg H.J., Richards G.T., Richmond M., Fan X., 1999, APJS, 123, 377
- (39) Osterbrock D.E., 1989, ”Astrophysics of Gaseous Nebulae and Active Galactic Nuclei ed. by University Science Books, C.A.”
- (40) Prinja R.K., Barlow M.J., & Howarth I.D., 1990, ApJ, 361, 607
- (41) Schaller G, Schaerer D., Meynet G., Maeder A. 1992, A&AS, 96, 269
- Sharpless (1959) Sharpless S., 1959, APJS, 4, 257
- (43) Spitzer L., 1978, “Physical Processes in the Interstellar Medium”, Wiley-Interscience publication, New York.
- (44) Taylor J.H., Manchester R.N. & Lyne A.G. 1993, ApJS, 88, 529
- (45) Taylor A. R., Gibson S. J., Peracaula M., Martin P. G., Landecker T. L., Brunt C. M., Dewdney P. E., Dougherty S. M., Gray A. D., Higgs L. A., Kerton C. R., Knee L. B. G., Kothes R., Purton, C. R., Uyaniker B., Wallace B. J., Willis A. G., Durand D., 2003, AJ, 125, 3145
- Walborn (1973) Walborn N. R., 1973, AJ, 78, 1067
- (47) Weaver R, McCray R., Castor J., Shapiro P., & Moore R., 1977, ApJ, 218, 377
- (48) Zdanavičius J., Černis K., Zdanavičius K., Straižys V., 2001, BaltA, 10, 349