PuMa II: A Wide Band Pulsar Machine for the WSRT
Abstract
The Pulsar Machine II (PuMa II) is the new flexible pulsar processing backend system at the Westerbork Synthesis Radio Telescope (WSRT), specifically designed to take advantage of the upgraded WSRT. The instrument is based on a computer cluster running the Linux operating system, with minimal custom hardware. A maximum of 160 MHz analogue bandwidth sampled as 820 MHz subbands with 8-bit resolution can be recorded on disks attached to separate computer nodes. Processing of the data is done in the additional 32-nodes allowing near real time coherent dedispersion for most pulsars observed at the WSRT. This has doubled the bandwidth for pulsar observations in general, and has enabled the use of coherent dedispersion over a bandwidth eight times larger than was previously possible at the WSRT. PuMa II is one of the widest bandwidth coherent dedispersion machines currently in use and has a maximum time resolution of 50ns. The system is now routinely used for high precision pulsar timing studies, polarization studies, single pulse work and a variety of other observational work.
1 Introduction
Pulsars are rotating neutron stars and relatively weak radio sources. Observing pulsars requires a large telescope collecting area and wide observation bandwidths in order to improve sensitivity. Some pulsars have a small rotational period, with the fastest spinning at 716 Hz (Hessels et al. 2006) and the pulsed emission from these sources is often only a small fraction of the pulse period, with a duty cycle of 5–10%. Owing to this nature of pulsars, observing them dictates high time resolution and wide bandwidths as important requirements in pulsar instrument designs. The recent discovery by Hankins & Eilek (2007) of the occurrence of bright, extremely narrow pulses of 0.4 ns duration in the Crab pulsar further illustrates the importance of high time resolution. High time resolution is also a requirement of high-precision pulsar timing, an experimental technique with the potential for detecting the gravitational wave background using an array of millisecond pulsars (Stinebring et al. 1990).
As the radio signals from pulsars propagate through the interstellar medium (ISM), they undergo dispersion, giving rise to the smearing of signals across the observed spectral band and limiting the final time resolution. If not corrected, the effect of dispersive smearing can be severe enough to wipe out the pulsed signal. Dispersion can be corrected before or after detection of the pulsar signal. In the post-detection method, also called incoherent dedispersion, the pulsar signal is first split into narrow channels and the signal in each channel is ”detected”, i.e the voltage is squared to form the instantaneous source intensity. The detected time series are then shifted in time with respect to a reference channel, and added to give an average pulse profile with a high signal-to-noise ratio (S/N). However, this method suffers from the disadvantage that the residual dispersion smearing is still present in the narrow channels, effectively limiting the maximum time resolution attainable.
A better method in which the dispersion is corrected completely is called coherent dedispersion; it results in a very high time resolution, limited only by the sampling interval, and better S/N. This technique, pioneered by Hankins (1971), involves sampling and recording raw voltages and then using digital computers to invert the effect of the interstellar dispersion on the pulsar signals. In practice, this is done by modeling the ISM as a filter that imparts a frequency dependent delay on the signal, and convolving the data with the inverse of the transfer function of the filter.
Even though the second method removes dispersion completely, it is computationally very intensive. Therefore, incoherent dedispersion was the technique of choice in early pulsar instruments based on mostly analogue filter banks (Stinebring et al. 1992). Other instruments using incoherent dedispersion were based on Acoustooptic spectrometers (Hanado et al. 1995) and autocorrelation spectrometers (Navarro 1994). Coherent dedispersion in hardware was implemented, although these systems had limited bandwidth, with a maximum of 2 MHz (Hankins et al. 1987). In the next generation of machines, a combination of digital filter banks and hardware coherent dedispersion in the narrow channels was implemented (Backer et al. 1997) allowing high resolution observations with up to 64 MHz bandwidth. Advances in digital signal processors made digital filter banks possible (Vôute et al. 2002) allowing even wider bandwidths to be used (up to 80 MHz) and giving a new level of flexibility in terms of a variable number of filter channels and limited baseband recording (up to 20 MHz, 2-bit data).
Wide bandwidth coherent dedispersion had to wait till technological developments in disk and tape based storage in the late-90’s that made base band recording more accessible (Jenet et al. 1997; Stairs et al. 2000; Hotan 2005). With the improvements in storage technology, an even larger bandwidth can now be baseband recorded, and relatively cheap cluster computers can be used to coherently dedisperse the data in software. The design of Pulsar Machine II (PuMa II) has taken advantage of this progress in hardware technology. We describe PuMa II in the following sections. The rest of the article is organized beginning with section 2 describing the WSRT’s interface to pulsar instruments. In section 3 the PuMa II hardware design, implementation details and software are discussed. Some results illustrating the instrument’s capabilities are presented in section 4. A comparison with other pulsar instruments is made in section 5 and conclusions are presented in section 6.
2 The WSRT Tied Array Interface
The WSRT is a synthesis array telescope (Baars & Hooghoudt 1974). The telescope now consists of 14 25-m diameter parabolic telescopes on a 2.7 km east-west line. The first ten telescopes are spaced evenly at 144m and the last four are movable on rails. For synthesis observations, the movable telescopes can be positioned at various locations on the rails allowing a favorable coverage. The recent upgrade of the telescope has resulted in larger bandwidth, frequency agility, better telescope surface, newer hardware and software, making the WSRT a very sensitive and flexible telescope. The frontend receivers in each telescope, called MFFE (Multi Frequency Front End) covers frequencies from 110 MHz to 9 GHz in both polarizations almost continuously over eight frequency bands. With the highly flexible MFFE design, switching to any of the supported frequency bands can be done within a minute. The array is most sensitive in the 21cm Band with a system temperature of 27K and a telescope gain of 1.2 K/Jy.
Pulsar observations in synthesis telescopes are less straight forward when compared to single dish telescopes. To improve sensitivity to pulsars, the signal from all telescopes in the synthesis array should be added after the signal from each telescope is delayed appropriately. In the WSRT this is done by tapping off the digitized signal sent to the correlator and adding the signal digitally in the Tied Array Adder Module (TAAM). The TAAM provides the added signal as a digital or analogue output to other backend systems like pulsar machines and VLBI recorders.
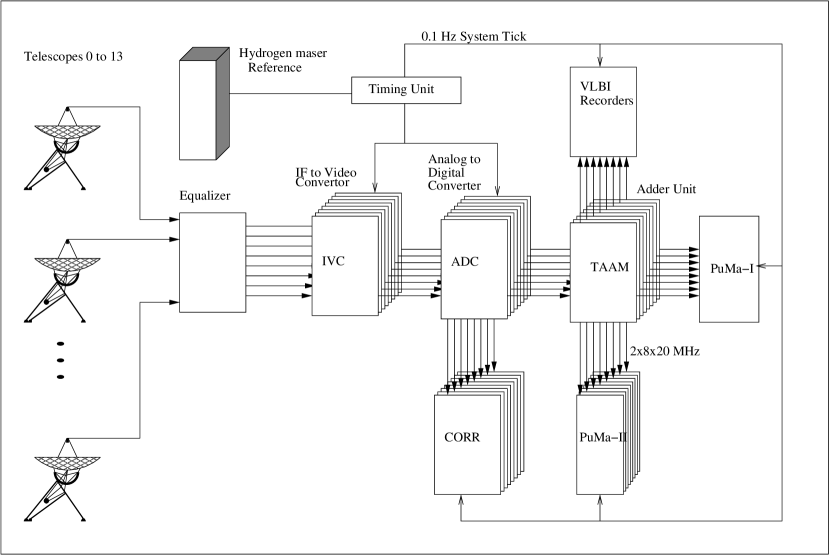
An overview of the WSRT is shown in Fig. 1. The voltages induced at the probes corresponding to the two orthogonal polarizations in the frontends are down converted to intermediate frequency (IF) of 100 MHz at the telescope frontends. All systems following this stage are equipped to handle these two orthogonal polarization signals. The signal from the frontends are transported in phase compensated coaxial cables to the receiver room. The IF signal width is 80 MHz (for GHz) or 160 MHz ( GHz) depending on the band of operation. The signal then passes through an equalizer to compensate for cable losses. The IF to Video frequency converter (IVC), splits the IF signals into 20MHz-wide subbands and frequency translates to 20 MHz baseband signals. The signals are then real-sampled at the Nyquist rate in the analogue to digital converter (ADC) units using a 40 MHz clock and two bit digitizers. In comparison to the complex sampling used in similar instruments, real sampling of the signal results in better quality due to the non-ideal realizations of the physical 90∘ phase-shifters required in sampling the quadrature signal. A geometric delay to the digitized basebands are now applied and are sent to both the correlator system and to the adder module, TAAM. The TAAM forms the coherent sum of the signals from the telescopes in the array. From this point onwards, the data distribution is done via optical fibers. The use of optical links improves noise immunity in the data communication paths of the backend systems by isolating electrical grounds between the subsystems. This avoids the formation of electrical ground loops in the system. The net effect of the use of fiber links is the improvement in signal integrity, thereby improving the overall system quality greatly. The TAAM adds the 2-bit data from all 14 telescopes in phase, resulting in a signal of equivalent strength to that from a single dish telescope of 93-m diameter. Addition of the 2-bit signals from all 14 telescopes results in a 6-bit value. The two 6-bit values corresponding to the two polarizations are packed as two 8-bit signed integers and sent to the storage nodes in the PuMa II cluster via optic fibers.
The addition of all telescopes signals results in a fan beam, with the beam width depending on the wavelength of operation; at 21cm this is . The narrow beam formed by the phased array has some advantages when compared to the beam of an equivalent single dish telescope. The synthesized beam is less sensitive to terrestrial radio-frequency interference and is narrow enough to resolve out extended structure in the sky, improving sensitivity to some pulsars (e.g the Crab pulsar). However, the narrow beam also has the disadvantage of a small field of view when the array is used for pulsar surveys.
3 PuMa II design
3.1 Overview
Motivated by the increased bandwidth of the upgraded WSRT, we began searching for a new pulsar machine concept. It was realized early in 2003 that the technology at that time had the potential to support the large data rates () required to sample and store the entire WSRT bandwidth. It was also clear that a computer cluster would be needed to record and process this large data rate, with each computer node supporting . A technology survey was carried out, and a single node prototype was built using a fast computer based on the Supermicro X5DAE motherboard111http://www.supermicro.com/products/motherboard/Xeon/E7505/X5DAE.cfm. The X5DAE was chosen based on the requirement of two independent Peripheral Component Interconnect (PCI) buses to support the high data rate. This machine proved to be adequate after a careful choice of XFS222XFS Filesystem from Silicon Graphics Inc. For more details, see http://oss.sgi.com/projects/xfs/, a high performance filesystem, a fast DMA333High throughput Direct Memory Access (DMA) card. See http://www.edt.com/pcicda. card and a high speed disk pack based on 3Ware444High performance disk access cards from 3Ware Inc. See http://www.3ware.com/products/serial_ata9000.asp Redundant Array of Independent Disks (RAID) card. In the prototype, the storage medium was eight parallel IDE devices tied in a RAID0 configuration to support high throughput. The XFS filesystem was configured with the real time subvolume option, to support low latency, high speed data writes to the disk surface. With the real time subvolume option, the block buffering in Linux kernel 2.4.25 is bypassed, permitting fine grained control of the data writes to the disk. This configuration allowed a maximum throughput of . The prototype design was based on an analogue input to the system. An 8-bit dual converter sampled the analog signal at 40 MHz. Later in the prototype testing stage, it was realized that the digital outputs of the TAAM can be used. Therefore an interface card, the PuMa II interface Card (PiC), was designed to accept the digital input (see next subsection for details).

With the knowledge acquired in the prototyping stage, the final baseband recording system was designed with 8 storage nodes (plus 2 spares) and 32 nodes for computing. Two nodes each equipped with a 8-tape juke-box were added later for the archiving of reduced data. The current and final configuration of PuMa II is a cluster of 44 computers connected by gigabit Ethernet and is shown in Figure 2. Each node consists of a S2882555Server grade motherboards from Tyan Inc. see http://www.tyan.com/products/html/thunderk8spro.html motherboard, with dual-Opteron processors clocked at 2.0 GHz. A HP Procurve gigabit switch is used for the cluster network. The storage nodes are equipped with an EDT DMA card, and 3Ware RAID card, a PiC and 4TB of disk space. The separation of acquisition and processing aspects in the system described above easily meets the high speed sustained recording speeds of 80 MB/s per node amounting to a total throughput of 640 MB/s for the whole system while offering near real time coherent dedispersion for a range of pulsars.
3.2 PuMa II interface Card
As described above, the optical nature of the subsystem communication links required that a custom interface card be built. The PuMa II Interface Card (PiC), was designed as an electronic card that integrates well in the PuMa II cluster. The card is compatible with the PCI bus, a standard connection system in computer motherboards. Figure 3 shows a block diagram of the PuMa II Interface card. The card is realized on an 8-layer, short sized printed circuit board (PCB). The PCB was designed to allow high clock rates, up to 200 MHz and hence differential signal lines are used extensively. The low voltage differential signaling (LVDS) technique permits much larger clock rates (up to 650 MHz), while preserving signal integrity within the PCB. The integrated circuit, PLX 9080 provides the PCI bus interface on this card. A Field Programmable Gate Array (FPGA) provides board control logic, data synchronization, error detection and monitor logic. The digital optical signal from TAAM is converted to electric signals in the serial link receiver unit. This is a piggy back module used in various subsystems of the WSRT and is designed around an Intel TXN31011 optical transceiver chip. The output of the receiver module is 28-bit digital data that are synchronized in the FPGA using the 0.1 Hz system tick (SYSTICK, derived from the observatory’s MASER reference). The data from the FPGA are converted to LVDS using differential driver chips and sent to the EDT DMA card via a short 80-core shielded, twisted pair cable.

The data in the PiC are synchronized in two stages. The first level of coarse synchronization is done when the upper layer software requests a recording to be started. The start command is honored only if the command arrives before the 9th second of a 10 second synchronization boundary. On receiving this command, the PiC is armed, and waits for the next possible 10-second hardware trigger, the SYSTICK, to arrive. Once the trigger arrives, the synchronization is done on the fine grained sync signal called Begin of Correlator Frame (BOCF) is delivered in the serial data stream. From this moment onwards, the data are allowed to flow into the FIFO in the DMA card. The first sample is then timestamped based on the 0.1 Hz hardware synchronization signal. A byte count is maintained throughout the observation, thus providing accurate time stamps for all subsequent samples recorded as data files on the disk. The data written are monitored by the byte count and a resynchronization procedure can be initiated if data loss is detected. In practice this is almost never done as the system reliability easily allows uninterrupted recording of 6 hours, which is determined by the largest contiguous disk volume.
3.3 System Software
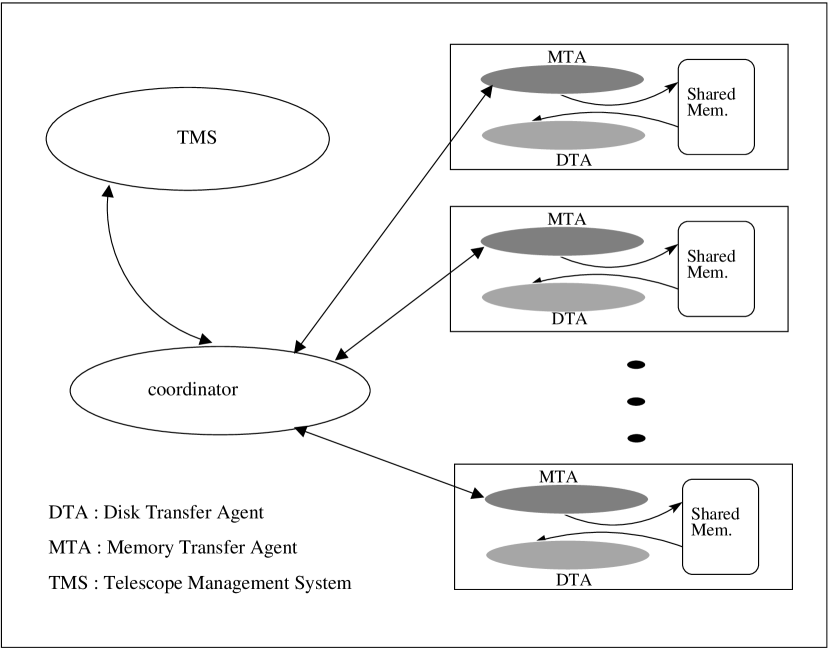
The software in PuMa II consists of three different aspects, providing complete flexibility of the instrument operation. Figure 4 provides an overview of the software components relevant to PuMa II. Many of the components are not visible to the end user, as the whole system is abstracted by the top layer software. All software components rely on socket based communication, except for those within a node, which communicate via shared memory structures.
3.3.1 Data acquisition software
The data acquisition software runs in the storage nodes, and is responsible for the high speed baseband recording in PuMa II. This module includes software to control the PiC, EDT DMA card and data writes to the hard disk. Two multi-threaded processes, the first for memory transfers and the second for disk transfers, run concurrently. The former controls and transfers data from the DMA card to a buffer in main memory, while the latter flushes data out from main memory to the hard disk. Both processes update their progress in a shared memory area. The buffer in main memory is organized as a collection of shared memory segments of 800 MB total size and can cope with disk latencies up to 10 seconds. A collection of 16 kernel buffers, each of 4MB size arranged as a ring buffer, are reserved for the DMA transfers. These DMA transfers are the lowest level of data transfer and they are handled by the Linux kernel module of the DMA card. The memory transfer agent copies this data to the buffer in the main memory. Since the ADC units of the WSRT always sample at a 40 MHz rate even if the input band is selected to be less than 20 MHz, decimation of data can be done at this point to reduce the amount of data written to the disks. The decimation factor can be 1,2,4,8 or 16 corresponding to input bands of 20, 10, 5, 2.5 or 1.25 MHz respectively. This feature is useful when observations are done at low sky frequencies, where only relatively interference free regions of a band are to be recorded. The disk transfer agent waits on a filled buffer, and it is then written to the disk when the buffer is signaled full by the memory transfer agent.
One thread of the memory transfer process listens to a Unix socket, allowing control from upper layer software. Using this interface a recording can be started or stopped. Other status information is also exchanged via this interface. The two processes (disk and memory transfer agents) run in all storage nodes, and a third software component communicates to all eight storage nodes. This approach encapsulates the PuMa II baseband system as a single instrument by the telescope software.
The disk transfer software can be replaced by a network transfer program (still in development). This distributes data directly to the compute nodes in the cluster, allowing network recording or real time distributed processing of baseband data. In the network storage mode, each storage node needs to be assigned at least target compute nodes and is determined by,
| (1) |
where, is the disk throughput rate in MB/s of the target compute node. For the compute nodes is , giving . The assumption here is that network speed is equal to or better than 80 MB/s, which is true for the gigabit network used in the PuMa II cluster. In the compute nodes, the disk transfer process can be used to write the data to the disk. The processing software can be used if the data can be processed in real time.
3.3.2 Processing software
The main objective of pulsar signal processing is the removal of dispersion suffered by pulsar signals as they propagate through the ISM. The ISM can be seen as a tenuous ionized plasma that introduces a frequency dependent delay to the radio waves traveling in them. Dispersion smears the signal across the observing band, and limits time resolution if uncorrected. The effect can be modeled with a filter that phase shifts the signal depending on its frequency. Following Hankins & Rickett (1975), the transfer function of the filter can be expressed as:
| (2) |
where is the mid frequency of the observing band, is observed frequency band, with and D is the dispersion constant defined by,
, and ,
where is the dispersion measure in pc cm-3, is distance to the pulsar, and is the integrated electron density along the line of sight to the pulsar. The dispersive effect of the ISM can be undone numerically, if the pulsar signal is recorded as baseband voltages. This is done by convolving the data with the inverse of 2 and is called coherent dedispersion or pre-detection dedispersion.
The coherent dedispersion technique is computationally very intensive and the resulting time resolution is not required for most pulsar studies. Therefore a combination of synthetic filterbanks and coherent dedispersion can be used to remove dispersion in a computationally efficient way. This method is called the coherent filterbank. The synthetic filterbank is formed in software by computing the Discrete Fourier Transform and can be efficiently calculated using the Fast Fourier Transform (FFT) algorithm (Vaidyanathan 1992). An implementation of the coherent filterbank is described by Jenet et al. (1997), where an N-channel synthetic filterbank is formed first by segmenting the real data in to sequences of length 2N and FFTed to give N complex points. The first point from successive transformed sequences form the time series from the 1st filter channel, the second point is the time series from the 2nd channel and so on. In the second step, the time series from each of these synthetic filterbank channels are dedispersed by convolving with the dedispersion response function. This removes the dispersion introduced by the ISM completely in the filter channels. As a last step, the correction of dispersion across the channels is done by introducing a time shift in the filter channel, calculated from the center frequency of the channel and the of the pulsar.
The coherent filterbank method described above suffers from spectral leakage, where the power from adjacent filter channels have only 13dB of suppression, or about 20% of the power from adjacent channels leaks into any given channel. To reduce spectral leakage, one can take longer FFTs or use a windowing function on the data before taking the FFT. The former method (van Straten 2003) is used in our software. In our implementation, as a first step, a large K-point forward FFT is computed, where and is the number of filter channels required. In the second step, each N-point segment is multiplied by the dedispersion response function tuned to center frequency of the channel. This is then followed by inverse N-point FFTs, giving an N-point time series in each of channels. Using the standard TEMPO timing solution, data is folded at the pulse period in each channel, resulting in average pulse profiles. If desired, single pulse outputs are written to the disk. The method described here is available as an open source package, DSP for Pulsars, DSPSR666http://dspsr.sourceforge.net/. The PSRCHIVE777http://psrchive.sourceforge.net/ (Hotan et al. 2004) utilities provide additional analysis and viewing capabilities. Using PSRCHIVE utilities, full Stokes parameters can be formed, reduced data can be converted to other formats, data affected by interference removed from selected channels, and reduced data can be viewed.
For single pulse work, the DSPSR reduction software currently allows data reduction up to a maximum time resolution of 25ns, which is permitted by the sampling clock of the pulsar signal and the WSRT Tied Array Interface. Data from the maximum possible eight 20MHz subbands can be combined in software as discussed in Soglasnov et al. (2004), resulting in a maximum time resolution of 3.125ns. This software is still under development.
The compute cluster in PuMa II is used to process data using this software. The cluster runs an open source version of Grid Engine utility from Sun Microsystems Inc., with which the processing tasks are submitted to a job queue. The data are read from the storage cluster, and reduced in the compute cluster. The results are copied to the archival nodes, and written to magnetic tapes using another utility.
3.3.3 Telescope software
The WSRT uses a large software application, the Telescope Management System (TMS), to control telescope tracking, feeds in the frontend, and all of the backend hardware. PuMa II has a software interface to TMS giving full control over data acquisition. This is done in two steps.
-
•
prepare a specification file before observation
-
•
specify parameters and start an observation using TMS.
In step 1, the pulsar astronomer specifies details on how the data have to be recorded which includes the frequency band to be recorded, the down sampling rate and the data disk. This information is stored in a text file. This will be expanded in the future to include processing details like number of frequency channels needed, folding options and single pulse dumps. The second step of an observation is the specification of an observation using TMS. When an observation is fully specified, TMS steers all the telescopes, chooses the right feed in the frontend, sets the local oscillator in the frontend for the proper sky frequency, and configures the backend hardware to add signals. The correlator backend is enabled by default, and computes cross correlation products across all possible baselines in the array for all observations carried out at the WSRT. If a pulsar observation was requested, the name of the file specified in step 1 is sent as a parameter to PuMa II. A sub-program of TMS communicates with PuMa II and monitors it continuously. This combination of TMS and the control software in PuMa II makes pulsar observations very user friendly. An additional software component in PuMa II will be added in the future to allow automatic reduction of data.
4 Observations
PuMa II obtained first light on the pulsar PSR B0329+54 in April 2004, with a 20 MHz band. The instrument has undergone several refinements since then to support 820 MHz dual polarization operation and to allow full control of PuMa II by the telescope management software. Some examples of the observations below gives a flavour of the new instrument’s capabilities in combination with the WSRT. The data were recorded on PuMa II and processed using the coherent filter bank software and all four polarization products were formed. The post processing analysis was done using the PSRCHIVE utilities.
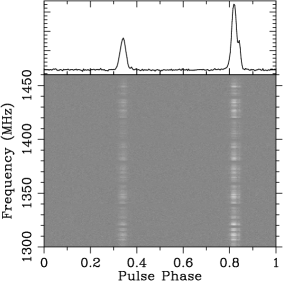
4.1 PSR B1937+21
PSR B1937+21, the original millisecond pulsar, is the second fastest spinning pulsar, with a period of 1.55 msec (Backer et al. 1982). The pulsar is an isolated millisecond pulsar, with a low spin down rate and is known to emit giant pulses (Cognard et al. 1996). This pulsar is observed regularly at the WSRT in several frequency bands as a part of the European Pulsar Timing Array. As an illustration of PuMa II’s capabilities, we present a 21cm band observation on 10 Nov 2006 at a sky frequency of 1380 MHz with 160 MHz bandwidth in dual linear polarizations. The pulsar was observed for 20 minutes and the pulsar signal was baseband recorded as 820 MHz subbands. The recorded data were coherently dedispersed in the compute cluster of PuMa II, using a 64-channel filterbank, resulting in a time resolution of 6 s. The data were then folded to generate an average pulse profile every 10 seconds. The baseband recording generates an 800 MB file every 10 seconds, and the 20-minute observation resulted in 120 files amounting 96 GB per node or a total of 768 GB for all eight nodes. The 10-second average pulse profiles are integrated in time, and then combined in frequency using PSRCHIVE utilities. Figure 5 shows the results from processed and reduced data. The typical error in an individual time of arrival (TOA) measurement of PSR B1937+21 with PuMa II is 60 ns. The best TOA error that could be measured with the PuMa I system, for an equivalent observation duration, was 150 ns and the typical error was 280 ns. We have not yet been observing with PuMa II sufficiently long to be able to do a clear comparison of the long term timing solution for any pulsar.
4.2 The Crab Pulsar Giant Pulses
The Crab Pulsar emits broadband, narrow and very bright pulses, known as giant pulses (GP). The pulsar was discovered through the GP emission (Staelin & Reifenstein 1968). It has also been found that a significant contribution to the average radio pulse profile comes from the giant pulse emission (Popov et al. 2006). We observed the Crab Pulsar, B0531+21 at 1400 MHz for 6 hours on 11 October 2004. The results from the analysis of the data will be published elsewhere.

The data were coherently dedispersed based on the Crab Pulsar monthly ephemeris888http://www.jb.man.ac.uk/pulsar/crab.html maintained by Jodrell Bank Observatory. The data were processed in the PuMa II cluster using the coherently dedispersed single pulse dump mode with a 32-channel filterbank. The four polarization products are written to the disk per pulse period with a final time resolution of 4.2 s. Even though giant pulses from the Crab are can be as narrow as 0.4 ns (Hankins & Eilek 2007), at 1380 MHz, scattering broadening limits time resolution to 4s (Sallmen et al. 1999). In addition to this fast dump, an average pulse profile was formed every 10 seconds by folding the data at the pulse period, after dedispersion. A total of 7500 simultaneous giant pulse events were detected in all observed subbands. A 7 detection threshold was used to mark giant pulses. Figure 6 shows one of these giant pulses that occurred simultaneously in all seven bands. The pulse shown at 1410 MHz has a peak S/N of 870.
4.3 PSR B1133+16
PSR B1133+16 is a nearby pulsar with a period of 1.18s and a DM of 4.864999Pulsar catalog: http://www.atnf.csiro.au/research/pulsar/psrcat (Hobbs et al. 2004; Manchester et al. 2005). Giant pulse like events were reported from this pulsar (Kramer et al. 2003) at 4.85 GHz. PSR B1133+16 was observed at the WSRT on 11 May 2007, at eight 2.5 MHz relatively interference free frequency bands centred at 116.75, 130, 139.75,142.25,147.5,156,163.5 and 173.75 MHz. With a 64 channel filterbank and coherent dedispersion, the reduced data resulted in a final time resolution of 256 s. We have seen giant pulse like features in our data. The narrowest pulse is 1ms wide with an intensity of 2000 Jy and the pulse is shown in Figure 7. This is the first detection of giant pulses at this low frequency and the detection of these narrow features at low frequencies would be a formidable task with an analog filterbank which would need to have a large number of narrow filters to correct for dispersion effectively. The utility of software coherent dedispersion aided by baseband recording is evident in this case.

4.4 PSR J1713+0747
The baseband sampling nature of PuMa II means that polarization data is obtained routinely. An example of this is shown in Figure 8. The millisecond pulsar PSR J1713+0747 was regularly observed at the WSRT with PuMa I, and we use the ephemeris from these observations to reduce the data from PuMa II. Pulsar PSR J1713+0747 was observed with the WSRT on 2 December 2006 at 1380 MHz and 160 MHz bandwidth. The signal was recorded in dual polarization 820MHz basebands on PuMa II. The data were coherently dedispersed and folded using a 64-channel (in each 20 MHz band) filterbank. All four polarization products were formed. Comparison with the most recently published polarization profile of this source by Ord et al. (2004) shows an increased level of linearly polarized flux in the PuMa II data. This can be understood by considering the two-bit quantization artifact known as scattered power (Jenet & Anderson 1998), which adds unpolarized flux to the digitized signal. To systematically alter the integrated profile, the scattered power must vary as a function of pulse phase, which is true when the dispersion smearing across the digitized band is less than the pulsar’s spin period. For the CPSR-II observations of PSR J1713+0747 presented by Ord et al. (2004) (a 64 MHz band centred at 1373 MHz), the dispersion smearing is approximately 3.3 ms, which is less than the spin period of 4.57 ms. Therefore, the Ord et al. (2004) result has been depolarized during two-bit digitization.

The signals from the 14 telescopes of the WSRT are also quantized using two bits; however, because the scattered power does not add coherently, there is a reduction of quantization noise in the signal output by the TAAM. The difference between depolarization of CPSR-II data and depolarization of PuMa II data can account for the increase in the degree of linear polarization observed in Figure 8.
5 Similar Instruments
Most current generation pulsar machines are fully digital, except for the very first input stages. The cost of computation has decreased continuously permitting widespread use of coherent dedispersion. High time resolution can only be achieved if large bandwidths are coherently dedispersed and this needs raw voltages from the telescope, recorded as baseband signal on disk or magnetic tape. However this method cannot be used on large bandwidth, multi-bit data for long recording duration due to the prohibitive date rates and volume. It is therefore useful to break down large bands into smaller subbands, and then apply coherent dedispersion. The resulting data rates are more manageable. This has an added advantage of efficient data reduction by distributing the data in a computer cluster environment. Some of these systems are compared with PuMa II.
Jenet et al. (1997) built recorders based on magnetic media that provided up to 50 MHz bandwidth.van Straten (2003) describes baseband recorders that allowed up to 128 MHz bandwidth. However, all these systems were 2-bit recorders, requiring extensive quantization correction.Vôute et al. (2002) designed PuMa I, which provided limited baseband recording capability, and a flexible digital filterbank. This was based on the digital signal processor technology. Instruments like ASP101010http://astro.berkeley.edu/dbacker/asp.html offered up to 64 MHz of 4-bit baseband recording. Another coherent dedispersion instrument supporting up to a maximum of 100 MHz bandwidth is COBRA111111http://www.jb.man.ac.uk/pulsar/cobra/, where the signal is sampled using 8-bit and 1010MHz subbands. In PuMa II the signal is sampled and recorded as 8-bit values supporting a total bandwidth of 160 MHz. Coherent dedispersion is the default mode of operation in PuMa II. Other very wide band (600 MHz) instruments (Spigot: Kaplan et al. 2005) are based on autocorrelation spectrometers allowing incoherent dedispersion. Such wide band systems are, however, more common in single dish telescopes, due to complexities in wide band beam forming in a synthesis array.
Hardware based techniques is another possibility to process large volumes of data efficiently. Such systems were built in the past, based on discrete integrated circuits with limitations in bandwidth that can dedispersed, the observing frequency and the DM of the pulsar (Backer et al. 1997). Moreover in such systems, the data were averaged immediately which was not amenable to fast dump modes limiting the detection of single pulses. The progress in FPGA technology holds some promise in this direction, and is currently being explored (private communication, Scott N. Ransom, NRAO). This instrument121212https://wikio.nrao.edu/bin/view/CICADA/NGNPP(under development), will support up to 800 MHz of bandwidth with the signal sampled at 8-bit resolution. FPGA based coherent dedispersion will be done on smaller subbands and a limited range of pulsar dispersion measures.
5.1 Comparison with PuMa I
PuMa I has been the work horse in all pulsar observations carried out at the WSRT. The instrument records a maximum of 10 MHz dual polarization signals in the 2-bit baseband recording mode, or 80 MHz when operating in incoherent filter bank mode. PuMa I can also operate as a 8-bit baseband recorder, if the bandwidth is reduced to 2.5 MHz. PuMa II operates only in baseband recording mode, and supports 8-bit sampling and a 160 MHz of bandwidth. Since the sensitivity to pulsar signals is , where is the bandwidth used and is the integration time, the large bandwidth in PuMa II has a clear advantage in terms of time resolution achievable and sensitivity. The sensitivity improvement in PuMa II is at least , when PuMa I operates in the 80MHz filterbank mode. The improvement is a factor of 4, when PuMa I is used in the 10MHz baseband recording mode. In practice, PuMa II is more flexible in operation, whereas the design of PuMa I requires specialist knowledge. PuMa II is being used successfully in all millisecond pulsar observations with an excellent time resolution. As discussed earlier, the timing of PSR B1937+21 shows at least a four fold decrease in time of arrival uncertainty using PuMa II. For pulsars like PSR J0034-0534, the brightest millisecond pulsar at low radio frequencies, this improvement is even more pronounced as the advantages of coherent dedispersion are more apparent.
The 8-bit operation of PuMa II has an advantage over the 2-bit baseband mode of PuMa I. The S/N of the digitized pulsar signal is a function of the number bits used to represent the signal (Kouwenhoven & Voûte 2001), and hence PuMa II offers a better dynamic range to the input signal. The improved dynamic range is important when radio-frequency interference (RFI) rejection algorithms are used to mitigate interference. RFI is detrimental to all radio astronomy experiments, since they add or remove information from the radio signals of astronomical origin. Stairs et al. (2000) describes a method to combat RFI, where the signal is cleaned by examining the data in both time and Fourier domains to eliminate broadband and narrow band interferences respectively. Such techniques are effective when the signal has a high dynamic range resulting from the multi-bit sampling.
The design of PuMa I and its interface to the WSRT involves sampling of analog voltages twice in the signal path. This introduces quantization noise, making PuMa I less sensitive, while PuMa II has a single quantization step in the signal chain improving the noise performance.
6 Conclusion
We have built and installed a new pulsar machine, PuMa II at the WSRT. The basic mode of operation in PuMa II is the distributed baseband recording mode, where a 160-MHz dual-polarization analog band is digitized as 2820 MHz subbands with 8-bit resolution and stored on disk attached to storage nodes. The data are processed in a separate computer cluster. This is done in PuMa II by the separation of a single cluster into three subclusters: a 10-node storage cluster with large disks for distributed recording, a 32-node compute cluster for data processing and two nodes equipped with high density tape drives for archiving reduced data. The separation allows a large throughput of 640 MB/s to the disks in baseband recording mode, while data are farmed out to the compute cluster for further processing. This results in a near real time data reduction for most pulsars observed at the WSRT. A total disk space of 32 TB distributed in 8 storage nodes allows 12 hours of continuous recording. Software based data processing makes PuMa II a flexible instrument, addressing a wide variety of signal processing tasks. For pulsar science, a software based coherent dedispersion method offers a routine time resolution up to 50ns. The instrument has excellent performance in terms of time resolution and flexibility. It also illustrates that large bandwidth baseband recording is possible, and future technology will offer even larger bandwidths. The software based processing offers full flexibility in processing the data, including RFI excision, which is becoming more important as the spectrum is crowded with commercial operators. The modular design of the instrument allows straight forward upgrades, for either larger bandwidth or longer storage. Possibilities exist to make the instrument even more flexible, with additional hardware under consideration, for e.g FPGA based hardware polyphase filterbanks. Combined with data averaging, this would reduce data rate, and allow longer integration times.
7 Acknowledgments
References
- Baars & Hooghoudt (1974) Baars, J. W. M. & Hooghoudt, B. G. 1974, A&A, 31, 323
- Backer et al. (1997) Backer, D. C., Dexter, M. R., Zepka, A., D., N., Wertheimer, D. J., Ray, P. S., & Foster, R. S. 1997, PASP, 109, 61
- Backer et al. (1982) Backer, D. C., Kulkarni, S. R., Heiles, C., Davis, M. M., & Goss, W. M. 1982, Nature, 300, 615
- Cognard et al. (1996) Cognard, I., Shrauner, J. A., Taylor, J. H., & Thorsett, S. E. 1996, Astrophys. J., Lett., 457, 81
- Demorest (2007) Demorest, P. 2007, PhD thesis, University of California, Berkeley
- Hanado et al. (1995) Hanado, Y., Imae, M., & Sekido, M. 1995, IEEE Transactions on Instrumentation and Measurement, 44, 107
- Hankins (1971) Hankins, T. H. 1971, Astrophys. J., 169, 487
- Hankins & Eilek (2007) Hankins, T. H. & Eilek, J. A. 2007, ArXiv e-prints, 708
- Hankins & Rickett (1975) Hankins, T. H. & Rickett, B. J. 1975, in Methods in Computational Physics Volume 14 — Radio Astronomy (New York: Academic Press), 55–129
- Hankins et al. (1987) Hankins, T. H., Stinebring, D. R., & Rawley, L. A. 1987, Astrophys. J., 315, 149
- Hessels et al. (2006) Hessels, J. W. T., Ransom, S. M., Stairs, I. H., Freire, P. C. C., Kaspi, V. M., & Camilo, F. 2006, Science, 311, 1901
- Hobbs et al. (2004) Hobbs, G., Lyne, A. G., Kramer, M., Martin, C. E., & Jordan, C. 2004, MNRAS, 353, 1311
- Hotan (2005) Hotan, A. W. 2005, in Astronomical Society of the Pacific Conference Series, Vol. 328, Binary Radio Pulsars, ed. F. A. Rasio & I. H. Stairs, 377–+
- Hotan et al. (2004) Hotan, A. W., van Straten, W., & Manchester, R. N. 2004, Proc. Astron. Soc. Aust., 21, 302
- Jenet & Anderson (1998) Jenet, F. A. & Anderson, S. B. 1998, PASP, 110, 1467
- Jenet et al. (1997) Jenet, F. A., Cook, W. R., Prince, T. A., & Unwin, S. C. 1997, PASP, 109, 707
- Kaplan et al. (2005) Kaplan, D. L., Escoffier, R. P., Lacasse, R. J., O’Neil, K., Ford, J. M., Ransom, S. M., Anderson, S. B., Cordes, J. M., Lazio, T. J. W., & Kulkarni, S. R. 2005, PASP, 117, 643
- Kouwenhoven & Voûte (2001) Kouwenhoven, M. L. A. & Voûte, J. L. L. 2001, Astron. Astrophys., 378, 700
- Kramer et al. (2003) Kramer, M., Karastergiou, A., Gupta, Y., Johnston, S., Bhat, N. D. R., & Lyne, A. G. 2003, Astron. Astrophys., 407, 655
- Manchester et al. (2005) Manchester, R. N., Hobbs, G. B., Teoh, A., & Hobbs, M. 2005, Astron. J., 129, 1993
- Navarro (1994) Navarro, J. 1994, PhD thesis, California Institute of Technology
- Ord et al. (2004) Ord, S. M., van Straten, W., Hotan, A. W., & Bailes, M. 2004, MNRAS, 352, 804
- Popov et al. (2006) Popov, M., Soglasnov, V., Kondrat’ev, V., Kostyuk, S., Ilyasov, Y., & Oreshko, V. 2006, Astronomy Letters, 50, 55
- Sallmen et al. (1999) Sallmen, S., Backer, D. C., Hankins, T. H., Moffett, D., & Lundgren, S. 1999, Astrophys. J., 517, 460
- Soglasnov et al. (2004) Soglasnov, V. A., Popov, M. V., Bartel, N., Cannon, W., Novikov, A. Y., Kondratiev, V. I., & Altunin, V. I. 2004, Astrophys. J., 616, 439
- Staelin & Reifenstein (1968) Staelin, D. H. & Reifenstein, E. C. 1968, Science, 162, 1481
- Stairs et al. (2000) Stairs, I. H., Splaver, E. M., Thorsett, S. E., Nice, D. J., & Taylor, J. H. 2000, MNRAS, 314, 459, (astro-ph/9912272)
- Stinebring et al. (1992) Stinebring, D. R., Kaspi, V. M., Nice, D. J., Ryba, M. F., Taylor, J. H., Thorsett, S. E., & Hankins, T. H. 1992, Rev. Sci. Instrum., 63, 3551
- Stinebring et al. (1990) Stinebring, D. R., Ryba, M. F., Taylor, J. H., & Romani, R. W. 1990, Phys. Rev. Lett., 65, 285
- Vaidyanathan (1992) Vaidyanathan, P. 1992, Multirate Systems and Filter Banks (Prentice Hall), 113–117
- van Straten (2003) van Straten, W. 2003, PhD thesis, Swinburne University of Technology
- Vôute et al. (2002) Vôute, J. L. L., Kouwenhoven, M. L. A., van Haren, P. C., Langerak, J. J., Stappers, B. W., Driesens, D., Ramachandran, R., & Beijaard, T. D. 2002, Astron. Astrophys., 385, 733