VHE emission from M 82
Spurred by the improved measurement sensitivity in the very-high-energy (VHE: 100 GeV) -ray band, we assess the feasibility of detection of the nearby starburst galaxy M 82. VHE emission is expected to be predominantly from the decay of neutral pions which are produced in energetic proton interactions with ambient protons. An estimate of VHE emission from this process is obtained by an approximate, semi-quantitative calculation, and also by a detailed numerical treatment based on a convection-diffusion model for energetic electron and proton propagation and energy losses. All relevant hadronic and leptonic processes are considered, gauged by the measured synchrotron radio emission from the inner disk region. We estimate an integrated flux 100 GeV)210-12 cm-2s-1, possibly detectable by the current northern-hemisphere imaging air Cherenkov telescopes, MAGIC and VERITAS, and a good candidate for detection with the upcoming MAGIC II telescope. We also estimate 100 MeV)10-8 cm-2s-1, a level of emission that can be detected by GLAST/LAT based on the projected sensitivity for a one year observation.
Key Words.:
Acceleration of particles, ISM: cosmic rays, Galaxies: general, Galaxies: starburst, Galaxies: individual: M 82, Radiation mechanisms: non-thermal, Stars: formation1 Introduction
In the central regions of starburst galaxies (SBGs) high level of star formation (SF) activity powers the emission of radiation directly by supernovae (SN) and massive stars, and indirectly by SN shock heating of interstellar gas and dust, as well as from radiative processes involving electrons and protons that are accelerated by SN shocks. Kinetic energy of the non-thermally distributed electrons and protons is partly channeled into radio to the high-energy -ray emission. In particular, radiation in the very-high-energy (VHE: 100 GeV) -ray region is emitted predominantly in decay, following the production of the pions in energetic proton interactions with protons in the gas, and by relativistic electrons traversing (relatively) strong magnetic field and scattering off the intense radiation field in the galactic disk.
The level of high-energy phenomena in intensely active galaxies makes AGN obvious targets of searches for VHE emission, and indeed some 15 blazars have already been detected by H.E.S.S. and MAGIC (e.g., Persic & De Angelis 2008). Various issues in the study of non-thermal phenomena in ‘normal’ and starburst galaxies are no less interesting and important. Valuable insight can be gained on the origin and propagation modes of relativistic electrons and protons by probing their radiation yields across the electromagnetic spectrum. Knowledge of the low energy densities of these particles is important also for quantifying their impact on interstellar gas.
At a distance 3.6 Mpc (Freedman et al. 1994), the SB galaxy M 82 is a good candidate for an initial search for TeV emission from a galaxy whose emission is not AGN-dominated. Its far-infrared (FIR) and X-ray luminosities imply high SF rates (e.g., Persic & Rephaeli 2007), and a correspondingly high SN rate of 0.3 yr-1 (Rieke et al. 1980). In most respects, levels of activity in M 82 surpass those in the other nearby starburst galaxy, NGC 253, making it a very good target for TeV observations, also in view of its large reservoir of diffuse gas (109; Casasola et al. 2004).
In order to realistically estimate non-thermal emission from cosmic-ray electrons and protons, we start with the initial spectrum that characterizes their momentum distribution at the acceleration sites, and follow the evolution of the spectrum as the particles diffuse and are convected from the inner SB region to the outer disk (and halo). All the relevant leptonic and hadronic interactions are included in a numerical program we have developed for this purpose. Using this program we can determine the particle spatial and energy distributions, and their respective radiative yield across the galaxy. For a more intuitive approach, and in order to compare with previous semi-quantitative estimates, we also use a simple analytical model of the diffuse hadronic emission of M 82, that ties the predicted -ray flux to the measured on-site synchrotron radio flux by assuming energetic particles and magnetic field to be in energy equipartition.
In Section 2 we briefly review the basic features of predicted particle source spectra, the relation between the cosmic-ray electron and proton components, and key aspects of their energy-loss processes and propagation in galaxies. We then summarize the main features of our numerical program which is used to determine the particle spectro-spatial distribution. In Section 3 we present a specific estimate of the hadronic emission from M 82 based on our approximate analytical treatment. Results of our detailed numerical analysis are presented in Section 4, and discussed in Section 5.
2 Particle spectra and energy-loss processes
2.1 Particle source spectra
SN shock wave sweeps and compresses circumstellar material with a compression ratio 1)/[12, where 5/3 is the specific heat ratio, is the speed of sound () in units of the Alfvén velocity (), and is the Alfvénic Mach number of the shock, with denoting the upstream velocity of the gas. Particle acceleration by the shock modifies the momentum distribution to a power-law whose index depends on . When particles with initial momentum are overtaken by the shock, the resulting downstream phase space distribution function is (for ) where 1)1)/2 (Krymsky 1977, Axford et al. 1977, Bell 1978, and Blandford & Ostriker 1978). The ensuing number density of accelerated particles per momentum interval is with 2. It can be readily seen that in the relativistic regime the particle density per unit energy interval has the same index, . The strong shock limit has 4, i.e. 2, a well-known result for the first-order Fermi acceleration mechanism (e.g., Protheroe & Clay 2004).
Particles can be accelerated to very high energies (1014 eV) even by the non-relativistic shocks in SN remnants (Aharonian et al. 2007), which are the accelerators of relevance to us here. The steepening of the particle power-law distribution to (due to energy losses outside the source region) implies that – for our purposes here – the specific value of the high-energy cutoff is irrelevant. For non-relativistic shock acceleration the lowest kinetic energy can be assumed to be the thermal energy of the gas, which is the source of accelerated particles.
It is perhaps useful to outline the following simple – if physically uncertain – prediction (Schlickeiser 2002; Bell 1978) for the proton to electron (p/e) ratio: Assume that electrons and protons are accelerated out of a thermal (few keV), electrically neutral plasma reservoir to high () kinetic energies according to the same differential power-law momentum spectrum, with ie,p, maintaining charge neutrality. 111 It may be argued that charge neutrality does not necessarily require equal numbers of positive and negative charges to be accelerated. Very minute current flows in the thermal plasma can easily compensate for any charge imbalance in the accelerated particles. Indeed, because electrons have much higher losses and different diffusion properties, some degree of charge neutrality could develop during propagation away from the acceleration sites.
Under these assumptions, the p/e number and energy density ratios in the source region can be analytically calculated. As function of kinetic energy , where is the particle Lorentz factor, the p/e number density ratio is found to be
| (1) |
with and the electron and proton masses. This ratio assumes the following limiting forms:
| (5) |
In particular, the ratio reaches its maximum value, (for 1), over most of the range of particle energies.
Similarly, the p/e energy density ratio,
| (6) |
can be expressed in terms of the spectral index ,
| (7) | |||||
For example, if 2.3, then /15, and /1.3102 at 1 GeV. These are approximately the values measured for Galactic cosmic rays (e.g., Schlickeiser 2002).
The spectrum of relativistic electrons is obviously more easily measured due to their much more efficient radiative losses. Most readily observed is electron synchrotron radio emission, which we will use to infer in the region where the radio emission is observed. To relate this quantity to the source spectrum we need to solve the kinetic equation describing the propagation mode and energy losses incurred by electrons as they move out from their SN shock regions. Using the above predicted proton to electron ratio at their common region, and accounting for proton propagation mode and energy losses, we can then deduce the proton spectrum from the electron spectrum. Clearly, even if the propagation modes of protons to electrons are similar, their losses are very different; thus, should be inferred from particle number conservation.
2.2 Steady-state particle spectra
The enhanced SF activity in a starburst galaxy lasts for yr, which is also the timescale over which global SN shock acceleration is prevalent. Estimated times for propagation out of the disk and inner galactic halo are about an order of magnitude lower for low energy particles. High energy particles lose energy on much shorter timescales. Thus, particle spectra evolve considerably as they propagate out of their acceleration sites. As long as typical acceleration times are comparable to or shorter than loss times for sufficiently high energies, a steady state can be attained, with particle spectra which are obviously steeper than their respective source spectra. Strictly speaking, we assume that steady state is attained and proceed to solve the kinetic equation for , where and are the 2D spatial radius and the coordinate perpendicular to the galactic plane, respectively.
A full calculation of the particle steady state spectra is necessarily extensive as it must include all the important energy loss mechanisms and modes of propagation. We have employed the numerical code of Arieli & Rephaeli (Arieli & Rephaeli, in preparation), which is based on a modified version of the GALPROP code (Moskalenko & Strong 1998, Moskalenko et al. 2003), that has been developed for this purpose. The code solves the exact Fokker-Planck transport diffusion-convection equation (e.g., Lerche & Schlickeiser 1982) in 3D with given source distributions and boundary conditions for electrons and protons. Evolution of the particle energy and spatial distribution function is based on diffusion, and convection by galactic wind. (We note that some of the additional processes included in the original code, such as diffusive re-acceleration, nuclear fragmentation, and radioactive decay, are not relevant for our purposes here.) Logarithmic coordinates are used for high spatial resolution.
The main focus of this first phase of our work is the estimation of the high energy flux of M 82. An approximate estimate of the high energy -ray emission can be obtained by a simple and intuitive calculation that is based on sampling the electron energy spectrum from the main observable – the radio synchrotron flux. However, because the electron spectrum needs to be extrapolated to energies much higher than the GeV range directly inferred from radio measurements, realistic estimates of the TeV emission necessitates a detailed (numerical) treatment. To illustrate this, and to provide insight on the results from the more accurate numerical calculation, we first outline the intuitive calculation.
2.3 Energy-loss processes
At energies below few hundred MeV, electrons lose energy mostly by Coulomb interactions with gas particles, leading to ionization of neutral and charged ions, and electronic excitations in fully ionized gas. At higher energies the dominant energy losses are via synchrotron emission, and Compton scattering by the FIR and optical radiation fields. These well known processes need no elaboration; the level of the ensuing emission depends on the mean strength of the magnetic field, , and the energy density of the radiation fields, which are specified below.
2.3.1 Gauging particle spectra by radio emission
The electron population consists mostly of directly accelerated (primary) electrons, which can be represented by a single power-law (in terms of the Lorentz factor)
| (8) |
for . The electron synchrotron flux from a spherical region of radius with magnetic field , located at a distance , is
| (9) | |||||
where is defined and tabulated in, e.g., Tucker (1975).
Setting 1 GHz and , from Eq.(9) the normalization of the electron spectrum is
| (10) |
A second relation is required to separately estimate and . This is provided by assuming that the energy density is equipartitioned between particles (electrons and protons) and the magnetic field,
| (11) |
The electron energy density is = , where 100 corresponds to the energy below which Coulomb losses exceed synchrotron losses (the detailed number depends on the ambient, mostly thermal, density and magnetic field; e.g., Rephaeli 1979). For 2 and , we get . Substituting the expression for from Eq.(10), we have
| (12) |
Equation (12), together with Eqs.(6) and (11), then leads to
| (13) | |||||
From the above relations it can be readily seen that if the flux, source size, distance, and the spectral index of the emitting electron population () are known, then the source magnetic field – and hence the particle energy density – can be evaluated. For example, if 2.5 (which corresponds to a typical galactic radio spectral index of 0.75, and entails 0.0852 and 8) and , we obtain 61G, 10.25 eV cm-3, 82 eV cm-3, 10cm-3.
2.3.2 FIR radiation and Compton X-ray emission
In intensely star-forming regions the stellar IMF is top-heavy (e.g., Mayya et al. 2007), so massive stars are proportionally more abundant there than in more typical Galactic environments. During most of their lifetimes massive stars are embedded in the dense, highly extinguished regions (giant molecular clouds) where they were born (e.g., Silva et al. 1998). The radiation emitted by these stars peaks in the UV, which is very efficiently absorbed by the embedding dusty clouds and is re-emitted in the FIR. Therefore the local radiation field is most intense in the FIR region, where it can be described as an isotropic, diluted, modified blackbody with temperature and spatial dilution factor :
| (14) |
with , for which we choose 1 (e.g., Goldshmidt & Rephaeli 1995), and corresponding to 21012 Hz (Yun & Carilli 2002, and references therein). For a given , the energy density of the warm dust, , can then be computed; comparison with the observed value, /, where is the radius of the accelerating source, yields .
When electrons whose energy distribution is as in Eq.(8) interact with this FIR radiation, the spectral emissivity of the isotropically Compton-scattered radiation is (e.g., Rybicki & Lightman 1979)
| (15) | |||||
where , with and denoting the Gamma function and the Riemann zeta function. For GeV electrons and typical dust temperatures, most of the emission is in the X-ray region.
2.3.3 -ray emission from decay
Proton energy losses at low energies are also dominated by Coulomb interactions with gas particles. At energies above pion masses (140 MeV), the main energy-loss process is by interactions with ambient protons; the yield from this process are neutral () and charged () pions. Neutral pions decay into photons, while the decays of yield relativistic e++e- and neutrinos.
The integral spectral emissivity from decay is:
| (16) |
(Drury et al. 1994), where 2. This emissivity is very strongly dependent on the proton power-law index; e.g., for momentum distribution indices 4.1, 4.3, 4.5, 4.7, we deduce (using tabulated values from Drury et al. 1994) that the 100 GeV emissivity, 100 GeV), equals 1.310-16, 4.210-17, 9.510-18, 1.910-18 (erg cm-3)-1 (H atom)-1 s-1, respectively.
The integrated -ray photon luminosity of a source with gas density and proton energy density in a volume is then
| (17) |
where both and depend on the relativistic protons’ spectral slope, .
3 VHE emission from M 82: approximate treatment
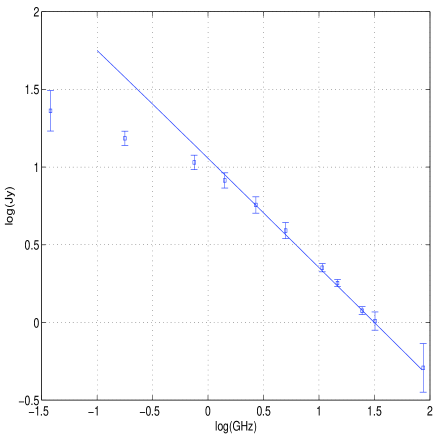
In this section we estimate the level of VHE emission from hadronic interactions in M 82, the most prominent nearby ( Mpc) starburst galaxy. The radio emission of M 82 is observed to be power-law from 22.25 MHz to 41 GHz with a flux of 10 Jy at 1 GHz, and the spectrum steepening from (Carlstrom & Kronberg 1991) in the central starburst (defined here as a region with a radius of 300 pc and height of 200 pc; e.g., Völk et al. 1996, Mayya et al. 2006) to (Klein et al. 1988, Seaquist & Odegard 1990) in the outer disk. The high-frequency radio data from the central disk region are shown in Figure 1. While there is some curvature in the radio spectrum, because we are mostly interested here in the high-energy end of the electron spectrum, this curvature is ignored and we fit the spectrum by a single power-law model. We infer that the synchrotron radio emission is from a population of relativistic electrons whose energy spectrum – in the region sampled by the observed radio emission – is a power-law with index 2.42.
Using the implied value of , from Eqs.(5) and (7) we obtain 10 and 2102. Estimates of the Galactic values of these energy densities are 0.3 eV cm-3 and 0.03 eV cm-3, hence 10 (see Schlickeiser 2002), and /102 at 1 GeV. The values of the two ratios are then quite similar in the two galaxies, in spite of their very different environments.
This similarity can be understood by the following argument. Typical SNR ages (hence, the duration of the acceleration processes), 2104 yr, are much shorter than the characteristic energy-loss timescales of both electrons and protons in the remnant (even for the strongest magnetic fields in SNRs allowed by current IACT data, G; e.g., Berezhko & Völk 2006), 1 Gyr and 0.5 Myr for GeV protons and electrons, respectively. Because of this, and the scaling of acceleration processes and propagation by rigidity, protons and electrons in the central disk region are expected to retain approximate similarity of their spectra at low to moderate energies (which dominate the particle distributions). Thus, the spectra have roughly the same spectral index both at injection (2) and, after injection, while diffusing in the central disk with a diffusion coefficient with 0.5 (2.5) (e.g., Büsching et al. 2001). This will hold both in the very actively star-forming central region of M 82 and in the relatively quiescent Galactic environment.
Using 2.42 (that entails 0.09 and 10), Eqs.(13), (10), (12), and the above-quoted parameters appropriate for M 82 (which entail 7.2), we derive: 106 G, 1.410-4 cm-3, 25 eV cm-3, and 250 eV cm-3.
3.1 X-ray emission
Nonthermal X-ray emission is mostly by Compton scattering of the electrons by the FIR radiation field. To estimate the level of this emission, we first determine the energy density of the FIR field, whose dilution constant, , which appears in Eq.(14), is evaluated as follows. Using (Carlstrom & Kronberg 1991) in Eq.(14), the warm dust energy density is 10-8 erg cm-3. On the other hand, the measured flux is 6.510-8 erg cm-2 s-1, so that the observationally deduced value is /1.2610-9. Equating to yields 0.023. (This value is slightly reduced if one corrects the observed FIR luminosity of M 82 for cirrus emission.)
From Eq.(LABEL:eq:IC) the differential Compton flux from the central SB of M 82 is 410-13 erg cm-2 s-1 keV-1.
The emission is clearly in the X-ray range; e.g., electrons with as low as 150 and 350 boost a 60m photon (representative of the FIR field) to, respectively, 2 keV and 10 keV. Given their steep energy distribution, only electrons of relatively low energy will be effective in generating a substantial Compton flux. Thus, electrons with 1001000 scattering off the blackbody photons will boost their energies mostly to the 0.4-80 keV band. In particular, the predicted 2-10 keV Compton flux is 10-12 erg cm-2 s-1.
There is yet no unequivocal evidence for nonthermal X-ray emission in M 82. Chandra observations show that some of the 2-10 keV emission in M 82 is diffuse, emanating from a region which roughly overlaps with the central starburst (Griffiths et al. 2000). The 2-10 flux of this diffuse emission is erg s-1, some of the total meassured 2-10 keV emission (e.g., Cappi et al. 1999; Rephaeli & Gruber 2002). Given that some of this diffuse component may be thermal, as suggested by the presence of a substantial 6.7 keV Fe-K emission, the observed diffuse emission is a strong upper limit on our predicted lower Compton contribution.
3.2 VHE -ray emission
The value 2.4 deduced for the central SB region corresponds to 4.4, for which we determine the appropriate value of from Table 1 of Drury et al. (1994), and obtain 8.110 (erg cm-3)-1 atom-1 s-1, which holds down to GeV energies (e.g., Torres 2004; Domingo-Santamarìa 2006).
A rough estimate of the VHE emission from M 82 can be made if it assumed that this emission comes mostly from decay following interactions of energetic protons with ambient protons in the SB region. In this approximate treatment we also ignore contribution to the VHE emission by electron radiative processes. Assuming that acceleration occurs mostly in the central SB (of radius 300 pc), we thus take the proton energy density to be eV cm-3 for , and consider separately the emission from the central SB and the disk:
(i) In the central SB region () the hydrogen mass is mostly molecular, 2 (Weiss et al. 2001). The estimated VHE photon luminosity is then 21039 s-1, which corresponds to cm-2 s-1.
(ii) The disk region external to the central SB, , has a flat thin disk gas distribution, , with 7.51022 cm-2 the effective central density and 0.82 kpc, the radial lengthscale (Mayya et al. 2006). The total gas mass, 2.5, results from 0.7 and 1.8 (Casasola et al. 2004). The energetic proton energy density is assumed to have the form 200 eV cm-3. From
we then obtain 1.9 s-1, that corresponds to cm-2 s-1.
This approximate treatment then yields a total photon luminosity, 2.11040 s-1, which translates to a total flux cm-2 s-1.
Before accepting the above estimate as physically meaningful, we need to ascertain that energetic protons do indeed leave their SN acceleration sites, and that VHE photons propagate freely through the galactic disk. Indeed, even in large, pc, dense molecular clouds with typical ambient proton density of order cm-3, the optical depth to pp interactions is very low, 310-4, where the cross section for pp interactions is mb10-25 cm2 (e.g., Eidelman et al. 2004). This estimate is in obvious agreement with the fact that energetic protons at the relevant energy range are actually detected on Earth.
Absorption of VHE photons is also negligible; the optical depth to pair production by interactions with ambient photons, (where is the target photon number density, is the cross section, and is the distance traveled), is also very small. For TeV photons, the peak cross section, cm2, is for interaction with 2m photons. The 2m luminosity, 21043 erg s-1 (e.g., Silva et al. 1998), implies a 2m photon density of 0.5 cm-3 (with a disk radius 7 kpc), i.e. 10-3. We conclude that absorption of VHE photons in – and indeed also along the l.o.s. to – M 82 is negligible.
4 Particle and radiation spectra in M 82: full numerical treatment
As specified above, the central SB region (which will also referred to as the source region) with a radius of 300 pc and height of 200 pc (e.g., Volk et al. 1996), is identified as the main site of particle acceleration. The superposed particle spectra from all SN shock regions yields the power-law distributions with index (as mentioned in sect.2.1). The theoretically predicted ratio is more likely to be valid in this source region, as is also the assumption of equipartition. Accordingly, we infer in the source region from , which itself is deduced from radio measurements in the central disk, as explained below.
Particles are assumed to be convected out of their sources by the observed wind with velocity of 600 km (Strickland et al. 1997). The convection velocity is assumed to increase linearly with distance from the disk plane. This assumption is consistent with cosmic-ray MHD wind models (e.g. Zirakashvili et al. 1996). The diffusion coefficient is taken as a power-law in rigidity , where is a scale rigidity with a typical index of 0.5. Particle energy losses and propagation outside the source region are followed in detail using the code of Arieli & Rephaeli. To do so we need the neutral and ionized gas densities and their profile, as well as the spatial variation of the mean strength of the magnetic field.
We use the neutral, molecular, ionized gas, and FIR radiation field parameters specified above. Additionally, we assume magnetic flux freezing in the (highly conductive) ionized gas, so that the local magnetic field strength is related to the ionized gas density, , using the scaling (e.g., Rephaeli 1988). Measurements of radio emission from the central disk (Klein et al. 1988), shown in Figure 1 together with our best fit power-law with index of (which is consistent with the results of Klein et al. 1988, and Carlstrom et al. 1993), provide the first relation between the electron density in this region and the magnetic field. Note that we ignore here the flattening indicated in the radio spectrum at 300 MHz (which is possibly due to the increased relative strength of Coulomb losses at low electron energies) since we are primarily interested in the high energy behavior of the electron spectrum. The second required condition to fully determine particle spectra and the magnetic field is the assumption of equipartition in the source region. Due to the implicit dependences in the expression for the synchrotron flux, this condition is implemented iteratively to solve for , , and . With the above parameters the central value of the magnetic field is G.
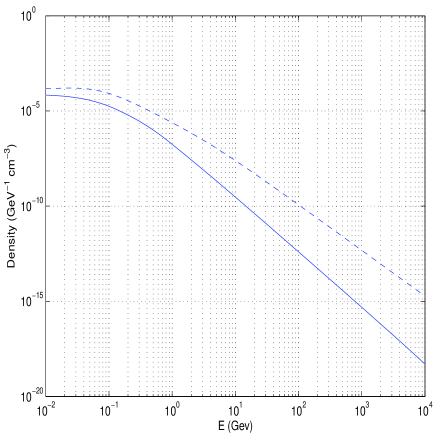
A radio index of 0.7 implies that the electron spectrum in the central disk steepens appreciably to 2.4 (from in the source region). The steady-state electron and proton spectra in the SB region are shown in Fig.2. At low energies both spectra are flat; stronger electron losses at 1 GeV result in a steeper spectrum than that of protons, with the electron spectrum characterized by 2.6 at very high energies.
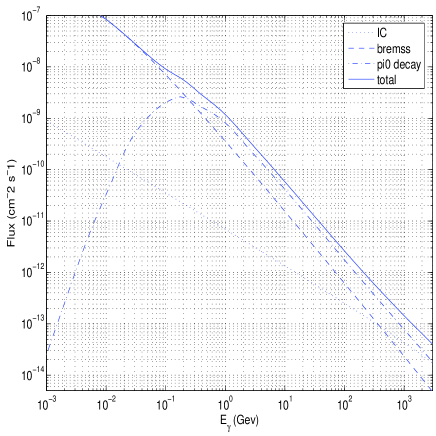
Electron emissions by bremsstrahlung and Compton scattering are shown in Fig. 3; also shown is -ray emission from decay (following pp collisions). As expected, the losses due to bremsstrahlung dominate the lower energy regime, whereas losses due to decay dominate at higher energies. (While synchrotron emission extends to the X-ray region, it is negligible at much higher energies.) Our main interest here is the VHE emission, which – as anticipated – is mainly from the latter process. Specifically, we calculate the total flux from M 82 to be 10-12 cm-2 s-1. The flux at GeV is a factor of 3 higher.
While we are mostly interested here in the VHE photon emission, we note that the related neutrino flux ( eventually produce ) at energies higher than 100 GeV is 0.3100.
The predicted VHE -ray flux is a factor 6 lower than that estimated in the approximate treatment in sect.3.2. Given the nature of the approximations made, and the fact that spatial dependences of the particle densities and magnetic field were altogether ignored, this level of discrepancy is not surprising. The two treatments differ most in the description of the particle spatial profiles outside the source region. In the approximate treatment the impact of energy losses and propagation mode of the protons are not explicitly accounted for; this results in the unrealistically high relative contribution of the main disk (exterior to the SB region) to the TeV emission. Clearly, even a small degree of steepening of the proton spectrum in this region results in a significantly lower TeV emissivity (see, e.g., Table 1 of Drury et al. 1994) and hence flux.
5 Discussion
Our main objective has been an improved estimate of the VHE emission from the nearby northern-sky starburst galaxy M 82. This has been obtained first by an approximate calculation of the hadronic emission alone, and then a more comprehensive and detailed treatment which follows the evolution of the steady state electron and proton spectra and their radiative yields, taking into account pertinent energy losses and propagation modes. (Note though that because VHE emission is largely produced in the central disk, details of our modeling of the diffusion coefficient and convection velocity are not that important in determining the particle spatial profile over this relatively small region.) Of course, only the full, more physically meaningful and realistic treatment provides a consistent basis for predicting the full particle and radiation spectra. The fact that we account for all known energy loss processes substantiates our expectation that the electron spectrum can be extrapolated to energies much higher than the range directly sampled by radio measurements. The approximate calculation is included here in order to give intuitive insight on the main contribution to the VHE emission, and in order to relate our work to previous similar treatments.
As we have already noted, the factor of 6 discrepancy between our two estimates of the total VHE flux is given the approximate nature of the analytic calculation. This is so mainly because the bulk of the VHE emission comes from a relatively small central region of M 82 of 1 kpc radius, essentially the SB, due to steep decline of the emission outside this source region, which is described in the analytical treatment by . Over this region evolution of the particle spectra is moderate. Moreover, most of the VHE emission is from decay, hence a detailed calculation of the electron spectrum is not required. Of course, the approximate calculation is totally inadequate in predicting the lower energy emission, especially so over the larger disk region.
Compared to previous estimates of -ray emission from M 82 (e.g., Akyüz et al. 1991; Pohl 1994; Völk et al. 1996), our detailed treatment is more realistic by virtue of being more tuned to a range of observables. These include the neutral and ionized gas densities and their estimated profiles across the central galactic disk, as well as the anticipated spatial variation of the magnetic field across this region. Most importantly, the basic normalization of the electron spectrum is directly determined from the radio spectrum measured in the central disk region. We assume particle-field energy equipartition and an initial, theoretically predicted ratio in the central region, where these are more likely to be valid, rather than across the full disk as in previous work. Finally, we include all the dominant radiative electron and proton processes. The calculation of Torres (2004), who estimated emission from the super-SB galaxy Arp 220, and those of Paglione et al. (1996) and Domingo-Santamarìa & Torres (2005), who estimated VHE emission from the southern-sky starburst galaxy NGC 253, although similar are still appreciably different from our numerical treatment. Given the substantial differences between our approach and those adopted in most previous treatments, it is not very meaningful to carry out a more detailed comparison of specific differences – e.g., in parameter values and spatial profiles, including those of the electron and proton densities, and mean magnetic field in the central disk region – and we avoid doing so here.
An assessment is needed of the reliability of our basic result – the predicted level of VHE emission. Clearly, this flux depends linearly on , which in turn is related to . The electron density was deduced from the measured radio emission in the central disk region. Therefore, the evolution of the electron spectrum from the latter region to the central disk region is mostly determined by synchrotron losses in the high magnetic field. From Eqs. (9) and (11) it follows that (which is obvious in the limit ). The uncertainty in the estimated level of TeV emission stems mostly from this steep dependence. It is unlikely that the field is appreciably higher than our estimate ( G), but it could possibly be lower. For example, a value lower by a factor of , would reduce and decays by a factor . However, for a given measured radio flux would have to be higher by the factor , which for a mean electron index of (over the central disk) would result in a boost of the bremsstrahlung and Compton yields by nearly the same factor (). As can be seen in Figure 3, at the GeV region, the yield from the latter processes is only a factor lower than emission from decay, implying, e.g., that if the field were reduced to 100 G, the total VHE emission would not change significantly. Thus, the net effect of a lower field strength on the VHE emission is small. Of course, the decay yield is linearly dependent also on the ambient proton density, which we inferred directly from the measured mass in the central disk. We conclude that our predicted VHE flux is unlikely to be appreciably over-estimated. 222By a numerical coincidence in spite of the different approach, our (numerical) VHE flux estimate is very similar to that by Völk et al. 1996, which was assumed to be emitted from the central starburst only, and to be purely hadronic with a hard (2.1) proton population throughout the emission region.
Based on the above estimate, the predicted VHE flux of M 82 falls somewhat below the detection limit of current imaging air Cherenkov telescopes (IACTs). For example, MAGIC and VERITAS – which are located in the Northern hemisphere and can therefore observe M 82 – have a 5 sensitivity of, respectively, 210-11 and 10-11 cm-2s-1 for the detection of emission above 100 GeV in 50 hours of observation (e.g., Bastieri et al. 2005). However, this sensitivity limit refers to a Crab-like spectrum, i.e. a power-law source whose differential VHE (photon) flux has an index of , somewhat steeper than our deduced value of 2.3. Accounting for this and for the inherent uncertainty (by a factor of 2–3) in our lower flux estimate, we conclude that measurement of VHE emission from M 82 – or obtaining an interesting upper limit on it – may be feasible with MAGIC or VERITAS, if observed for more than 500 hours. Prospects for detection are real with the upcoming MAGIC II telescope, whose sensitivity at 100 GeV is expected to be a factor of 3 better than that of MAGIC I.
Finally, we comment on the possibility of detecting M 82 at 100 MeV -rays with GLAST. Our numerical code yields an integrated flux 100 MeV)1.110-8 cm-2s-1. This value matches the 5 sensitivity of GLAST’s Large Area Telescope (LAT) for a 1-yr scanning-mode operation (e.g., Dermer 2007). Thus, GLAST/LAT could possibly detect M 82 during its first year of operation.
Its proximity and strong star-formation activity make M 82 the most promising non-AGN galaxy target for high-energy -ray detection with the current generation of detectors (GLAST/LAT, MAGIC, and VERITAS). The LMC is the only non-AGN galaxy detected at energies 100 MeV (Sreekumar et al. 1992); weak upper limits have been set on the VHE emission from normal and SB galaxies, including NGC 253 (Aharonian et al. 2005c) and Arp 220 (e.g., Albert et al. 2007). Detection of VHE -ray emission from nearby star-forming galaxies is clearly of much interest in view of the feasibility of testing cosmic-ray acceleration and propagation models.
Acknowledgements. We thank the referee for useful remarks on some aspects of particle acceleration by non-relativistic shocks.
References
Aharonian, F.A., et al. 2007, A&A, 464, 235
Akyüz, A., Brouillet, A., & Özel, M.E. 1991, A&A, 248, 419
Axford, W.I., Lear, E., & Skadron, G. 1977, in Proc. 15th ICRC (Plovdiv), 11, 132
Bastieri, D., et al. 2005, Astrop. Physics, 23, 572
Bell, A.R. 1978, MNRAS, 182, 443
Berezhko, E.G., & Völk, H.J. 2006, A&A, 451, 981
Blandford, R.D., & Ostriker, J.P. 1978, ApJ, 221, L29
Büsching, I., Pohl, M., & Schlickeiser, R. 2001, A&A, 377, 1056
Casasola, V., Bettoni, D., & Galletta, G. 2004, A&A, 422, 941
Cappi, M., Persic, M., Bassani, L., et al. 1999, A&A, 350, 777
Carlstrom, J.E., & Kronberg, P.P. 1991, ApJ, 366, 422
Dermer, C.D. 2007, ApJ, 659, 958
Domingo-Santamaría, E. 2006, PhD thesis (Universidad Autónoma de Barcelona)
Domingo-Santamaría, E., & Torres, D.F. 2005, A&A, 444, 403
Drury, L.O’C., Aharonian, F.A., & Völk, H.J. 1994, A&A, 287, 959
Goldshmidt, O., & Rephaeli, Y. 2005, ApJ, 444, 113
Eidelman, S., et al. 2004, Phys Lett B, 592, 1 (see http://pdg.lbl.gov)
Freedman, W.L., Hughes, S.M., Madore, B.F., et al. 1994, ApJ, 427, 628
Griffiths, R.E., Ptak, A., Feigelson, E.D., et al. 2000, Science, 290, 1325
Klein, U., Wielebinski, R., & Morsi, H.W. 1988, A&A, 190, 41
Krymsky, G.F. 1977, Dokl. Akad. Nauk SSSR, 243, 1306
Lerche, I., & Schlickeiser, R. 1982, MNRAS, 201, 1041
Mayya, Y.D., Bressan, A., Carrasco, L., & Hernandez-Martinez, L. 2006, ApJ, 649, 172
Paglione, T.A.D., Marscher, A.P., Jackson, J.M., & Bertsch, D.L. 1996, ApJ, 460, 295
Moskalenko I.V, & Strong A.W. 1998, ApJ, 493, 694
Moskalenko I.V, Jones, F.C., Mashnik, S.G., Ptuskin, V.S., & Strong A.W., 2003, ICRC, 4, 1925
Persic, M., & De Angelis, A. 2008, A&A, 483, 1
Persic, M., & Rephaeli, Y. 2007, A&A, 463, 481
Pohl, M. 1994, A&A, 287, 453
Protheroe, R.J., & Clay, R.W. 2004, PASA, 21, 1
Rephaeli, Y. 1979, ApJ, 227, 364
Rephaeli, Y. 1988, Comm. Ap., 12, 265
Rephaeli, Y., & Gruber, D. 2002, A&A, 389, 752
Rybicki, G.B., & Lightman, A.P. 1979, Radiative Processes in Astrophysics, p.202–208
Rieke, G.H., et al. 1980, ApJ, 238, 24
Schlickeiser, R. 2002, Cosmic Ray Astrophysics (Berlin: Springer), p.472
Seaquist, E.R., & Odegard, N. 1991, ApJ, 369, 320
Silva, L., et al. 1998, ApJ, 509, 103
Sreekumar, P., Bertsch, D.L., Dingus, B.L., et al. 1992, ApJ, 400, L67
Strickland, D.K., Ponman, T.J., & Stevens, I.R. 1997, A&A, 320, 378
Thompson, T.A., Quataert, E., & Waxman, E. 2007, ApJ, 654, 219
Torres, D.F. 2004, ApJ, 617, 966
Tucker, W. 1975, Radiation Processes in Astrophysics (Cambridge, MA: MIT Press)
Yun, M.S., & Carilli, C.L. 2002, ApJ, 568, 88
Völk, H.J., Aharonian, F.A., & Breitschwerdt, D. 1996, SSRv, 75, 279
Völk, H.J., Klein, U., & Wielebinski, R. 1989, A&A, 213, L12
Weiss, A., Neininger, N., Hüttemeister, S., & Klein, U. 2001, A&A, 365, 571
Zirakashvili, V.N., Breitschwerdt, D., Ptuskin, V.S., & Voelk, H.J. 1996, A&A, 311, 113