UNIVERSITY OF SOUTHAMPTON
FACULTY OF SCIENCE
School of Physics & Astronomy
Optical and infrared emission from discs, jets and nebulae associated with X-ray binaries
by
David Russell
Thesis for the degree of Doctor of Philosophy
September 2007
UNIVERSITY OF SOUTHAMPTON
ABSTRACT
FACULTY OF SCIENCE
SCHOOL OF PHYSICS & ASTRONOMY
Doctor of Philosophy
OPTICAL AND INFRARED EMISSION FROM DISCS, JETS AND NEBULAE ASSOCIATED WITH X-RAY BINARIES
by David Michael Russell
X-ray binaries are binary star systems in which a compact object (a neutron star or a black hole) and a relatively normal star orbit a common centre of mass. Since the discovery of X-ray binaries with the first X-ray telescopes in the 1960s, astronomers have tried to understand how these bizarre objects behave, and why. Some change in X-ray luminosity by orders of magnitude on timescales of days to months due to an increased transfer of mass from the star towards the compact object. Many X-ray binaries are detected at all observable frequencies, from radio to -rays. It has been found that many different sources of emission, which peak at different frequencies, are present in X-ray binary spectra and together they produce the observed broadband spectrum. However, disentangling these components has proved challenging.
Much of the work in this thesis concerns disentangling the components that occupy the optical and near-infrared (NIR) region of the spectrum of X-ray binaries; possibly the region in which the relative contributions of the different components are least certain. In particular one component, the synchrotron emission from jets of outflowing matter, is found in this work to contribute ubiquitously to the optical and NIR light of X-ray binaries with relatively faint stars. These results confirm that the jets are powerful and in some of this work, observations of the jets interacting with the surrounding matter are used to infer their power.
An introduction to the subject matter is presented in Chapter 1.
Attention is given to the current thinking of the dominating optical and NIR emission processes, and to X-ray binaries that produce jets. In Chapters 2–6 I present a number of investigations into optical and infrared observations of X-ray binaries. Relations, patterns and general trends are discovered that have implications for not only the dominating emission processes but also for the physical conditions and general behaviour of the inflowing and outflowing matter. In Chapter 7 I summarise the results and discuss follow-up work that could further our understanding of these objects.
To Mum
Your smiles will always be remembered
In the whole history of this planet, in the 3–4 billion years it has
harboured life, it is only in the last few hundred years that a species
has begun to explore and to understand the universe in which it exists.
(author’s declaration here)
Acknowledgements
Jagshemash! Thank you for read my thesis paper. I hope you like. I like a very much, is a good. Please to have visual pleasure. It would be big success! If it not success, I will be execute. High five! Dziekuje. Borat. “I’d like to thank my family, my friends, my agent, my lawyer, my business manager, my publicist and passers-by who always wanted the best for me. Also all the nominees this evening and all the people again, that they’ve already thanked. My hormones are just too way out of control to be dealing with this.” (a collection of quotes from awards ceremonies by Sarah Jessica Parker, John Landau and Catherine Zeta-Jones).
Let me begin traditionally – by thanking all my office mates, past and present. Mo, Matthew, Mark, Martin and Matthew North, thanks to you I almost changed my name to Mdave to fit in. Mo if you weren’t there being a fountain of knowledge I would’ve had to go up and ask Bobbie F all my trivial questions – very much appreciated. I thank the Lamb for many hours of squash – one day the Gecko will learn to climb the walls to return those awkward shots. Mark, well done for organising the postgrad gowns to be of West Ham colours – I look forward to the ceremony. Carolyn – thanks for your help in my first year when I knew nothing. Yang – hopefully this will be the last time you move desks! To the Squid and the Jellyfish – keep up the snooker, its been good. To Nessa G – the office just hasn’t been the same. The Poodle – we were there first! Before youtube! Long live Google Videos.
Therefore I’d like to thank the Koala and the Wheezel (whose average yearly publication record exceeds that of the Silverback) who from the beginning have always been up for a drink. I thank the Slug for providing encouragement when it comes to both working and drinking (hence enforcing both pressure and morale). I thank the Possum for encouragement and help with work and job applications and for generally making sure people in the department talk to each other. To Ked – thanks for the great conversations and the chocolate fountain. Mmm crisps dipped in chocolate.
I’d like to thank Lord Rayleigh (Noble Prize, 1904 for discovering argon) for supervising Sir J. J. Thompson, and J. J. Thompson (Noble Prize, 1906 for discovering the electron) for supervising Sir Edward Appleton, and Sir Edward Appleton (Noble Prize, 1947 for his work on the ionosphere which led to the development of radar) for supervising John Ratcliffe, and John Ratcliffe for supervising Sir Martin Ryle, and Sir Martin Ryle (Noble Prize, 1974 for his work on radio aperture synthesis which led to the discovery of pulsars) for supervising Prof. Antony Hewish, and Prof. Antony Hewish (Noble Prize, 1974 with Martin Ryle) for supervising Dame Jocelyn Bell Burnell, and Dame Jocelyn Bell Burnell for supervising Prof. Rob Fender, and Prof. Rob Fender for supervising me. …no pressure then!
I’d like to thank the Gibbon for dissuading me from taking up radio astronomy (at least using AIPS) on the day of my interview for PhD, and the Mosquito for definitely definitely not crashing his van of students on both the 2006 and 2007 Tenerife trips. To the Tapeworm – you know the Poodle used to take the mick out of your straight line plots? He should see Mo’s – he’s so happy when his data show a straight line! Please can I also thank all of the staff in the Astro and ST(E)P groups (can you find your reference?) who I couldn’t think anything humorous about and all my friends and co-workers on the lovely La Palma, because I forgot to make an acknowledgements section to my Masters thesis. I thank David G. Russell from Owego Free Academy for not publishing too much on ADS over the last few years, and Fraser Lewis for drowning me in Faulkes monitoring project data and for putting up with my e-mails. I thank Mischa Schirmer for extensive help with the usage of the excellent data reduction pipeline package THELI. Thanks to Paul Callanan, Sera Markoff, Tariq Shahbaz, Stephane Corbel, John Miller, Rob Fender, Peter Jonker, Charles Bailyn and Mike Nowak for all showing some kind of vague interest in letting me work for them at some point (and to two of them for offering me a position). I also thank my examiners Stephane Corbel and Christian Knigge for joining me in the unique club of people who have actually read of my thesis (anyone else would be insane to do so).
Thank you Concert Band – you doubled my number of friends at uni. To the Pfaffia – I will never forget the ree-filled times. You’re a bunch of insanely reeful people. Elaine you were a rock; I hope you find your planets – have you looked behind the sofa? I thank Elena Gallo, Erik Kuulkers, Charles Bailyn and the RXTE teams for providing some data that were used in the thesis. I thank the anonymous MNRAS referees for remaining anonymous. This thesis uses observations made with the Isaac Newton Telescope, the Faulkes Telescope Project, the United Kingdom Infrared Telescope, the Very Large Telescope, the 2.2-m ESO/MPI Telescope, the Danish 1.54-m Telescope, the YALO Telescope and the Liverpool Telescope.
Finally, I’d like to thank God for being as cunning as a fox ‘what used to be professor of cunning at Oxford University, but has moved on, and is now working for the UN at the high commission of international cunning planning’ (Baldrick, Middle Ages) and not revealing herself. I mean, if she just came along and said ‘Hey guys, look this is how I made the universe and this is how it works..’ then I’d probably be out of a job. Oh and many thanks to my Dad, who is actually responsible for getting me into all of this in the first place.
List of Definitions & Abbreviations
ADAF …….. advection-dominated accretion flow
AGN …….. active galactic nucleus/nuclei
AU …….. astronomical unit
BH …….. black hole candidate
BHXB …….. low-mass black hole X-ray binary
CCD …….. charge-coupled device
CO …….. compact object
CS …….. companion star
CV …….. cataclysmic variable
DDT …….. Director’s Discretionary Time (observing proposal)
GRB …….. gamma-ray burst
HID …….. hardness–intensity diagram
HMXB …….. high-mass X-ray binary
IPHAS …….. INT Photometric H Survey of the Northern Galactic Plane
IR …….. infrared
ISM …….. interstellar medium
JCMT …….. James Clerk Maxwell Telescope
LMXB …….. low-mass X-ray binary
LP …….. linear polarisation
MJD …….. Modified Julian Day
MNRAS …….. Monthly Notices of the Royal Astronomical Society
MSXP …….. millisecond X-ray pulsar
MTI …….. mass transfer instability
NIR …….. near-infrared
NS …….. neutron star
NSXB …….. low-mass neutron star X-ray binary
OIR …….. optical/NIR
PA …….. (polarisation) position angle
PSF …….. point spread function
QPO …….. quasi-periodic oscillation
S/N …….. signal-to-noise ratio
SED …….. spectral energy distribution
SMBH …….. supermassive black hole
SNR …….. supernova remnant
UKIRT …….. United Kingdom Infrared Telescope
ULX …….. ultra-luminous X-ray source
UV …….. ultraviolet
VLA …….. Very Large Array
VLT …….. Very Large Telescope
WFC …….. Wide Field Camera
XB …….. X-ray binary
XIN …….. X-ray ionised nebula
YSO …….. young stellar object
1 Introduction
Since the subject of this thesis is X-ray binaries (XBs), it is first necessary to introduce these objects. In the following sections I discuss what is known about XBs and why they are interesting. In particular I review the current understanding of the physical properties, emission properties and changing behaviour of low-mass X-ray binaries (LMXBs), which are the objects most of my work concerns. Following this I review the processes that can produce optical and near-infrared (NIR) emission that we can detect, and how this region of the spectrum in particular contains a large amount of information about LMXBs. In the subsequent Chapters I present my work, most of which is now published.
1.1 X-ray binaries
‘So, the whooshy thing sometimes comes out from the spinny thing?’
(My friend Katie sums up my work, 2004)
An X-ray binary is a binary star system in which one of the two stars is a compact object – a black hole candidate (BH) or a neutron star (NS). The companion star is in most cases a normal main-sequence star but could also be e.g. a non-main-sequence supergiant or a white dwarf.111Much of the information in the Introduction comes from the chapters in two textbooks: ‘X-ray Binaries’ (Lewin, van Paradijs & van den Heuvel, 1995) and ‘Compact Stellar X-Ray Sources’ (Lewin & van der Klis, 2006) and the references therein. Other sources will be referenced individually. When matter is transfered to the compact object the process usually produces high energy photons – X-rays. This is because the compact object is small, and the luminosity radiated per unit area is proportional to the fourth power of the temperature: , where is the luminosity, is the radius and is the temperature. A particle at a small radius will therefore be relatively hot, and will radiate at higher frequencies (and energies) than a particle at a larger radius. In general, the more matter that is captured in a given time, the brighter the X-rays, so inevitably these sources are discovered from X-ray outbursts. The highest luminosity XBs are some of the brightest X-ray sources in the sky. Several hundred XBs have been discovered in the Milky Way and some more in the Magellanic Clouds and nearby galaxies, in particular M31 (Liu, van Paradijs & van den Heuvel 2001; 2006; 2007; Williams et al. 2004). It is estimated that there is a population of – black holes in the galaxy which lie hidden because they are not accreting much matter (either because they are in wide binaries where the star is not close enough for mass transfer or because they are isolated; van den Heuvel, 1992).
The luminosity of an XB can also change by many orders of magnitude in wavelength regimes from radio to -rays, over periods of time from minutes to decades (and probably centuries). The many different components of an XB, which can react to each other’s physical and emission changes, result in a rich and complex phenomenology which is often challenging to interpret. However, the rewards of understanding these sources are also rich, as they are laboratories that have the potential to test theories of accretion222Accretion is the process that results when the compact object gravitationally attracts matter, and is explained in Section 1.1.2., jet formation, the existence of black holes and the general theory of relativity.
1.1.1 The different flavours of X-ray binary
Over the decades of X-ray binary observations many attempts have been made to separate the objects into different classes and sub-classes. Perhaps surprisingly, it is historically the mass of the companion star which defines the main two classes of XB, rather than the nature or mass of the compact object. There are many observational differences that were discovered early on between LMXBs, which contain a companion of mass 2 M⊙, and high-mass X-ray binaries (HMXBs), which have a more massive ( 2 M⊙) companion. More recently, it has come to light that there are many areas of overlap in the properties and behaviour of LMXBs, HMXBs and their sub-categories.
The general properties and apparent behaviour of XBs are probably a natural consequence of the following parameters (which are usually constant to first order):
-
•
the mass of the companion star
-
•
the spectral class of the companion star
-
•
the nature of the compact object (BH or NS)
-
•
the mass of the compact object
-
•
the orbital period of the system
-
•
the orbital separation (semi-major axis), which is defined by the masses and orbital period
-
•
the size of the accretion disc, which is related to the orbital separation
-
•
the orientation (orbital inclination to the line of sight)
-
•
the eccentricity of the orbit
-
•
the time-averaged mass accretion rate (inflow)
-
•
the time-averaged power of the jets (outflow)
-
•
the composition of the jets
-
•
the spin of the BH or NS
-
•
if NS – the magnetic field of the NS
-
•
external influences, e.g. local interstellar medium (ISM) density and local photon field
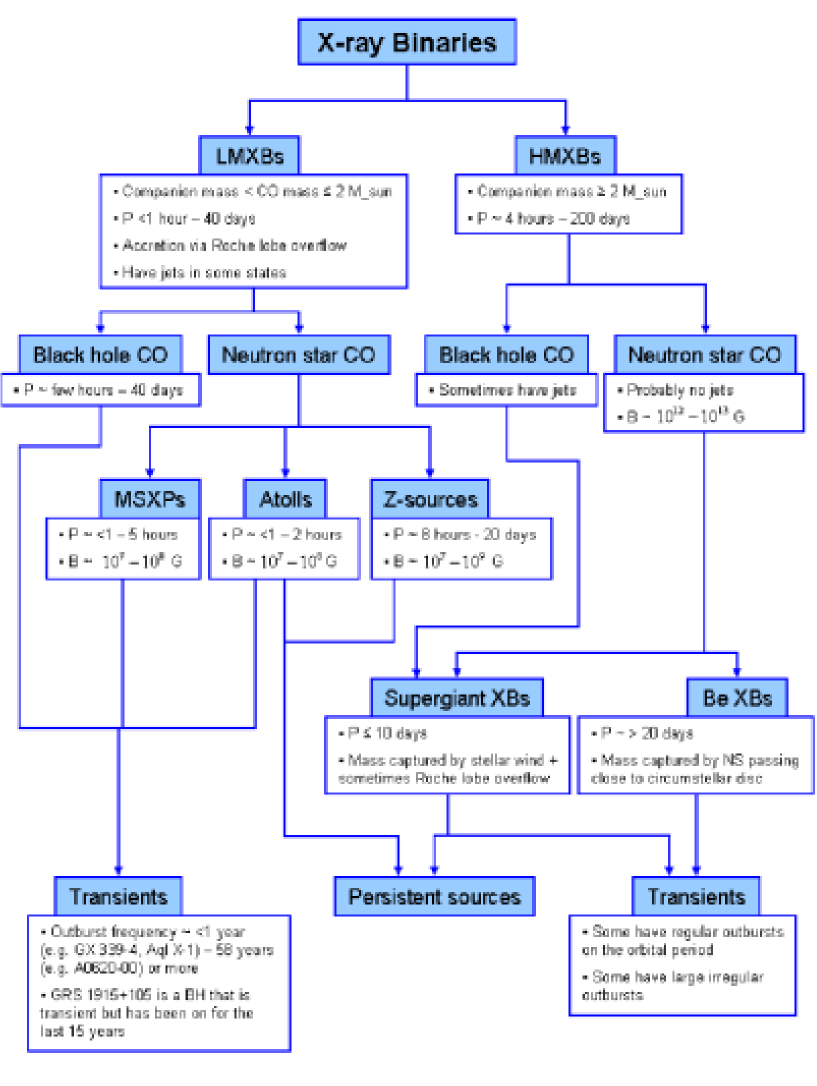
Some combinations of the above parameters result in a system which dramatically changes luminosity and mass accretion rate in short periods of time. The systems which are persistently or transiently accreting matter are the ones which are detected and studied. In Fig. 1 I present a diagram showing the different classes of observed XB as they have been defined historically, some of their basic properties and how they are related. In LMXBs the mass of the companion is generally less than that of the compact object. The region in which matter is gravitationally bound to a star in a binary system is called the Roche lobe; if matter from the companion crosses the Roche lobe in the direction of the compact object (see Section 1.1.2) it is gravitationally bound to the compact object. The orbital periods of LMXBs (empirically on scales of tens of minutes to tens of days) are usually less than those of HMXBs (a few hours to almost a year). Similarly the neutron star magnetic fields are larger for HMXBs (– Gauss) than for LMXBs (– G).
In LMXBs the nature of the compact object appears to define many aspects of the broadband emission behaviour. Low-mass black hole X-ray binaries (BHXBs) have different X-ray ‘states’ (a description of the X-ray spectrum and timing properties; see Section 1.1.3) to low-mass neutron star X-ray binaries (NSXBs). Almost all BHXBs are transient – usually having low accretion rates in a relatively stable ‘quiescent’ state until at some point the mass build-up in the disc causes the system to become unstable and a dramatic increase of mass accretion in the inner regions causes a luminosity increase by up to eight or so orders of magnitude (the nearest exceptions are GRS 1915+105, which has been active for the last 15 years but was quiescent before then and LMC X–3 which some class as a HMXB; see discussion in Section 2.3). Some NSXBs are also transient but some are persistent. Transient LMXBs are traditionally referred to as ‘X-ray novae’ or ‘soft X-ray transients’; here I will just call them transients as many do not go through a soft X-ray phase (see Brocksopp et al., 2004). Outbursts typically last several months although some can be as short as minutes (e.g. V4641 Sgr; Wijnands & van der Klis, 2000) or as long as decades (as in the aforementioned GRS 1915+105). The frequency of outbursts depends on the particular source but can range from a year (e.g. Aql X–1) to one every years (e.g. A0620–00; Eachus et al., 1976) or more.
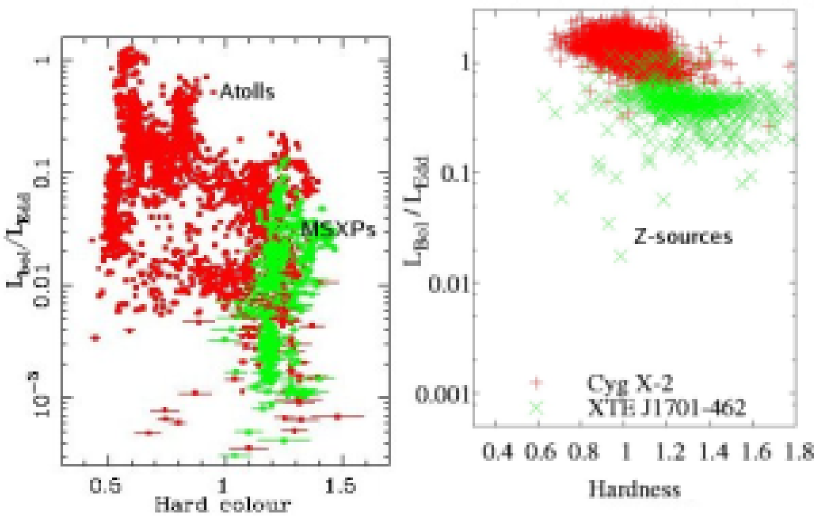
There are three main classes of NSXB (discussed in Section 1.1.3): Z-sources, atolls and millisecond X-ray pulsars (MSXPs). The Z-sources have been active over the period of time X-ray telescopes and detectors have existed ( years) except one new source, XTE J1701–462 which ‘switched on’ in 2006 (Remillard et al., 2006) and at the time of writing is declining in luminosity via on atoll-like phase, possibly back to quiescence (Homan et al., 2007b). Of the atolls, some are persistent (e.g. 4U 0614+09) and some are transient (e.g. XTE J2123–058). All MSXPs discovered so far are transient. The Z-sources generally have larger orbital periods than atolls and MSXPs (Liu et al., 2007). It has recently been found that a source can behave at one time like a Z-source and at another time like an atoll (Homan et al., 2007b), or at one time like an atoll and at another like a MSXP (Casella et al., 2007), which implies they are in fact the same objects, but they vary in behaviour with accretion rate.
Unlike LMXBs, the main method of mass capture in HMXBs is usually not Roche lobe overflow. HMXBs with supergiant stars transfer matter from the star to the compact object via a strong stellar wind. These are one of the two main categories of HMXB, the other being Be XBs, in which a neutron star orbits a young Be (or Oe) star. Be stars have H emission lines originating from a circumstellar disc around the star (e.g. Zorec & Briot, 1991; Grebel et al., 1997). Neutron stars in this latter class often have eccentric orbits and capture matter when they pass close to the circumstellar disc. These systems have the largest orbital periods and magnetic fields of all the XBs; –200 days and – G, respectively. The supergiant XBs have smaller periods than the Be XBs ( days), can contain a BH or NS compact object, and are sometimes transient and sometimes persistent.
In the following Sections I concentrate and elaborate on the LMXBs, which are the topic of most of my work.
1.1.2 The physical properties of LMXBs and the process of accretion
Essentially, the method we use to increase our understanding of LMXBs (and in fact most astronomical objects!) is to compare the behaviour of the emission (i.e. photons) we detect from the source to the emission we expect such a system to emit under the laws of physics. There is one and only one physical solution that can generally explain the emission behaviour of LMXBs – the existence of a compact object – either a black hole or a neutron star – accreting matter from a companion star (first suggested by Shklovsky, 1967).
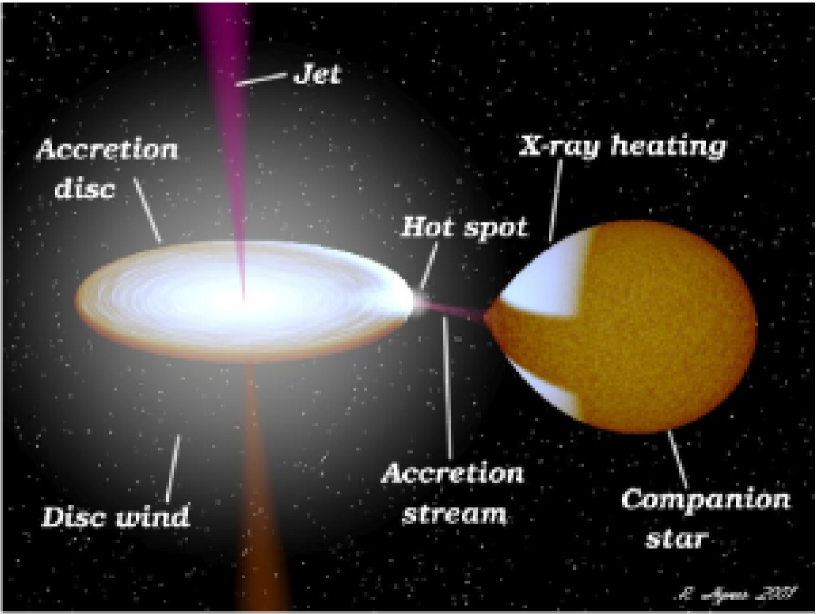
Over decades of observing LMXBs, a general picture has emerged of their constituents. An illustration of an LMXB is shown in Fig. 2. A star and compact object orbit their common centre of mass. The two objects are close enough (semimajor axis –1 astronomical units; AU) for Roche lobe overflow to occur. If matter from the star passes through the inner Lagrange point L1, it will be gravitationally bound to the compact object. In LMXBs, the surface of the star is close to L1, which causes the star to stretch in that direction becoming non-spherical. The amount of light seen from the star varies with the amount of visible surface area; if the star passes in front of the compact object (inferior conjunction) it will appear more circular than when both objects lie on a plane of the sky (as in Fig. 2). In the latter case the star will appear elongated and slightly larger. Systems with a high inclination (i.e. when the orbital plane is not parallel to the plane of the sky) display an ‘ellipsoidal’-type optical light curve due to this, first seen in transient LMXBs when they return to quiescence (when the star dominates the optical regime; e.g. McClintock et al., 1983) and well-documented now in many systems.
When matter becomes gravitationally bound to the compact object, it has a net angular momentum and so forms a disc around the compact object. Matter moves inwards in a sequence of almost circular orbits in this ‘accretion disc’, losing energy as angular momentum is transported outwards. The disc, probably in most cases is optically thick, and so radiates as a blackbody, the matter releasing energy and increasing in temperature as it moves towards the compact object. The spectrum of the disc is in the form of a multi-temperature blackbody due to its radial temperature gradient. is the process responsible for energy loss and angular momentum transportation – how this process works is still under debate. Atomic and molecular viscosity can only account for a very small amount of the angular momentum transport; magnetic fields probably play a very significant role and a number of models have been put forward, in particular the magnetorotational instability (MRI) model (e.g. Balbus & Hawley, 1991).
Finally the matter reaches the inner disc radius and continues towards the compact object in a hot accretion flow of debatable structure (e.g. Narayan, Kato & Honma, 1997; Blandford & Begelman, 1999; Ferreira et al., 2006; Petrucci et al., 2006) which under some conditions forms a collimated jet which escapes the system. These jets predominantly reveal themselves as radio counterparts emitting synchrotron radiation. In addition, a ‘corona’ of hot electrons and positrons surrounds the compact object and the disc is likely to give off a disc wind.
For an LMXB to form, a massive star must have been present in the binary to eventually form the compact object after a supernova explosion. The longer-lived companion star must end up in a close orbit, probably due to losing angular momentum while spiralling inwards in the common envelope of the massive star before the explosion. The compact object is formed during the supernova.
The above process is accretion as envisaged for LMXBs – many other types of astronomical object undergo accretion:
-
•
Active galactic nuclei (AGN) – supermassive black holes (SMBHs) that accrete from the surrounding matter at the centre of a galaxy (see Section 1.1.5)
-
•
Cataclysmic variables (CVs) – similar systems to XBs but with a white dwarf compact object – these are more numerous than XBs but they cannot probe the dense matter and the extreme-gravity environments of XBs
-
•
Young stellar objects (YSOs) – pre-main-sequence stars collecting mass from a protoplanetary disc
-
•
Ultra-luminous X-ray sources (ULXs) – which may either harbour intermediate-mass black holes or are XBs that emit non-isotropically
Accretion onto a black hole is the most efficient means known in the universe of converting mass into energy; the fastest spinning Kerr BHs can radiate up to % of the rest-mass energy of the matter. On the other hand, accretion onto non-rotating BHs radiates about 6% of the rest-mass energy (Thorne, 1974; Li & Paczyński, 2000); for comparison, nuclear fusion converts % of the rest mass into energy. The gravitational potential energy released through accretion is proportional to where is the mass of the accreting object. , the radius, increases linearly with black hole mass (if the spin is a constant) so the radiative efficiency of a SMBH is the same of that of a stellar-mass BH: .
1.1.3 X-ray states and the classes of NSXB
In BHXBs, properties of the emission in all wavebands are often related to changes in the X-ray spectrum. The two main X-ray spectral states are the hard (or low/hard) state, which is characterised by a hard power-law spectrum and strong variability, and the soft (or high/soft; thermal–dominant) state, where a thermal spectrum dominates with a power-law contribution. The low luminosity ‘quiescent’ state is likely to be an extension to the hard state (Narayan, 1996; Esin, McClintock & Narayan, 1997; McClintock et al., 2003; Fender, Gallo & Jonker, 2003, 2004; Gallo et al., 2006) but currently this is not universally accepted. In general I treat quiescence as an extension to the hard state in this work but also show how some results differ when this is not assumed.
The most striking observation of X-ray state-dependency at other wavelengths comes from the radio regime. The radio counterpart of Cyg X–1 appeared when a transition was made to a harder X-ray spectrum (Tananbaum et al., 1972), and it has since been shown that this strong correlation between X-ray spectral shape and strength of radio emission is ubiquitous (e.g. Fender et al., 1999a). The shape of the X-ray spectrum of a BHXB is also strongly correlated with its timing properties, with strong variability generally correlated with bright radio and hard X-ray emission. The X-ray power spectrum (the power as a function of frequency in a time series; the square of the Fourier transform) varies with X-ray state and consists of broad structures (‘’) and narrow structures (quasi-periodic oscillations; QPOs).
It was observed from early on that the different spectral states occur at different fractions of the Eddington luminosity; erg s-1 (see e.g. Nowak 1995 for a review), the maximum isotropic luminosity a source can emit without the outward radiation pressure becoming greater than the inward gravitational force. The hard state, which exhibits strong radio emission, usually occurs at lower luminosities than the soft state, which has low amplitude variability and no radio emission. Observations which fit neither of these states show similar phenomenology over a rather wide range of luminosities; they have typically been called intermediate states when at lower luminosities and very high states when at high luminosities, but their spectral and variability properties are sometimes comparable and sometimes varied. For a detailed review of BHXB X-ray states see Homan & Belloni (2005) and for the most recent effort at putting together a unified picture of spectral states incorporating jets, see Fender, Belloni & Gallo (2004) (see also Homan et al., 2001; McClintock & Remillard, 2006).
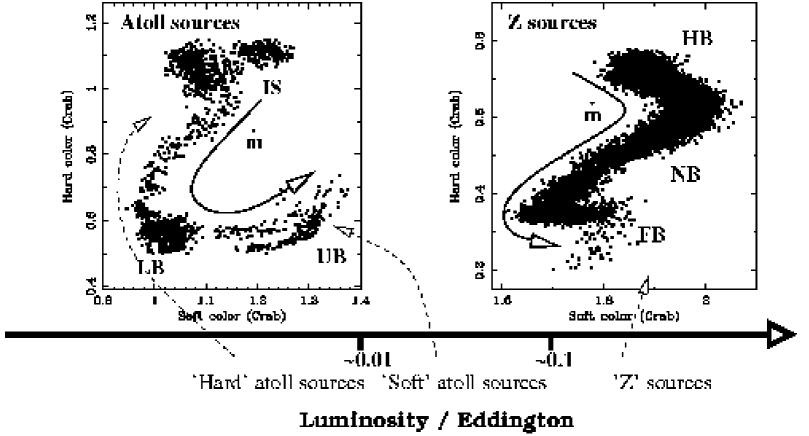
NSXBs exhibit many of the same X-ray spectral and timing properties as BHXBs. However, luminosity correlates with X-ray state only in some cases, and other (e.g. timing) properties appear to be related to their flux ratios derived from four X-ray bands (in the –16 keV range) – their position in the X-ray colour-colour diagram (Hasinger & van der Klis, 1989). Indeed, the tracks that NSXBs trace out in the colour–colour diagram or hardness–intensity diagram (HID) are usually ‘atoll’-type tracks or ‘Z’-type tracks, and most NSXBs can be classed as an atoll source or a Z-source (see Fig. 3). In atolls, the X-ray states consist of the island state (harder spectrum) and the banana state (softer) and in Z-sources the states are the horizontal branch (hardest), the normal branch and the flaring branch (softest). Weaker NSXBs (mainly MSXPs) generally have a hard spectrum throughout their outbursts and reach similar peak luminosities to transient BHXBs that do not make a transition to a softer state (see Section 1.1.4). NSXBs exhibit many of the same timing properties as BHXBs but there are differences (van der Klis, 2006); in fact structures like QPOs seem to be common to accreting objects in general (Papadakis & Lawrence, 1993; Pretorius, Warner & Woudt, 2006; Zhang, Yin & Zhao, 2007).
1.1.4 Patterns in outburst behaviour
A picture has begun to develop in which the BHXB X-ray state transitions are hysteretic, with the transition from hard state to soft state occurring at higher luminosities than the transition from soft state to hard state (see e.g. Miyamoto et al., 1995; Nowak, Wilms & Dove, 2002; Barret & Olive, 2002; Smith, Heindl & Swank, 2002; Maccarone & Coppi, 2003). At sufficiently low luminosities, it appears that only hard states can exist, but the brightest hard states are just as bright as the brightest soft states (Homan & Belloni, 2005). Transient NSXBs can also exhibit this hysteretical behaviour (namely the atolls) (Maitra & Bailyn, 2004).
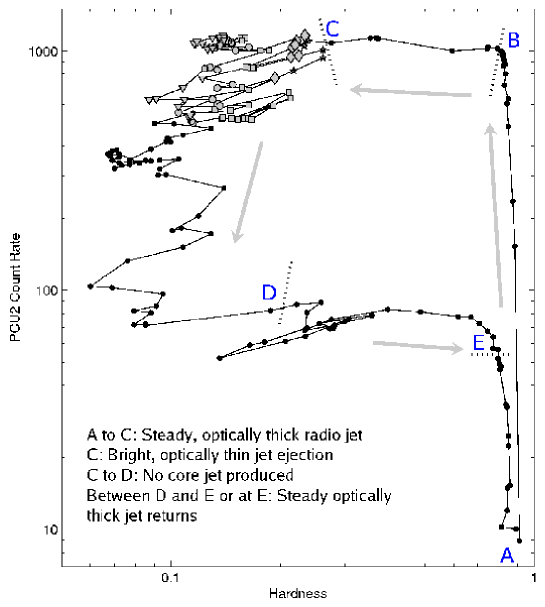
A well-established relationship exists between X-ray luminosity and radio luminosity in BHXBs in the hard state (Corbel et al., 2000); (Corbel et al. 2003; Gallo, Fender & Pooley 2003), where self-absorbed, compact steady jets are the origin of the radio emission, which is optically thick. It has been suggested that the correlation requires the hard state to be a radiatively inefficient flow, with (approximately as predicted by advection-dominated accretion flow (ADAF) models; e.g. Narayan & Yi, 1995; Mahadevan, 1997), and with the radio emission providing a good tracer of , the mass accretion rate (Körding, Fender & Migliari, 2006). Both the rising hard state and the falling hard state connect to a radiatively efficient flow in the soft state, where (Shakura & Sunyaev, 1973), albeit at different luminosities. A picture has emerged (Fender, Belloni & Gallo, 2004) of a universal X-ray–radio pattern in transient BHXB outbursts (Fig. 4) in which a typical outburst follows a specific path in an X-ray HID and the radio behaviour is dependent on the position in the diagram. ‘Hardness’ here refers to the X-ray colour, as in the colour–colour plots for NSXBs (see Section 1.1.3). During an outburst, the source remains in the hard state as the X-ray and radio (optically thick compact steady jet) luminosity rises (from positions A to B in Fig. 4). The X-ray spectrum softens at B and the steady radio jet persists until C where a bright radio flare is seen. Here (termed the ‘jet line’), the radio spectrum becomes optically thin, and the bright flare corresponds to the launching of a (or a number of) discrete plasma ejection(s). These ejections may have higher bulk Lorentz factors than the steady, hard state jets (Fender et al., 2004) and so the former may plough into the latter, producing optically thin emission from the collision.
From C to D the radio jet (core) is quenched and the X-ray spectrum is soft, however radio emission may be visible from the aforementioned discrete jet ejections. The source transits back into the hard state at E and the steady self-absorbed jet returns either before (Fender et al., in preparation) or at (Kalemci et al., 2005) E. There is no bright optically thin radio flare on the soft-to-hard state transition. It has been thought that in the soft state, the inner radius of the accretion disc is closer to the compact object than in the hard state (e.g. McClintock, Horne & Remillard, 1995). More recently it has been suggested that the inner accretion disc may not change dramatically during state transitions (e.g. Frontera et al., 2001a; Miller et al., 2006; Rykoff et al., 2007) although in most cases is likely to be truncated at low luminosities (McClintock et al., 1995; Esin et al., 2001; Frontera et al., 2001b, 2003; Chaty et al., 2003; McClintock et al., 2003; Yuan et al., 2005, 2007).
The different flavours of NSXB can be imagined to occupy various regions of the HID that transient BHXBs trace out (Fig. 5). The Z-sources, which nearly always appear persistent, occupy the most luminous region of the HID (right panel of Fig. 5). Since they produce transient, discrete jet ejections (e.g. Migliari & Fender, 2006) they occupy the ‘jet line’ region (around C in Fig. 4) and are similar to GRS 1915+105, a (currently) persistent BHXB which continuously cycles back and forth through the jet line (Fender et al., 2004). The recent transient Z-source XTE J1701–462 interestingly behaved more like an atoll on its outburst decline (Homan et al., 2007b). The MSXPs appear to be analogous to the faint BHXBs that remain in the hard state during outburst (e.g. XTE J1118+480) whereas the atolls are softer at their highest luminosities than at their lowest (Fig. 5; left panel). Both MSXPs and atolls have been associated with a steady radio counterpart (analogous to the BHXB hard state jet) but little is known of NSXB jets in general since they are intrinsically fainter than BHXB jets and are less-well sampled (e.g. Migliari & Fender, 2006). The spectral index of the hard state jet of NSXBs has not been measured so it is uncertain whether it is optically thick or thin emission. See Maitra & Bailyn (2004) for an example of outburst X-ray hysteresis in one NSXB, Aql X–1.
1.1.5 Black holes of all shapes and sizes
The three characteristics of a BH are its mass, angular momentum (spin) and electric charge. Black holes that occur naturally have approximately zero charge as the matter they accumulate is not electrically charged, nor are they likely to be born intrinsically charged. A BH with zero spin is described by the Schwarzschild metric whereas a spinning BH is described by the Kerr metric and has an ergosphere (the region in which all matter and even light is forced to rotate with the BH) whose surface is an oblate spheroid. The radius of the event horizon (and the ergosphere) is larger for more massive BHs. The spin can therefore be imagined as its ‘shape’ (the shape of the ergosphere) and the mass, its ‘size’.
The size of a BH, and hence its dynamical timescales, scales linearly with its mass. AGN contain a SMBH of mass – which is accreting at the centre of a galaxy and unlike their smaller BHXB cousins which orbit with a companion star, the most massive SMBHs can swallow whole stars (e.g. Rees, 1984; Osterbrock, 1989; Gezari et al., 2006; Bellamy, Howard & Wolstenholme, 2006). They are, it appears, scaled up versions of stellar-mass BHs; they produce jets several orders of magnitude more powerful than those of XBs. Quasars are very powerful AGN at high redshifts; X-ray binaries with jets are sometimes termed microquasars (Mirabel et al., 1992). Observational relations that exist in XBs can be extended to include AGN (e.g. Merloni, Heinz & di Matteo 2003; Falcke, Körding & Markoff 2004; Done & Gierliúski 2005; McHardy et al. 2006a,b) and it has recently been shown (e.g. Maccarone, Gallo & Fender, 2003; Körding, Jester & Fender, 2006; Summons et al., 2007) that it may be possible to unify the different classes of AGN in terms of the states of XBs and their orientation. However, there are some differences between the environments of stellar-mass and SMBHs. For example, AGN have broad-absorption line regions – powerful emission line-driven outflows (e.g. North et al., 2006) and BHXBs of course have a companion star whose presence affects many of its properties.
1.1.6 One of the most dynamically changing systems in the universe?
XBs vary in luminosity in all wavebands from radio to -ray by several orders of magnitude on timescales accessible to us. Few astronomical objects are as dynamical on these timescales. Gamma-ray bursts (GRBs) including their afterglows are one (e.g. Berger et al., 2005), but extremely swift multiwavelength follow-up is required to track their light curves. Other interacting binaries such as CVs are another – CVs are more abundant than XBs but are generally fainter at very high and very low frequencies (e.g. Patterson & Raymond, 1985, as also are supernovae). There are also oddball binary stars which emit at radio through to X-rays and are variable (e.g. Whitelock et al., 2004) but they generally do not span the luminosity range of XBs. The luminosity of SMBHs must vary by many orders of magnitude (sometimes they are AGN and sometimes they are relatively inactive) but in our lifetime we see just a snapshot of their ‘outburst’ light curve (see also Section 1.1.5).
The dynamical availability of these sources only makes them interesting if their behaviour tells us something useful. Luckily, it does. General relativity can be tested in the strong gravitational field near compact objects, and XBs could reveal the existence of event horizons, i.e. black holes (by e.g. the differences between NSXBs and BHXBs), or the nature of the matter in neutron stars. The study of XBs and their populations also constrains theories of various astrophysical processes including stellar evolution (the compact object is the endpoint of massive stars), the composition of the ISM (e.g. the progenitor of the compact object enriches the ISM with heavy elements from the supernova), black hole and neutron star formation and evolution, and jet formation mechanisms, to name a few. The process of accretion in XBs can be compared to other accreting objects: CVs, AGN, GRBs, YSOs. Finally, stellar mass BHs can, as shown recently, tell us a wealth of information about SMBHs (see Section 1.1.5). Of course, the work in this thesis comes nowhere near answering any fundamental questions, but does contribute to our understanding of the behaviour of these interesting objects.
1.2 Optical/NIR emission from X-ray binaries
Historically, the main uses of identifying and monitoring the optical or NIR counterpart of an XB are to establish the geometry of the accretion flow, in particular the mass of the compact object and nature of the companion star (White, Nagase & Parmar, 1995). The best localisation of an XB is also traditionally obtained from radio or optical follow-up of an X-ray detection. It has now become clear that studying the optical/NIR (OIR) counterparts of XBs can uncover a varied wealth of information about these sources. For example, the detection of optical emission lines can tell us about the geometry and workings of the accretion disc (e.g. Marsh, Robinson & Wood, 1994) or (very rarely) the outflow (Margon, 1984; Blundell & Bowler, 2005) and absorption lines can tell us about the companion star and level of interstellar dust extinction towards the source (e.g. Wagner et al., 1991; Casares et al., 1993).
Most of the OIR light from LMXBs comes from the continuum, which is (in outburst) usually blue and generally thought to arise in the outer accretion disc as the result of X-ray reprocessing (Cunningham, 1976; Vrtilek et al., 1990; van Paradijs & McClintock, 1995), a process whereby the surface of the disc absorbs high energy ultraviolet (UV) or X-ray photons and is heated, then re-emitted as thermal radiation at lower energies. Indeed, timing and spectral analysis in many cases has led to this conclusion (e.g. Wagner et al., 1991; Callanan et al., 1995; O’Brien et al., 2002; Hynes et al., 2002a; Hynes, 2005). However, reprocessed X-rays are often misleadingly assumed to dominate the OIR light in LMXBs. Some observations (of BHXBs in particular but also sometimes of NSXBs) point towards alternative physical processes contributing (and sometimes dominating) the OIR emission. It is important to quantify these contributions to constrain the broadband spectrum. In addition, many analyses assume the emission is dominated by a specific mechanism. For example, optical colours have been used (i) in quiescence to uncover the spectral type of the companion, sometimes assuming that the light is coming solely from the companion, and (ii) in outburst to measure the temperature of the accretion disc, usually assuming the light is dominated by X-ray reprocessing.
The aim of a large proportion of this thesis is to constrain the OIR contributions of the different emission processes at a given time for a given LMXB. This is motivated by the recent realisation that jet emission may be a significant contributor in this waveband.
1.2.1 Data availability

It is clear that OIR studies of LMXBs can reveal important informations about these objects. Conveniently, optical and infrared (IR) telescopes are the most abundant. Many galactic LMXBs can be detected with a high level of confidence in only a few minutes on relatively small optical telescopes. In Fig. 6 I show a very simplified broadband spectral energy distribution (SED) of a typical LMXB in outburst in the hard state. It is based on an observed broadband SED with unprecedented wavelength coverage from radio to X-ray (from Markoff, Falcke & Fender, 2001). The flux density is plotted against frequency, both in logarithmic scales. The flat (, where ) part of the spectrum is normalised to 10 mJy and the non-flat part has (approximating to the SED in Markoff et al., 2001).
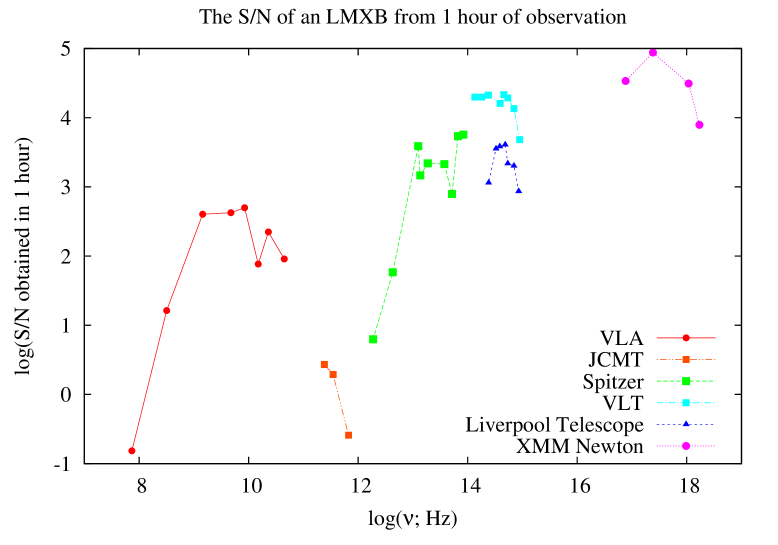
The signal-to-noise ratio (S/N) can be used to measure the level of confidence in a detection of a source. Using the various exposure time calculators for a number of telescopes, it is possible to estimate what the S/N of an LMXB with the above SED would be for each telescope, in a given amount of integration time. The S/N obtained in one hour of on-source integration for a number of telescopes is shown in Fig. 7. Exposure time calculators were used with the optimum setup for each waveband/instrument/filter under average (or default) external conditions and are given in Table 1. Data from Hasinger et al. (2001) are used for XMM Newton. Fig. 7 shows that an LMXB can be detected with a S/N of almost using XMM Newton at soft X-ray energies and with the Very Large Telescope (VLT; 8 metre mirror) in the optical and NIR. Even the smaller Liverpool Telescope (2 metre mirror) can achieve a high () S/N in one hour. These calculations do not take into account (i) the time needed for calibrations and overheads, which vary between telescopes, and (ii) interstellar dust extinction – sources that are obscured will be harder to detect in the optical and NIR – but radio telescopes are unaffected.
| Telescope | Waveband name | log | Waveband name | log |
|---|---|---|---|---|
| VLA | 4 (73–74.5 MHz) | 7.87 | P (300–340 MHz) | 8.50 |
| VLA | L (1.24–1.70 GHz) | 9.16 | C (4.5–5.0 GHz) | 9.68 |
| VLA | X (8.1–8.8 GHz) | 9.93 | U (14.6–15.3 GHz) | 10.18 |
| VLA | K (22.0–24.0 GHz) | 10.36 | Q (40.0–50.0 GHz) | 10.65 |
| JCMT | A3 (211–272 GHz) | 11.38 | HARP (325–375 GHz) | 11.54 |
| JCMT | WD (630–710 GHz) | 11.83 | ||
| Spitzer | IRAC: 3.6 m | 13.92 | IRAC: 4.5 m | 13.82 |
| Spitzer | IRAC: 5.8 m | 13.71 | IRAC: 8.0 m | 13.57 |
| Spitzer | IRS PUI: 16 m | 13.27 | IRS PUI: 22 m | 13.14 |
| Spitzer | MIPS: 24 m | 13.10 | MIPS: 70 m | 12.63 |
| Spitzer | MIPS: 160 m | 12.27 | ||
| VLT | ISAAC: Ks | 14.13 | ISAAC: H | 14.26 |
| VLT | ISAAC: J | 14.38 | FORS1: I | 14.59 |
| VLT | FORS1: R | 14.66 | FORS1: V | 14.73 |
| VLT | FORS1: B | 14.84 | FORS1: U | 14.95 |
| Liverpool | SupIRCam: H | 14.26 | SupIRCam: J | 14.38 |
| Liverpool | RATCam: z’ | 14.52 | RATCam: i’ | 14.59 |
| Liverpool | RATCam: r’ | 14.69 | RATCam: V | 14.73 |
| Liverpool | RATCam: B | 14.84 | RATCam: u’ | 14.93 |
| XMM Newton | EPIC: 0.2–0.5 keV | 16.88 | EPIC: 0.5–2.0 keV | 17.38 |
| XMM Newton | EPIC: 2-10 keV | 18.03 | EPIC: 5-10 keV | 18.23 |
Log is the central frequency in log space. The S/N is calculated from the VLA Sensitivity web page, the Heterodyne Integration TimE Calculator for the JCMT, the Sensitivity – Performance Estimation Tool (SENS-PET) for Spitzer, the FORS1 Exposure Time Calculator and the ISAAC Exposure Time Calculator for the VLT, the Liverpool Telescope Exposure Calculator and Hasinger et al. (2001) for XMM Newton.
It seems that optical and infrared telescopes are not only the most abundant, but can achieve a higher S/N in a given time than telescopes at most other wavebands. It is therefore important to take advantage of this data availability; to observe details in their behaviour that are probably not observable at other frequencies. The wavebands with the highest S/N from the data collected are OIR and X-ray, so correlations between these two bands can be explored over a greater luminosity range than say, radio–X-ray correlations (see Chapter 2).
1.2.2 The nature of the OIR emission
The origin of the emission from LMXBs is known in some wavebands and not so well established in others. Radio emission is produced by the synchrotron process in collimated outflows/jets (see e.g. Hjellming & Han, 1995; Fender, 2006), whereas X-ray emission could originate directly from the hot inner accretion disc, from a Comptonising corona, from an advective flow, or from the compact jets (all of which have been successfully modelled; Poutanen, 1998; Narayan, Mahadevan & Quataert, 1998; McConnell et al., 2000; Markoff, Falcke & Fender, 2001; Brocksopp, Bandyopadhyay & Fender, 2004; Markoff, Nowak & Wilms, 2005; Rogers et al., 2006). The OIR is perhaps the waveband for which the relative contributions of the different emission processes are least certain.
Various techniques have been adopted to infer the physical emission mechanisms responsible for the OIR light from X-ray binaries. Numerous processes may contribute to the OIR emission depending on the flux and spectral state of the source at the time. This is evident from the complex variety of spectral, timing and luminosity properties observed between sources and between states for an individual source. In HMXBs, the OIR light is largely dominated by the massive companion star in the system (van den Heuvel & Heise, 1972) with occasional additional contributions, for example from the reprocessing of X-rays. For NSXBs, there is strong evidence for a central X-ray source illuminating a disc that reprocesses the light to OIR wavelengths (see e.g. McClintock et al., 1979).
OIR emission from BHXBs has been extensively studied in outburst and quiescence (for a review see van Paradijs & McClintock 1995; see also Chen, Shrader & Livio 1997 and Charles & Coe 2006). The techniques employed in the literature to attribute an emission process to the behaviour of a BHXB are numerous. Here I discuss the most cited emission mechanisms that can contribute to the OIR light, and the common techniques used to infer their presence. BHXBs are discussed first, followed by any differences that exist in NSXB systems. The findings so far are discussed for BHXBs in the three most stable spectral/luminosity states: the low-luminosity hard state (i.e. quiescence; ), the high-luminosity hard state (i.e. in outburst; ) and the soft state (also in outburst; usually at ). ‘Optical’ and ‘NIR’ emission is here classed as that seen in the (Å) and () wavebands, respectively.
The reprocessing of X-rays in the outer accretion disc or on the companion star surface:
Reprocessing is apparent in many accreting systems by the signature of correlated OIR and X-ray behaviour, whereby the OIR lags the X-rays on light-travel timescales (e.g. O’Brien et al., 2002, on the order of seconds for XBs; this may not be a diagnostic of X-ray reprocessing however; see below). The surface of the disc (or companion star) is being illuminated by X-rays, which are absorbed by the surface and then reprocessed to OIR wavelengths. Models predict the OIR to lie in the part of the blackbody spectrum where the spectral index (where ) is positive; some observations indicate the Rayleigh Jeans tail region of the blackbody, where , and some have a lower spectral index (e.g. Hynes, 2005). X-ray reprocessing is associated with very strong emission lines which arise from atoms recombining after becoming ionised by the high energy photons. Double-peaked emission lines have been observed in the optical (Marsh, Robinson & Wood, 1994; Orosz & Bailyn, 1995; Orosz et al., 2002) and NIR (e.g. Shahbaz et al., 1999) in quiescence, and at higher luminosities in both the hard state (e.g. Shrader et al., 1994) and in the soft state (Casares et al. 1991; 1999), which signify the red- and blue-shifted components of the rotating accretion disc.
Optical SEDs of some sources are fit well by models with a contribution from X-ray reprocessing in the hard and soft states (e.g. Hynes et al., 2002a; Hynes, 2005) and Chen et al. (1997) found that the properties of most transient outbursts in BHXBs and NSXBs are consistent with the disc thermal instability model (Mineshige & Wheeler, 1989), where X-ray reprocessing dominates the optical regime (King & Ritter, 1998). X-ray reprocessing on the surface of the companion star heats the side facing the compact object, producing periodic optical variations (e.g. Basko et al., 1974). BHXBs, which are LMXBs, mostly have small mass ratios (Ritter & Kolb, 2003); hence emission from reprocessing on the companion star is generally weak (van Paradijs & McClintock, 1995).
Intrinsic thermal emission from the viscously heated outer accretion disc:
In optically thick accretion disc models, the viscously heated disc is expected to contribute significant light in the optical, through UV to X-ray wavelengths (Shakura & Sunyaev, 1973; Frank, King & Raine, 2002). The accretion discs of BHXBs are generally larger than those of NSXBs and may be more luminous. The spectrum is that of a multi-temperature blackbody with a positive OIR spectral index, similar to that of the X-ray heated disc. However, the different temperature distributions that arise from viscous and irradiative heating result in spectra with different spectral indices in the UV (e.g. Hynes, 2005). Changes in the accretion rate affect the OIR before the X-rays since the OIR and X-ray disc emission originate in the outer and inner parts of the accretion disc, respectively.
In one BHXB, A0620–00, changes in the NIR light in the soft state was seen to precede the optical, which in turn preceded the X-rays on the viscous timescale (typically days–weeks for BHXBs); an indication of intrinsic disc emission (Kuulkers, 1998; Esin et al., 2000). Similar optical–X-ray (e.g. Soria, Wu & Johnston, 1999; Brocksopp, Groot & Wilms, 2001a, b) and NIR–X-ray (e.g. Homan et al., 2005a) behaviour has been noted in other BHXBs in the hard and soft states. The presence of superhumps (periodic variations whose periods are slightly longer than the orbital period; thought to originate in the hot spot; see Fig. 2) during outburst in the hard state (e.g. Kato, Mineshige & Hirata, 1995) and behaviour consistent with the Mass Transfer Instability (MTI; Hameury, King & Lasota, 1990) model (e.g. Callanan et al. 1995; Kuulkers 1998 and references therein) have also been interpreted as evidence for emission from the viscously heated disc.
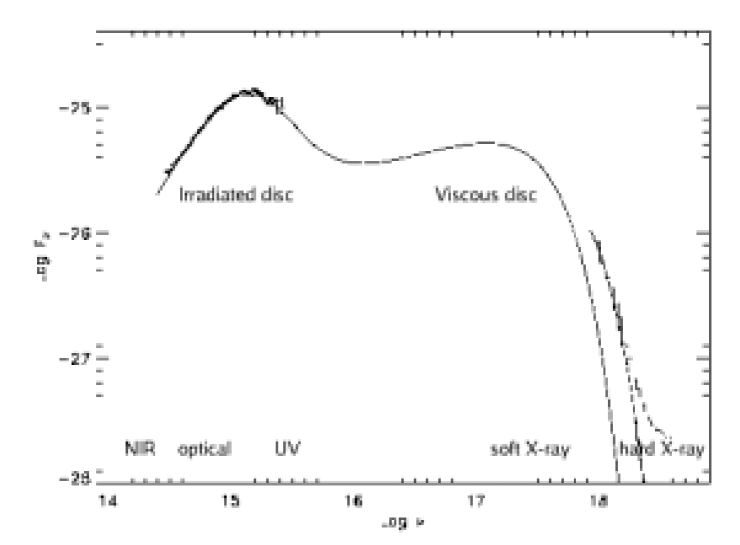
A model (Hynes et al., 2002a) of the broadband SED of an X-ray plus viscously heated disc is shown in Fig. 8. In this case, the OIR is dominated by the Rayleigh Jeans tail of the blackbody from the X-ray reprocessing component.
Intrinsic thermal emission from the companion star:
In HMXBs, the characteristic blackbody with stellar absorption lines provides evidence for the domination of the companion star at OIR wavelengths (e.g. Treves et al., 1980). The presence of an ellipsoidal period with the characteristic light curve of a gravitationally distorted companion also implies thermal emission from the star; normal unperturbed stars only vary by very small amplitudes in comparison (e.g. Linsky, 1977; Simpson et al., 2006). These features are sometimes observed in LMXBs in quiescence. They have been seen in BHXBs in the optical (Oke, 1977; McClintock et al., 1983; Bailyn, 1992; Callanan et al., 1992; Casares et al., 1995; Orosz et al., 1996; Garcia et al., 1996; Soria & Wu, 1999) and the NIR (Shahbaz, Bandyopadhyay & Charles, 1999; Froning & Robinson, 2001; Greene, Bailyn & Orosz, 2001; Gelino & Harrison, 2003; Mikołajewska et al., 2005). The companion may play a significant role in outburst for BHXBs in which the star is comparatively large (e.g. GRO J1655–40; Hynes et al., 1998). Large increases or decreases in OIR luminosity cannot be explained by thermal stellar emission from the companion.
Synchrotron emission from a conical jet:
Optically thick synchrotron emission from partially self-absorbed jets is observed at radio wavelengths in BHXBs as a flat/inverted power-law ( 0) spectrum, when the source is in the hard X-ray state (Fender, 2001). Models show that a simple ‘isothermal’ conical jet can produce a flat spectrum, where the size scale of the emission region is linearly proportional to the wavelength (Blandford & Konigl, 1979; Kaiser, 2005). The jet is optically thick at radio frequencies to relatively large distances (light hours) from the launch region. Evidence has been mounting only in the last 5 or so years, that this flat spectrum may extend to the OIR regime or beyond from spectral (Han & Hjellming, 1992; Fender, 2001; Corbel et al., 2001; Brocksopp et al., 2002; Markoff et al., 2003; Chaty et al., 2003; Brocksopp et al., 2004) and timing (Kanbach et al., 2001; Uemura et al., 2004) studies. If the spectrum extends to the OIR, the jet must be self-similar over the same range in physical size, i.e. 5 orders of magnitude (Fender, 2001). NIR flares in GRS 1915+105 were found to be associated with radio (i.e. jet) ejections (Fender et al., 1997; Mirabel & Rodriguez, 1998; Eikenberry et al., 1998) and NIR jets have been ambiguously resolved in this source (Sams, Eckart & Sunyaev, 1996).
The optically thick synchrotron jet spectrum is predicted to break to an optically thin spectrum (0.6) at a ‘turnover’ at shorter wavelengths (Blandford & Konigl, 1979). This turnover is predicted to lie in the IR waveband according to some models (Markoff et al. 2001; 2003), which has been tentatively confirmed in observations of one source: GX 339–4 (Corbel & Fender, 2002). The position of this turnover is essential in estimating the power in the jets, as the power is dominated by the higher energy photons. Nowak et al. (2005) have also analysed GX 339–4 and claim that the position of the turnover from optically thick to optically thin emission may decrease in wavelength with decreasing luminosity, as expected in some models. The NIR spectra of some BHXBs in the hard state in outburst can be fit by a negative power law and suggest an optically thin synchrotron emission origin (e.g. 4U 1543–47; Buxton & Bailyn 2004; Kalemci et al. 2005 and XTE J1118+480; Hynes et al. 2006b).
Recently, Homan et al. (2005a) extensively studied an outburst of GX 339–4 at OIR wavelengths, and revealed strong evidence that the NIR is dominated by optically thin synchrotron emission from the jet when the source is in the hard state. A strong drop of the -band flux was observed as the jet was quenched in the soft state, similar to the quenching of the radio emission seen in many BHXBs in the soft state (Tananbaum et al. 1972; Fender et al. 1999a; Gallo, Fender & Pooley 2003; and perhaps in AGN, see Maccarone, Gallo & Fender 2003). In XTE J1550–564 and 4U 1543–47, Jain et al. (2001b) and Buxton & Bailyn (2004) (respectively) noted a drop and then rise in the OIR flux (moreso in the NIR than the optical) in transition from and to the hard state respectively, supporting the notion of a jet origin to the flux in the hard state.
Other characteristics of emission from the compact jet include fast variability and a featureless continuum with no emission lines. Variability and flaring activity (seconds–hours) and a flat/slightly negative OIR spectral index (after subtraction of the companion star spectrum) observed from BHXBs in quiescence (Hynes & Haswell, 1999; Zurita et al., 2003; Shahbaz et al., 2003a; Hynes et al., 2003c; Shahbaz et al., 2004; Zurita et al., 2004) and at higher luminosities in the hard state (Motch, Ilovaisky & Chevalier, 1982; Bartolini et al., 1994; Ueda et al., 2002; Hynes et al., 2003b, 2006b) has sometimes been attributed to a non-thermal origin. In addition, Malzac, Merloni & Fabian (2004) showed that OIR emission lagging X-rays on timescales seconds (a behaviour normally attributed to X-ray reprocessing) can be explained by OIR jet synchrotron emission fed by an X-ray corona. Indeed, many components of XBs can be variable; even in HMXBs the circumstellar discs around Be stars can be extremely variable (Schurch et al., 2007). In some BHXBs, correlations between the emission line and continuum intensities during flaring events in quiescence can constrain their origin (e.g. Hynes et al., 2002c). Models also predict a high level of linear polarisation for optically thin synchrotron emission – this may be the definitive test of optically thin synchrotron emission in these systems (see Section 1.2.4 for further discussion).
Additional emission processes:
Behaviour that is not consistent with intrinsic disc or reprocessed emission has in the past been attributed to e.g. magnetic loop reconnection in the outer disc (e.g. Zurita, Casares & Shahbaz, 2003) or emission from a magnetically dominated compact corona (e.g. Merloni, Di Matteo & Fabian, 2000), although this corona may be indistinguishable from the base of the compact jet. Variability and flaring have alternatively been interpreted as emission from an advective region (e.g. Shahbaz et al., 2003a). In addition, Doppler images of Balmer lines sometimes show a stream from the companion hitting the accretion disc at the ‘hot spot’ (Marsh et al., 1994; Shahbaz et al., 2004; Torres et al., 2004); a further origin of OIR light. In quiescent LMXBs, it is possible that a circumbinary disc that surrounds the whole system can be detected in the IR (Muno & Mauerhan, 2006) but recent evidence suggests the observations are explained by the jet (Gallo et al., 2007). Circumbinary discs are thought to exist around some accreting binaries, for example CVs (e.g. Hoard et al., 2007).
Neutron star X-ray binaries:
In NSXBs, many spectral and timing studies have established the presence of an accretion disc reprocessing X-ray photons to optical wavelengths (e.g. McClintock et al., 1979; Lawrence et al., 1983; Kong et al., 2000; McGowan et al., 2003; Hynes et al., 2006a). In quiescence, the companion star can come to dominate the OIR emission (e.g. Thorstensen, Charles & Bowyer, 1978; Chevalier et al., 1989; Shahbaz, Naylor & Charles, 1993), as is the case in HMXBs and many BHXBs. X-ray reprocessing is generally thought to dominate the OIR emission of non-quiescent NSXBs (see van Paradijs & McClintock 1995 for a review; see also Chen, Shrader & Livio 1997; Charles & Coe 2006). In these systems, matter is accreted onto a neutron star but, like the BHXBs, some of the matter and energy can be released from the system through jets. Evidence for jets associated with NSXBs date back more than a decade (Stewart et al., 1993; Bradshaw, Fomalont & Geldzahler, 1999; Fomalont, Geldzahler & Bradshaw, 2001) but not until recently has the evidence emerged from any waveband other than the radio. Callanan et al. (2002) found that IR -band flaring in the Z-source NSXB GX 17+2 could not be explained by an X-ray driven wind or reprocessed X-rays, but shared many properties with the radio (i.e. jet) variability previously seen in the same source. It is worth noting that the NIR counterpart of GX 13+1 is also largely variable (Charles & Naylor, 1992). Recently, Migliari et al. (2006) for the first time spectrally detected optically thin synchrotron emission from the compact jets of an atoll NSXB 4U 0614+09 in the mid-IR.
Recently, an anomalous transient NIR excess has been observed in a number of MSXPs at high luminosities, which is equivocal in nature. The source most studied is SAX J1808.4–3658, for which Wang et al. (2001) found a NIR flux almost one order of magnitude too bright to originate from X-ray heating. The NIR flux density was comparable to a radio detection of 0.8 mJy (with a flat 2.5–8.6 GHz spectrum) seen one week after the NIR excess. Greenhill, Giles & Coutures (2006) also reported an -band excess in a different outburst of the same source, which they attributed to synchrotron emission. In addition, a variable - and -band excess in XTE J0929–314 seen on the same day as a radio detection (Giles et al., 2005), and a transient NIR excess in XTE J1814–338 (Krauss et al., 2005) and IGR J00291+5934 (Torres et al., 2007) were all interpreted as synchrotron emission from the steady jets in the systems. The NIR excess appears to be ubiquitously absent at lower luminosities.
Steady, partially self-absorbed jets probably exist in low-magnetic field ( G) NSXBs in hard X-ray states (Migliari & Fender, 2006; Massi, 2006). These include atolls in the ‘island’ state, Z-sources in the ‘horizontal branch’ and possibly the ‘normal branch’ and transients at low accretion rates () such as MSXPs. Massi (2006) argues on theoretical grounds that the existence of jets in NSXBs depends on the magnetic field and mass accretion rate, and the conditions required for jet ejection are probably fulfilled for most of the NSXBs (Z-sources, atolls and MSXPs) with known magnetic field strengths, further supporting the existence of jets in theses systems.
1.2.3 Towards a unified model for the OIR behaviour
Power-law correlations between OIR and X-ray luminosities are naturally expected from a number of emission processes. van Paradijs & McClintock (1994) showed that the optical luminosity of an X-ray reprocessing accretion disc varies as , where is the temperature and is the orbital separation of the system, and that this correlation has been observed in a selection of LMXBs. – correlations are also expected when the OIR originates in the viscously heated disc as both X-ray and OIR are linked through the mass accretion rate (see Section 2.4.2).
In addition, OIR–X-ray correlations can be predicted if the OIR emission originates in the jets. Models of steady, compact jets demonstrate that the total jet power is related to the radio luminosity as (Blandford & Konigl, 1979; Falcke & Biermann, 1996; Markoff et al., 2001; Heinz & Sunyaev, 2003). It was shown that the jet power is linearly proportional to the mass accretion rate in NSXBs and BHXBs in the hard state (Falcke & Biermann, 1996; Migliari & Fender, 2006; Körding, Fender & Migliari, 2006) and the X-ray luminosity scales as ṁ and ṁ∼2 for radiatively efficient and inefficient objects, respectively (e.g. Shakura & Sunyaev, 1973; Narayan & Yi, 1995; Mahadevan, 1997; Körding, Fender & Migliari, 2006, Section 1.1.4). The accretion in hard state BHXBs is found to be radiatively inefficient (the majority of the liberated gravitational potential is carried in the flow and not radiated locally), where jet-dominated states can exist, whereas in NSXBs, the accretion is radiatively efficient, and jet-dominated states are unlikely to exist (see also Fender et al., 2003). We therefore have:
BHXBs: ṁ
NSXBs: ṁ
The correlation for BHXBs has been observed (Corbel et al., 2003; Gallo, Fender & Pooley, 2003) and very recently, Migliari & Fender (2006) have applied this technique to NSXBs and found ; which is also consistent with the above NSXB model. If the optically thick jet spectrum is indeed flat from the radio regime to OIR, we can expect the following correlations:
BHXBs:
NSXBs:
Homan et al. (2005a) discovered a correlation between the quasi-simultaneous NIR (which was shown to originate in the jets) and X-ray fluxes for GX 339–4 in the hard state, with a slope (3–100 keV). To date, no other sources have been tested for jet OIR emission using OIR–X-ray correlations.
It is now becoming clear that this profitable but simple technique of analysing the dependence of OIR and X-ray luminosities over many orders of magnitude, may prove fruitful for the understanding of the emission mechanisms involved. The unification of jet–X-ray state activity is now underway; a steady jet exists in the hard state, which is accelerated as the X-ray spectrum softens, and is finally quenched as it passes the ‘jet line’ into the soft state (Fender et al., 2004, see Section 1.1.4). A unification (if one exists) of the origins of OIR light from BHXBs and NSXBs in different spectral and luminosity states is desired to understand the behaviour of these systems. Furthermore, a measure of the level of OIR emission from jets may be used to constrain jet power estimates.
1.2.4 Polarised OIR emission
A further dimension of information is available if we include polarimetry. Polarimetric capabilities are generally possible at radio, OIR and UV regimes but not in X- or -rays (although see Willis et al., 2005). OIR polarimetric studies can provide information about the physical conditions of LMXBs and inner accretion flow. Most radiation from LMXBs is expected to be unpolarised, for example thermal blackbody radiation from the accretion disc or companion star. The scattering of unpolarised photons could result in a small degree of net polarisation in certain geometries (e.g. Dolan, 1984). There is one emission mechanism known to be present in LMXBs that intrinsically produces polarised light – synchrotron emission (coherent emission from e.g. radio pulsars can be highly polarised but has not been observed in LMXBs). It has been known for decades that optically thin synchrotron radiation can produce a high level (tens of percent) of linear polarisation if the magnetic field structure is ordered (e.g. Westfold, 1959; Björnsson & Blumenthal, 1982).
Linear polarisation (LP) of BHXBs is measured at radio frequencies at a level of –3% in a number of sources in the hard state, and up to % during transient radio events associated with X-ray state transitions and jet ejections (for a review see Fender 2006). During transient jet ejections the synchrotron spectrum is optically thin, with a negative spectral index . For optically thin synchrotron emission, a strong LP signal is expected, of order 70% , where can be considered to crudely parameterise the degree of ordering of the large scale magnetic field (Rybicki & Lightman, 1979; Björnsson & Blumenthal, 1982). The high polarisation levels measured in the radio from these optically thin ejections have indicated that may be as large as 0.5, and have provided clues towards the fundamental jet and magnetic field properties (Fender et al., 1999b; Hannikainen et al., 2000; Gallo et al., 2004; Brocksopp et al., 2007).
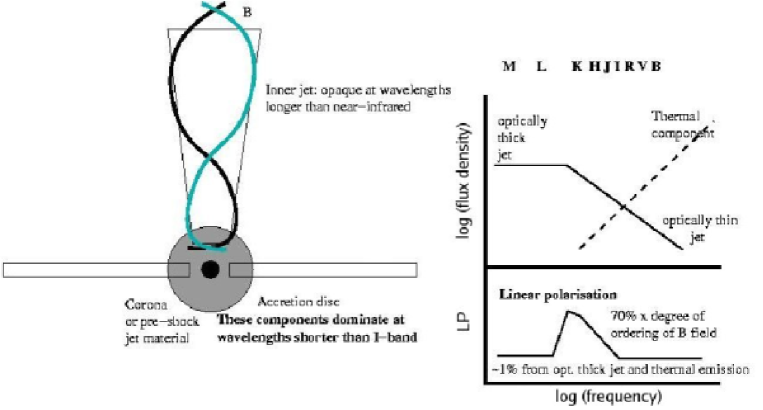
In the hard state which has a steady, compact jet, the higher frequency photons from the jet are emitted in its inner regions (in the absence of shocks downstream), closest to the compact object (see the left panel of Fig. 9). In the optical regime the reprocessed light from the X-ray illuminated accretion disc should be no more than % polarised, much like the optically thick jet. In the NIR, a strong polarised signal from the optically thin synchrotron emission is expected. The suggested expected LP as a function of frequency is presented in Fig. 9 (right panel). It is currently uncertain whether the jet component dominates the NIR at low luminosities (near quiescence); in most systems the companion star comes to dominate (e.g. Charles & Coe, 2006) but in some it does not (e.g. GX 339–4; Shahbaz, Fender & Charles, 2001). If the value of is high, a polarised signal from the jet component should be detectable. Higher levels of LP (% in Cyg X–1 and up to % in SS 433), which are variable, have been detected in the UV (Wolinski et al., 1996; Dolan et al., 1997) and result from a combination of Thomson scattering (whereby charged particles scatter the light) and Rayleigh scattering (scattering by particles smaller than the wavelength of the light).
Radio polarimetry has shown that in some cases, the magnetic field is fairly ordered in the optically thin transient jet ejections. When the radio spectrum is optically thick, LP is detected at a level of a few percent; lower than from the optically thin spectrum. Consequently, if a high level of LP is observed from the hard state IR optically thin spectrum, the magnetic field at the base of the steady hard state jet must also be ordered. Therefore IR LP is key to understanding the conditions of the inner regions of the steady jet flow, in particular the level of ordering of the magnetic field. In addition, the higher frequency IR photons do not suffer from Faraday rotation, which can confuse radio results.
In the optical regime of LMXBs, just two sources (A0620–00 and GRO J1655–40) possess intrinsic LP to my knowledge (Dolan & Tapia, 1989; Gliozzi et al., 1998). The LP varies as a function of orbital phase and is likely caused by the scattering of intrinsically unpolarised thermal emission (e.g. Dolan, 1984). No intrinsic LP has been detected from optical observations of NSXBs, except for tentatively in Aql X–1 (Charles et al., 1980).
In 2006, Dubus & Chaty were the first to report IR polarimetric observations of LMXBs. They found no evidence for intrinsic LP in H1743–322 in outburst or GRO J1655–40 in quiescence, but did find significant (at the 2.5 level) LP (which is probably intrinsic) in XTE J1550–564 during a weak X-ray outburst. No polarised standard star was observed so the authors were unable to calibrate the polarisation position angle (PA), however if the calibration correction is small then PA , which is perpendicular to the known jet axis (Corbel et al., 2002). The polarisation PA is a measure of the electric vector, which for optically thin synchrotron emission, is perpendicular to the magnetic field vector. Therefore in XTE J1550–564 the magnetic field may be parallel to the jet. Very recently, Shahbaz et al. (2007) performed IR spectropolarimetry of three LMXBs and found two of them (the NSXBs Sco X–1 and Cyg X–2) to be intrinsically polarised, with an increasing LP at lower frequencies. They interpret this as the first detection of the polarised inner regions of the compact jets.
It is interesting to note that polarimetric observations of jets from AGN (which are resolved and are of course orders of magnitude larger and more powerful than X-ray binary jets) have revealed a strong link between the local magnetic field and the dynamics of the jet. LP levels of % are observed in the optical and radio, confirming the emission is synchrotron, and the levels and position angles are often correlated with intensity and morphology (for overviews see Saikia & Salter, 1988; Perlman et al., 2006). In addition, NIR flares from the black hole at the centre of our Galaxy, Sgr A∗, are also highly polarised (–20%) and may originate in its jets (Eckart et al., 2006; Meyer et al., 2006).
1.2.5 Extended OIR emission associated with X-ray binaries
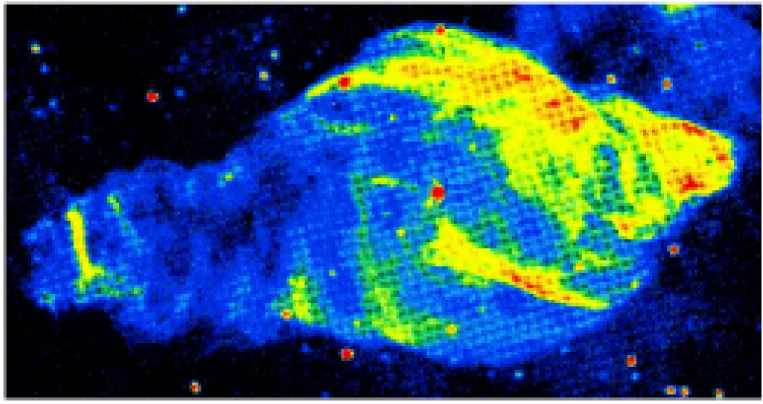
In addition to direct light produced within the XB system, there are ways in which XBs can indirectly produce emission outside the system. The progenitor of the compact object is responsible for the supernova which results in a shell of expelled matter; the supernova remnant (SNR), and some XBs have been found to be associated with these large, extended structures (e.g. SS 433 and the W50 nebula; Spencer, 1979; Dubner et al., 1998, see Fig. 10).
XBs themselves release both energy and matter into the surrounding ISM via photons, jets, disc winds, stellar winds and high-energy particles (cosmic rays). The disruption and interaction of these sources of energy with the local environment could cause detectable emission. High energy photons from the X-ray source can ionise the surrounding gas and if the local density is high enough, an X-ray-ionised nebula can be seen (e.g. LMC X–1; Pakull & Angebault, 1986) in optical line emission. XB jets plough into the local ISM and if again the local density is high, shock waves are formed which can be detected in the radio and optical (Gallo et al., 2005) in front of radio lobes (e.g. Mirabel et al., 1992).
The power carried by the steady, hard state jets when averaged over their lifetime stands as one of the key questions in our understanding of BHXB accretion, and possibly for black hole accretion on all mass scales. In recent years it has become apparent that a significant fraction of the liberated accretion power is ejected as jets in hard state BHXBs (e.g. Gallo et al., 2003), and it now seems likely that in hard X-ray states the accretion flow is ‘jet-dominated’ (Fender, Gallo & Jonker, 2003), with more power in the jets than in X-rays. Measuring as accurately as possible the power of the compact jet is key to understanding both the overall physics of the accretion process and the matter and energy input from BHXBs into the ISM. The jets may be the strongest ISM-energising sources produced by XBs.
While the presence of the hard state jets is commonly inferred from the flat radio-through-IR spectral component, radio observations of the nearby (d = 2.10.1 kpc; Massey, Johnson & Degioia-Eastwood, 1995) high-mass BHXB Cygnus X–1 have directly resolved a collimated jet 30 AU in length (Stirling et al., 2001), whilst in the hard state. A transient radio jet has also been observed of length 140 AU in this source, that was launched during a period of X-ray state transitions (Fender et al., 2006). Attempts at estimating the jet power content from core radio luminosities of the hard state jets are riddled with assumptions about its spectrum and radiative efficiency, the latter of which is poorly constrained (e.g. Ogley et al., 2000; Fender, 2001; Homan et al., 2005a; Heinz, 2006). The radiative efficiency, although uncertain is estimated to be low: typically percent (Ogley et al., 2000; Fender, 2001). The jet power estimated in this way is highly sensitive to the location of the high-frequency break of the flat (spectral index ) optically thick part of the jet spectrum, as the radiative power is dominated by the higher energy photons (Blandford & Konigl, 1979).
The jet power may alternatively be constrained by analysing its interaction with the surrounding medium, without requiring prior knowledge of the jet spectrum and radiative efficiency. Radio lobes associated with jets from AGN are commonly used as accurate calorimeters of the power lifetime product of the jets (Burbidge, 1959), a method only very recently applied to jets from stellar mass black holes. Radio lobes have been identified and associated with an increasing number of BHXBs (Mirabel et al., 1992; Rodríguez et al., 1992; Corbel et al., 2002) and a couple of NSXBs (Fomalont, Geldzahler & Bradshaw, 2001; Tudose et al., 2006).
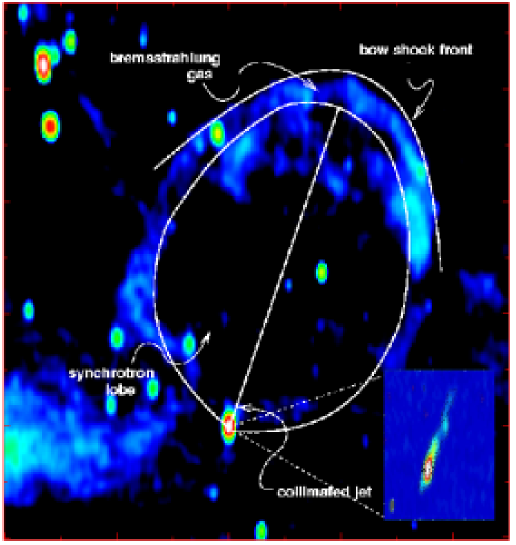
Recently, deep radio observations of the field of Cyg X–1 resulted in the discovery of a shell-like structure which is aligned with the aforementioned resolved radio jet (Gallo et al., 2005). This jet-blown nebula with a diameter of pc is interpreted as the result of a strong shock that develops at the location where the collimated jet impacts on the ambient ISM (Fig. 11). The nebula was subsequently observed at optical wavelengths by the Isaac Newton Telescope (INT) Wide Field Camera (WFC) and is clearly visible in the H (6568 Å) filter, and coincident with the radio shell (see Chapter 6). The flux density mJy arcsec-2 is times the measured radio flux density, inconsistent with optically thin synchrotron emission between the two spectral regimes and instead favouring a thermal plasma with H line emission (Gallo et al., 2005).
Models of X-ray binary jet–ISM interactions predict a shell of shocked compressed ISM emitting bremsstrahlung radiation containing a bubble of relativistic plasma emitting synchrotron radiation (Kaiser et al., 2004). As with any interstellar shock wave where the preshock gas is at least partially ionised by the approaching radiation field, line emission from recombination of the shocked gas is also expected (e.g. Cox, 1972). The shell, which is essentially a radiative shock wave, consists of a bow shock front where the gas is in transition to a higher temperature due to collisions and plasma instabilities (e.g. McKee & Hollenbach, 1980). The post-shocked gas then enters the optically thin ‘cooling region’, where the overall ionisation level rises then falls as the gas radiatively cools to K (e.g. Cox & Raymond, 1985). Shock waves are commonly observed in SNRs, and shocks created from outflows exist in Herbig-Haro objects, where emission lines are produced in the shock wave created by bipolar flows from pre-main-sequence stars impacting the ISM (e.g. Schwartz, 1983). Shock fronts associated with AGN jets interacting with the intra-cluster gas (which is much hotter than the ISM; e.g. Fabian, 1994; Edge, 2001; Pope et al., 2006) are also seen at X-ray energies (Carilli, Perley & Harris, 1994; Kraft et al., 2003; Forman et al., 2005; Nulsen et al., 2005; Wilson, Smith & Young, 2006; Goodger, Hardcastle & Croston, 2007). In addition, IR sources found symmetric about the position of the XB GRS 1915+105 (Chaty et al., 2001) may be jet–ISM impact sites (Kaiser et al., 2004). The IR does not suffer from interstellar dust extinction as much as the optical, so the continuum bremsstrahlung spectrum could be detected more easily in this regime.
By modelling the shell emission of the Cyg X–1 nebula as originating from radiatively shocked gas (Castor, McCray & Weaver, 1975; Kaiser & Alexander, 1997; Heinz, Reynolds & Begelman, 1998), the total power carried by the compact jet was estimated to be erg s-1 which, when taking into account the power of the counter jet, is equal to 0.06–1 times the bolometric X-ray luminosity of Cyg X–1 (Gallo et al., 2005). These calculations have led to estimates of the matter content of the jet (Heinz, 2006); a similar technique to those applied to the jets of AGN, where their matter content are inferred from a combination of information from the core and lobes (e.g. Celotti & Fabian, 1993; Dunn, Fabian & Celotti, 2006).
These jet power calculations are highly sensitive to the velocity of the gas in the shock front. From temperature constraints and from the non-detection of an X-ray counterpart, this was estimated to be km s-1. Optical emission line ratios of shock-heated gas can constrain its parameters, including the velocity of the shock (e.g. Osterbrock, 1989).
It seems that two methods can be used to constrain the power of the compact jets using OIR emission. Firstly, OIR core emission can constrain the position of the flat spectrum high-frequency break and hence the broadband spectrum of the jet. Secondly, indirect OIR emission (in particular optical emission line ratios and continuum IR imaging) from jet-powered shock waves can constrain the velocity or the shock and hence the time-averaged jet power.
1.3 Brief summary of projects
In the following Chapters, the projects I have carried out are described. The general aim of the projects is to help answer some of the outstanding questions detailed in Chapter 1. Chapters 2–5 are related to the nature of the core OIR emission from LMXBs. In Chapter 2, correlation analysis is used to constrain the dominating OIR emission mechanisms in BHXBs and NSXBs; the results have implications for the spectrum and power of the jets. These are further constrained in Chapter 3 by analysing OIR SEDs. In Chapter 4 the emphasis is on the discovery of a jet–X-ray hysteresis; the data also reveal the dominating NIR emission processes. Linear polarimetry is used to probe the local conditions of the inner jets in Chapter 5; again the results have implications for the OIR emission.
Chapter 6 describes the analysis of optical imaging of the XB jet-powered nebula of Cyg X–1. The velocity of the shocked gas powered by the jet of Cyg X–1 is estimated, which is used to infer the time-averaged jet power. Finally, a summary of the results and possible future projects are given in Chapter 7; by including literature by other authors a general picture seems to emerge.
2 Relations between OIR and X-ray emission
2.1 Introduction
The OIR region of the spectra of low-mass X-ray binaries appears to lie at the intersection of a variety of different emission processes. In this Chapter I present a comprehensive collection of quasi-simultaneous OIR–X-ray observations of 43 XBs mostly taken from the literature, with a few new observations. Correlation analysis between the OIR and X-ray luminosities is used in conjunction with radio luminosities to estimate the contributions of various emission processes in these sources, as a function of X-ray state and luminosity. The results are used to test the predictions mentioned in Section 1.2.3. Relations between X-ray luminosity and the shape of the OIR spectrum are also examined for NSXBs (for a detailed study of the OIR spectrum in both black hole and neutron star systems see Chapter 3). These results have been published in two papers; Russell et al. (2006; hereafter Paper I) concentrates on the BHXBs and Russell, Fender & Jonker (2007; hereafter Paper IV) concentrates on the NSXBs.
In this Chapter, the data collection and the majority of the text, presentation and analysis is my own work, and the co-authors of the papers made various contributions. The new data (Sections 2.2.3 and 2.2.4) were reduced by myself (Peter Jonker made the Danish 1.54-m Telescope observations in Chile). The idea for the project came from my supervisor Rob Fender, and ideas from Peter Jonker (in particular bringing to my attention the NIR excess seen in a number of MSXPs), myself and Rob led to the second publication (Paper IV). All of the co-authors (Rob Fender, Peter Jonker, Rob Hynes, Catherine Brocksopp, Jeroen Homan and Michelle Buxton) contributed fully-reduced observational data, plus Erik Kuulkers who kindly contributed data of one source A0620–00 and Elena Gallo who provided radio and X-ray data from Gallo et al. (2003). Rob Hynes contributed the theoretical models for OIR–X-ray correlations in viscously heated discs. All of the co-authors gave valuable comments and suggested changes which included a substantial re-ordering of Paper I (which is partially reflected in this Chapter). Use of the word ‘we’ is adopted in this Chapter when referring to work not done by myself alone.
2.2 Methodology
2.2.1 Data Collection
For this work, I have collected a wealth of OIR and X-ray data from a large number of BHXBs, low-magnetic field NSXBs (atolls, Z-sources and MSXPs) and HMXBs in order to find relations that may help determine the processes responsible for the OIR light in these systems. I apply the technique of testing the dependency of OIR luminosity with X-ray luminosity for the three types of XB and between different X-ray states in BHXBs, and attempt to identify the dominant luminosity-dependent emission mechanisms.
A literature search for quasi-simultaneous (no more than 1 day between observations; for sources with outbursts 10 days in length we only use data with separations of 0.1 times the outburst length, since a few outbursts are very short, e.g. V4641 Sgr) X-ray and OIR fluxes from BHXBs, NSXBS and HMXBs was conducted. Quasi-simultaneity was achieved in many cases with use of the RXTE ASM X-ray daily monitoring. I used non-simultaneous OIR–X-ray luminosities only in quiescence for some sources, and for these we have included errors that encompass all observed values of the quiescent flux in one of the two wavebands. Where possible, tabulated fluxes or magnitudes were noted. In some cases I obtained data directly from the authors. I also made use of the DEXTER applet provided by NASA ADS to extract data from light curves where the data themselves were unattainable. For each source, the best estimates of its distance, optical extinction and HI absorption column were sought. The X-ray state of each BHXB was also noted for all data collected (but we do not discriminate between different X-ray states for NSXBs or HMXBs). The properties of each source are listed in Tables 2 & 3 (BHXBs), 4 & 5 (NSXBs), and 6 & 7 (HMXBs).
| Source name | Distance | Period | / | / |
|---|---|---|---|---|
| = alternative name | / kpc (ref) | / hrs (ref) | (ref) | (ref) |
| (I) | (II) | (III) | (IV) | (V) |
| M31 r2–70 | 78430 (1) | 192 (12) | – | – |
| GRO J0422+32 = V518 Per | 2.490.30 (2) | 5.09 (5) | 3.970.95 (15) | 0.460.31 (15) |
| LMC X–3 | 5010 (3, 4) | 40.8 (13) | 9–10 (16) | 4–8 (16) |
| A0620–00 = V616 Mon | 1.20.4 (5) | 7.75 (5) | 11.01.9 (17) | 0.740.13 (17) |
| XTE J1118+480 = KV UMa | 1.710.05 (6) | 4.08 (5) | 6.80.4 (15) | 0.280.05 (15) |
| GRS 1124–68 = GU Mus | 5.51.0 (5) | 10.4 (5) | 6.0 (18) | 0.800.11 (18) |
| GS 1354–64 = BW Cir | 27 (7; we | 61.1 (7) | 7.830.50 | 1.020.06 |
| use 336) | (15) | (15) | ||
| 4U 1543–47 = IL Lup | 7.50.5 (5) | 26.8 (5) | 9.41.0 (15) | 2.450.15 (15) |
| XTE J1550–564 = V381 Nor | 5.32.3 (5) | 37.0 (5) | 10.61.0 (19) | 1.300.43 (19) |
| GRO J1655–40 | 3.20.2 (5) | 62.9 (5) | 7.020.22 (20) | 2.350.14 (20) |
| = Nova Sco 1994 | ||||
| GX 339–4 = V821 Ara | 8 (8) | 42.1 (5) | 5.8 (21) | 0.52 (21) |
| GRO J1719–24 | 2.40.4 (9) | 14.7 (14) | 4.9 (9) | 1.6 (9) |
| = Nova Oph 1993 | ||||
| XTE J1720–318 | 8 (10) | – | – | – |
| = INTEGRAL1 51 | ||||
| XTE J1859+226 = V406 Vul | 6.31.7 (5) | 9.17 (5) | 5–12 (22) | 0.68–1.12 (22) |
| GRS 1915+105 = V1487 Aql | 9.03.0 (11) | 816 (5) | 14.04.4 (15) | 0.810.53 (15) |
| V404 Cyg = GS 2023+338 | 4.0 (5) | 155.28 (5) | 10.02.0 (15) | 0.650.25 (15) |
Columns give: (I) source names; (II) distance estimate; (III) orbital period of the system; (IV) mass of the black hole in solar units; (V) mass of the companion star in solar units. References for tables 2 to 7: (1) Stanek & Garnavich (1998); (2) Gelino & Harrison (2003); (3) Boyd et al. (2000); (4) Kovács (2000); (5) Jonker & Nelemans (2004); (6) Chaty et al. (2003); (7) Casares et al. (2004); (8) Zdziarski et al. (2004); (9) Masetti et al. (1996); (10) Cadolle Bel et al. (2004); (11) Chapuis & Corbel (2004); (12) Williams et al. (2005); (13) Hutchings et al. (2003); (14) Liu et al. (2001); (15) Ritter & Kolb (2003); (16) Cowley et al. (1983); (17) Gelino et al. (2001); (18) Esin et al. (2000); (19) Orosz et al. (2002); (20) Hynes et al. (1998); (21) Hynes et al. (2003a); (22) Hynes et al. (2002a); (23) Shrader et al. (1997); (24) Soria et al. (2001); (25) Wilms et al. (2001); (26) Wang et al. (2005); (27) Kong et al. (2002); (28) Ebisawa et al. (1994); (29) Kitamoto et al. (1990); (30) Zdziarski et al. (1998); (31) Tanaka (1993); (32) Hynes (2005); (33) McClintock et al. (1995); (34) Torres et al. (2004); (35) Orosz et al. (1996); (36) Orosz et al. (1998); (37) Greene et al. (2001); (38) Shahbaz et al. (2001); (39) Zurita et al. (2002); (40) Casares et al. (1993); (continued over).
| Source | , / 10 | / | Fluxes – data | |
| (refs) | (band, ref) | days | references | |
| (I) | (II) | (III) | (IV) | (V) |
| M31 r2–70 | 1.00.3, 1.80.5 (12) | – | 2.0 | 12 |
| GRO J0422+32 | 0.740.09, 1.60.4 (2, 23) | 0.76 (R, 2) | 0.5 | 2, 41, 42 |
| LMC X–3 | 0.190.03, 0.32 (24–26) | – | 1.0 | 43, 44 |
| A0620–00 | 1.170.08, 2.4 (5 ,27) | 0.58 (V, 33) | 1.0 | 33, 45 |
| XTE J1118+480 | 0.053, 0.110.04 (6) | 0.55 (R, 34) | 1.0 | 6, 41–43, 46–49 |
| GRS 1124–68 | 0.90.1, 1.58 (5, 28) | 0.550.05 (B–V, 35) | – | 28, 50–52 |
| GS 1354–64 | 2.600.31, 37.2 (7, 29) | – | 1.0 | 43, 53 |
| 4U 1543–47 | 1.550.15, 4.30.2 (5) | 0.68 (R, 36) | 1.0 | 43, 54, 55 |
| XTE J1550–564 | 2.50.6, 8.72.1 (5) | 0.70.1 (V, 19) | 1.0 | 19, 56, 57 |
| GRO J1655–40 | 3.70.3, 6.660.57 (5, 20) | 1.0 (B–K, 37) | 1.0 | 20, 43, 58–60 |
| GX 339–4 | 3.90.5, 6.0 (5, 30) | 0.3 (B–K, 38) | 1.0 | 43, 60–64 |
| GRO J1719–24 | 2.80.6, 4.0 (9, 31, 32) | – | 0.5 | 41 |
| XTE J1720–318 | 6.90.1, 12.40.2 (10∗) | – | 1.0 | 43, 65 |
| XTE J1859+226 | 1.800.37, 82 (5) | 0.590.04 (R, 39) | 1.0 | 22, 39, 43, 66, 67 |
| GRS 1915+105 | 19.61.7, 353 (11) | – | 1.0 | 68 |
| V404 Cyg | 3.650.35, 6.980.76 (5, 27) | 0.870.03 (R, 40) | 0.5 | 69–71 |
Columns give: (I) source name; (II) interstellar reddening in -band, and interstellar HI absorption column ( is estimated here from the relation ; Predehl & Schmitt 1995); (III) the companion star OIR luminosity contribution in quiescence; (IV) The maximum time separation, , between the OIR and X-ray observations defined as quasi-simultaneous; (V) References for the quasi-simultaneous OIR and X-ray fluxes collected. References for tables 2 to 7 (continued): (41) Brocksopp et al. (2004); (42) Garcia et al. (2001); (43) RXTE ASM; (44) Brocksopp et al. (2001a); (45) Kuulkers (1998); (46) McClintock et al. (2003); (47) Kiziloglu et al. (2005); (48) Uemura et al. (2000); (49) Hynes et al. (2005); (50) King et al. (1996); (51) della Valle et al. (1998); (52) Sutaria et al. (2002); (53) Brocksopp et al. (2001b); (54) Buxton & Bailyn (2004); (55) Kalemci et al. (2005); (56) Hameury et al. (2003); (57) Jain et al. (2001b); (58) Markwardt et al. (2005); (59) Torres et al. (2005); (60) Chaty et al. (2002); (61) Corbel & Fender (2002); (62) Homan et al. (2005a); (63) Kuulkers et al. (2004); (64) Israel et al. (2004); (65) Nagata et al. (2003); (66) Tomsick et al. (2003a); (67) Haswell et al. (2000); (68) Fender & Pooley (2000); (69) Hynes et al. (2004); (70) Życki et al. (1999); (71) Han & Hjellming (1992); (72) Torres et al. (2007); (73) Brandt et al. (1992); (74) Galloway et al. (2002); (75) Rutledge et al. (2002); (76) Chevalier et al. (1989); (77) Kennea et al. (2006); (78) Wachter & Margon (1996); (79) in’t Zand et al. (2001); (continued over).
| Source name | Type | Distance | Period | / | / |
|---|---|---|---|---|---|
| = alternative name | / kpc (ref) | / hrs (ref) | (ref) | (ref) | |
| (I) | (II) | (III) | (IV) | (V) | (VI) |
| IGR J00291+5934 | MSXP | 2.81.0 (72) | 2.457 (85) | 1.4 (89) | 0.039–0.16 (89) |
| LMC X–2 = 4U 0520–72 | Z | 5010 (3, 4) | 8.16 (15) | (90) | (90) |
| 4U 0614+09 = V1055 Ori | Atoll | 3.0 (73) | 0.25–0.33 | 1.4 (91) | 1.9 (91) |
| (86) | (1.45) | ||||
| XTE J0929–314 | MSXP | (74) | 0.726 (15) | – | (74) |
| = INTREF 390 | (83) | ||||
| CXOU 132619.7–472910.8 | ? | 5.00.5 (75) | – | – | – |
| Cen X–4 = V822 Cen | Atoll | 1.20.3 (76) | 15.1 (87) | 1.30.8 (15) | 0.310.27 (96) |
| Cir X–1 = BR Cir | Z | 9.21.4 (5) | 398 (5) | – | 41 (97) |
| 4U 1608–52 = QX Nor | Atoll | 3.30.5 (5) | 12.9 (5) | 1.4 (92) | 0.32 (92) |
| Sco X–1 = V818 Sco | Z | 2.80.3 (5) | 18.9 (5) | 1.4 (93) | 0.42 (93) |
| XTE J1701–462 | Z | 8.58.0 (77) | – | – | – |
| GX 349+2 = Sco X–2 | Z | 9.250.75 (78) | – | – | – |
| SAX J1808.4–3658 | MSXP | 2.50.1 (79) | 2.0 (5) | 1.7 (94) | 0.05–0.10 (98) |
| = XTE J1808–369 | (1.7) | ||||
| XTE J1814–338 | MSXP | 8.01.6 (80) | 4.27 (5) | – | (99) |
| GX 13+1 = 4U 1811–17 | Z | 71 (81) | – | – | – |
| GX 17+2 = 4U 1813–14 | Z | 8.02.4 (82) | – | – | – |
| HETE J1900.1–2455 | MSXP | 51 (83, 84) | 1.39 (88) | – | 0.016–0.07 (88) |
| Aql X–1 = V1333 Aql | Atoll | 5.150.75 (5) | 19.0 (5) | 1.4 (95) | 0.6 (95) |
| XTE J2123–058 = LZ Aqr | Atoll | 18.42.7 (5) | 5.96 (5) | 1.3 (15) | 0.60 (15) |
| Cyg X–2 = V1341 Cyg | Z | 13.42.0 (5) | 236.2 (5) | 1.78 (15) | 0.60 (15) |
Columns give: (I) source names; (II) X-ray classification (Z = Z-source); (III) distance estimate; (IV) orbital period of the system; (V) mass of the neutron star in solar units (assumed to be if unconstrained); (VI) mass of the companion star in solar units. References for tables 2 to 7 (continued): (80) Strohmayer et al. (2003); (81) Bandyopadhyay et al. (1999); (82) Kuulkers et al. (2002); (83) Kawai & Suzuki (2005); (84) Galloway et al. (2005b); (85) Shaw et al. (2005); (86) Nelemans et al. (2004); (87) Campana et al. (2004a); (88) Kaaret et al. (2006); (89) Galloway et al. (2005a); (90) Crampton et al. (1990); (91) van Straaten et al. (2000); (92) Wachter et al. (2002); (93) Steeghs & Casares (2002); (94) Campana et al. (2002); (95) Welsh et al. (2000); (96) Torres et al. (2002); (97) Johnston et al. (1999); (98) Wang et al. (2001); (99) Krauss et al. (2005); (100) Bonnet-Bidaud et al. (1989); (continued over).
| Source | , / 10 | / | Fluxes – data | |
|---|---|---|---|---|
| (refs) | (band, ref) | days | references | |
| (I) | (II) | (III) | (IV) | (V) |
| IGR J00291+5934 | 2.50.3, 4.640.58 (72) | – | 1.0 | 72, 125 |
| LMC X–2 | 0.15, 0.910.07 (100, 101) | – | 0.5 | 43, 100, 126 |
| 4U 0614+09 | 1.410.17, 2.990.01 (86, 101) | – | 0.5 | 126, 127 |
| XTE J0929–314 | 0.420.10, 0.760.24 (102, 103) | – | 1.0 | 43, 102 |
| CXOU 132619.7 | 0.340.03, 0.90.1 (75, 104) | 0.80.1 (B, 88) | – | 75, 104 |
| Cen X–4 | 0.310.16, 0.550.16 (105, 106) | 0.750.05 (R), | 0.5 | 87, 121, |
| 0.700.05 (V,94) | 128–130 | |||
| Cir X–1 | 10.51.5, 193 (107) | – | 0.2 | 43, 131–133 |
| 4U 1608–52 | 4.65, 155 (14, 92, 108) | – | 1.0 | 43, 92, 134, 135 |
| Sco X–1 | 0.700.23, 1.250.41 (14†) | – | 1.0 | 43, 136 |
| XTE J1701–462 | 94, 95 (77, 109)∗ | – | 0.5 | 43, 137 |
| GX 349+2 | 51, 7.71.0 (78, 110) | – | 1.0 | 43, 78, 126 |
| SAX J1808.4–3658 | 0.68, 0.110.03 (98, 111) | 0 (V–I, 122) | 1.0 | 43, 98, 138–142 |
| XTE J1814–338 | 0.710.10, 1.630.21 (99) | – | 1.0 | 43, 99 |
| GX 13+1 | 15.32.3, – (112) | – | 1.0 | 112 |
| GX 17+2 | 12.51.5, 152 (113, 114) | – | 1.0 | 43, 143 |
| HETE J1900.1 | 0.890.22, 1.60.4 (115)∗ | – | 2.0 | 43, 115, 144,145 |
| Aql X–1 | 1.550.31, 4.0 (116, 117) | – | 0.5 | 43, 146–153 |
| XTE J2123–058 | 0.370.15, 0.660.27 (118)† | 0.77 (R, 123,124) | – | 124, 154 |
| Cyg X–2 | 1.240.22, 1.90.5 (119, 120) | – | 1.0 | 155, 156 |
Columns give: (I) source name; (II) interstellar reddening in -band, and interstellar HI absorption column ( and are estimated here from the relation ; Predehl & Schmitt 1995); (III) the companion star OIR luminosity contribution in quiescence; (IV) The maximum time separation, , between the OIR and X-ray observations defined as quasi-simultaneous; (V) References for the quasi-simultaneous OIR and X-ray fluxes collected. References for tables 2 to 7 (continued): (101) Schulz (1999); (102) Giles et al. (2005); (103) Juett et al. (2003); (104) Haggard et al. (2004); (105) Blair et al. (1984); (106) Rutledge et al. (2001); (107) Jonker et al. (2007); (108) Grindlay & Liller (1978); (109) Produit et al. (2006); (110) Iaria et al. (2004); (111) Campana et al. (2005); (112) Charles & Naylor (1992); (113) Deutsch et al. (1999); (114) Vrtilek et al. (1991a); (115) Steeghs et al. (2005b); (116) Chevalier et al. (1999); (117) Campana & Stella (2003); (continued over).
| Source name | Type | Distance | , / 10 |
|---|---|---|---|
| = alternative name | / kpc (ref) | (refs) | |
| (I) | (II) | (III) | (IV) |
| SMC X–3 | NS | 58.15.6 (157) | 1.50.7, 2.91.4 (164) |
| CI Cam = XTE J0421+560 | unknown | 5 (158) | 3.21.2, 52 (165, 168) |
| LMC X–4 | NS | 5010 (3, 4) | 0.310.06, 0.550.10 (166)∗ |
| A0535+26 = HDE 245770 | NS | 2 (159) | 2.30.5, 11.81.5 (159, 169) |
| GX 301–2 = 4U 1223–62 | NS | 5.30.1 (160) | 5.90.6, 2010 (160, 170) |
| V4641 Sgr = SAX 1819.3–2525 | BH | 9.62.4 (5) | 1.00.3, 2.30.1 (5, 171) |
| KS 1947+300 = GRO J1948+32 | NS | 102 (161) | 3.380.16, 3430 (161) |
| Cyg X–1 = HD 226868 | BH | 2.10.1 (162) | 2.950.21, 6.210.22 (167, 172) |
| Cyg X–3 = V1521 Cyg | unknown | 10.32.3 (163) | 205, 851 (163, 173) |
Columns give: (I) source names; (II) Compact object (BH = black hole, NS = neutron star); (III) distance estimate; (IV) interstellar reddening in -band, and interstellar HI absorption column ( is estimated here from the relation ; Predehl & Schmitt 1995); References for tables 2 to 7 (continued): (118) Hynes et al. (2001); (119) McClintock et al. (1984); (120) Costantini et al. (2005); (121) Shahbaz et al. (1993); (122) Burderi et al. (2003); (123) Casares et al. (2002); (124) Shahbaz et al. (2003b); (125) Steeghs et al. (2004); (126) Paper IV; (127) Machin et al. (1990); (128) Kaluzienski et al. (1980); (129) Canizares et al. (1980); (130) van Paradijs et al. (1980); (131) Shirey (1998); (132) Glass (1978); (133) Moneti (1992); (134) Corbel et al. (1998); (135) Wachter (1997); (136) McNamara et al. (2003); (137) Maitra & Bailyn (2006); (138) Campana & Stella (2004); (139) Homer et al. (2001); (140) Gilfanov et al. (1998); (141) Campana et al. (2004b); (142) Greenhill et al. (2006); (143) Callanan et al. (2002); (144) Fox (2005); (145) Steeghs et al. (2005a); (146) Charles et al. (1980); (147) Jain et al. (1999); (148) Jain et al. (2000); (149) Maitra et al. (2003); (150) Maitra et al. (2004a); (151) Maitra et al. (2004b); (152) Maitra & Bailyn (2005); (153) Bailyn et al. (2006); (154) Tomsick et al. (2004); (155) Hasinger et al. (1990); (156) van Paradijs et al. (1990); (157) Cole (1998); (158) Mioduszewski & Rupen (2004); (159) Steele et al. (1998); (160) Kaper et al. (1995); (161) Negueruela et al. (2003); (162) Massey et al. (1995); (163) van Kerkwijk et al. (1996); (164) Lequeux et al. (1992); (165) Hynes et al. (2002b); (166) Naik & Paul (2003); (167) Wu et al. (1982); (168) Orlandini et al. (2000); (169) Orlandini et al. (2004); (170) Mukherjee & Paul (2004); (171) Dickey & Lockman (1990); (172) Schulz et al. (2002); (173) Stark & Saia (2003); (174) Clark et al. (1978); (175) Cowley & Schmidtke (2004); (176) Clark et al. (2000); (177) Heemskerk & van Paradijs (1989); (178) Kato et al. (1999); (179) Buxton et al. (2005b); (180) Bochkarev & Lyutyi (1998); (181) Brocksopp et al. (1999b); (182) Brocksopp et al. (1999a); (183) Koch-Miramond et al. (2002).
| Source | / days | Fluxes - data references |
| (I) | (II) | (III) |
| SMC X–3 | – | 174, 175 |
| CI Cam | 1.0 | 43,168, 176 |
| LMC X–4 | – | 43, 177 |
| A0535+26 | 1.0 | 169 |
| GX 301–2 | – | 160, 170 |
| V4641 Sgr | 0.2 | 43, 178, 179 |
| KS 1947+300 | 1.0 | 43, 161 |
| Cyg X–1 | 1.0 | 43, 180–182 |
| Cyg X–3 | 1.0 | 43, 183 |
Columns give: (I) source name; (II) The maximum time separation, t, between the OIR and X-ray observations defined as quasi-simultaneous; (III) References for the quasi-simultaneous OIR and X-ray fluxes collected.
2.2.2 Luminosity Calculation
The X-ray unabsorbed 2–10 keV flux was calculated for all X-ray data333This energy range was adopted to be consistent with that used for the radio–X-ray correlations of Gallo et al. (2003; 2–11 keV) and Migliari & Fender (2005; 2–10 keV).. I made note of the X-ray state of each BHXB on each observation, as defined by the analysis by authors in the literature. I was unable to apply strict definitions to the spectral states due to the differing nature (e.g. X-ray energy ranges and variability analysis) of each data set. I have therefore used the judgement of the authors to determine the spectral states; a method likely to be much more accurate than any conditions that could be imposed by us. A power-law with a spectral index 0.6 (photon index ) where is assumed when the source is in the hard state (and for all NSXBs), and a blackbody at a temperature of 1 keV for soft state data. These models for the X-ray spectrum are the same as those adopted by Gallo et al. (2003), and altering the values in the models to other reasonable approximations does not significantly change the estimated X-ray luminosities. For the BHXB GRS 1915+105 I use data from the radio-bright plateau state, which is approximately analogous to the hard state (e.g. Fender & Pooley, 2000). The NASA tool Web-PIMMS was used to convert from instrument X-ray counts per unit time (e.g. day-averaged ASM counts s-1). Brocksopp et al. (2004) also provide a table of approximate instrument counts–flux conversion factors used in this work.
For the OIR luminosities (or monochromatic luminosities; ), data were collected from the optical -band at 440 to the NIR -band at 2220 . OIR absorbed fluxes were de-reddened using the best-known value of the extinction to each source and the dependence of extinction with wavelength given by Cardelli, Clayton & Mathis (1989). For OIR data at fluxes low enough for the companion star to significantly contribute (i.e. for most low-mass XBs), the data were discarded if the fractional contribution of the companion had not been estimated in the OIR band of the data (adopting the quoted contributions given in the papers from which the data were acquired). The wavelength-dependent fractional contribution of the companion (column 3 of Tables 3 and 5) was subtracted from the low-flux OIR data in order to acquire the flux from all other emission processes in the system. This contribution is not well constrained in many cases due to the uncertain spectral type of the companion star (e.g. Haswell et al., 2002). For the Z-sources, OIR data were only included when the OIR fluxes were significantly higher than the lowest measured for each source in each waveband, to ensure minimal contamination from the companion (which has an unknown contribution in nearly all Z-sources). We have therefore propagated the errors associated with this into the errors of the OIR luminosities for all quiescent data. In sources for which the companion is comparatively bright (e.g. GRO J1655–40; Hynes et al., 1998), its contribution has been subtracted in outburst in addition to quiescence. For The HMXBs, which are expected to be dominated by the massive companion, the light of the companion was not subtracted.
The intrinsic (de-reddened) OIR and X-ray luminosities were then calculated given the best-known estimate of the distance to each source (Tables 2, 4 and 6). I adopted the approximation to estimate the OIR luminosity (we are approximating the spectral range of each filter to the central wavelength of its waveband). The errors associated with the luminosities are propagated from the errors quoted in the original data. Where no errors are quoted, I apply a conservative error of 30%. Errors associated with estimates of the distance, extinction and NI absorption column were sought (Tables 2–6). Where these limits are not directly quoted in the reference, I used the most conservative estimates implied from the text. These errors were not propagated into the errors associated with the derived luminosities because the resulting plots would be dominated by error bars, however one error bar for each data set is shown, representing the average total systematic 1 errors associated with each luminosity data point.
For the NSXBs, a wealth of OIR data were collected which had two or more quasi-simultaneous OIR wavebands. In these cases it was possible to calculate the spectral slope of the OIR continuum. For some NSXBs however, OIR–X-ray quasi-simultaneity was achieved but there was only one OIR waveband available so OIR colours were not obtained in this way for these sources. In addition to the data collected from the literature, we obtained OIR photometry of three NSXBs using two telescopes; the observations and data reduction are discussed in the following subsections.
2.2.3 Observations with the Danish 1.54-m Telescope
-band imaging of two Z-sources, GX 349+2 and LMC X–2, were taken in July 2001 using the camera on the Danish Faint Object Spectrograph and Camera (DFOSC). Table 8 lists the observations used in this work. De-biasing and flat fielding was performed with IRAF and aperture photometry of the targets and the standard star LTT 7987 ( = 12.23 mag; = 12.29; = 12.37; = 12.50; Hamuy et al. 1992; 1994) was achieved using PHOTOM. GX 349+2 was detected with a significance of in all exposures (most were detections). For LMC X–2 I aligned and combined the six exposures in each filter on MJD 52115 to achieve a higher signal-to-noise ratio (S/N). No combined images were created from the observations of this source on MJD 52117 as the S/N was sufficiently high for photometry. LMC X–2 was detected at a significance level of in the -band images and in all other images used in this work. In Fig. 12 I present the finder charts for LMC X–2.
The measured fluxes were accounted for airmass-dependent atmospheric extinction (the atmosphere absorbs and scatters some optical light; e.g. Hayes & Latham, 1975; Dahlgren et al., 2006) according to Burki et al. (1995). I flux-calibrated the data using LTT 7987. For GX 349+2 the flux was measured of three stars in the field of view with known and -band magnitudes (stars 2, 5 and 7 listed in Wachter & Margon, 1996). Their magnitudes differ from those previously reported by mag. The resulting fluxes obtained for GX 349+2 and LMC X–2 were de-reddened to account for interstellar extinction using the values of listed in Table 5.
| MJD | Target | Expo- | Integration time | Apparent magnitudes | ||||||
|---|---|---|---|---|---|---|---|---|---|---|
| sures | / exp. | (not de-reddened) | ||||||||
| /filter | V | R | i | z | V | R | i | z | ||
| 52114.2 | GX 349+2 | 9 | 300 | 200 | 120 | 120 | 18.54(8) | 17.53(9) | 16.59(5) | 16.14(10) |
| 52115.0 | GX 349+2 | 4 | 300 | 200 | 120 | 120 | 18.44(12) | 17.44(9) | 16.52(5) | 16.12(5) |
| 52115.3 | LTT 7987 | 1 | 2 | 2 | 4 | 6 | ||||
| 52115.4 | LMC X–2 | 6 | 120 | 120 | 180 | 240 | 19.19(7) | 19.01(7) | 18.91(7) | 19.12(14) |
| 52117.4 | LMC X–2 | 2 | 120 | 120 | 180 | 300 | 18.47(7) | 18.43(7) | 18.45(8) | 18.57(26) |
MJD 52114.0 corresponds to 2001-07-24.0 UT. The filters used were Bessel , Bessel , Gunn and Gunn . LTT 7987 is the standard star used for flux calibration. For GX 349+2 the range of magnitudes measured are tabulated, whereas for LMC X–2 I tabulate the magnitudes from the combined images.
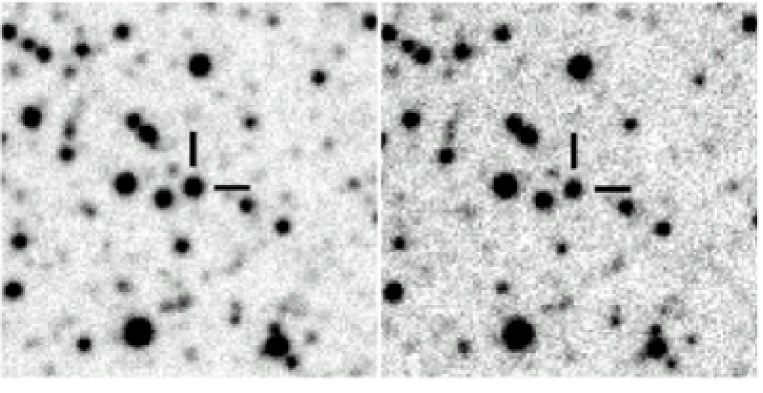
2.2.4 UKIRT Observations of 4U 0614+09
NIR imaging of 4U 0614+09 was obtained with the 3.8 m United Kingdom Infrared Telescope (UKIRT) on 2002 February 14 (MJD 52319.3), using UFTI, the UKIRT Fast Track Imager (Roche et al., 2003). Jittered observations of 4U 0614+09 were made in the , and filters, with 930 s exposures in both and , and 960 s exposures in . The infrared standard star FS 120 ( = 11.335 mag; = 10.852; = 10.612) was also observed for a total of 50 s, 25 s and 25 s in , and , respectively. The airmass of the standard and 4U 0614+09 were very similar: 1.004–1.036. The ‘JITTER-SELF-FLAT’ data reduction recipe was used, which created a flat field from the sequence of 9 jittered object frames and a dark frame. After dark subtraction and flat fielding, a mosaic was generated from the 9 object frames.
Photometry was carried out using IRAF. 4U 0614+09 was detected with a significance of 7.1 in , 15.3 in and 11.5 in . Flux calibration was achieved using FS 120, yielding the following de-reddened () flux densities for 4U 0614+09: mJy; mJy; mJy (the apparent reddened magnitudes are ; ; ).
2.3 Results
Quasi-simultaneous OIR and X-ray luminosities are plotted of 15 BHXBs in the hard state (Figs. 13 and 14), 9 BHXBs in the soft state (Figs. 15 and 16), 18 NSXBs (Figs. 17–19) and 9 HMXBs (Fig. 20). We have classed LMC X–3 as a low-mass XB (BHXB) because Brocksopp et al. (2001a) found from 6 years of observations on this source that its optical emission is dominated by long-term variations rather than the bright companion star in the system, due to its persistent nature (and we are using data from their paper).
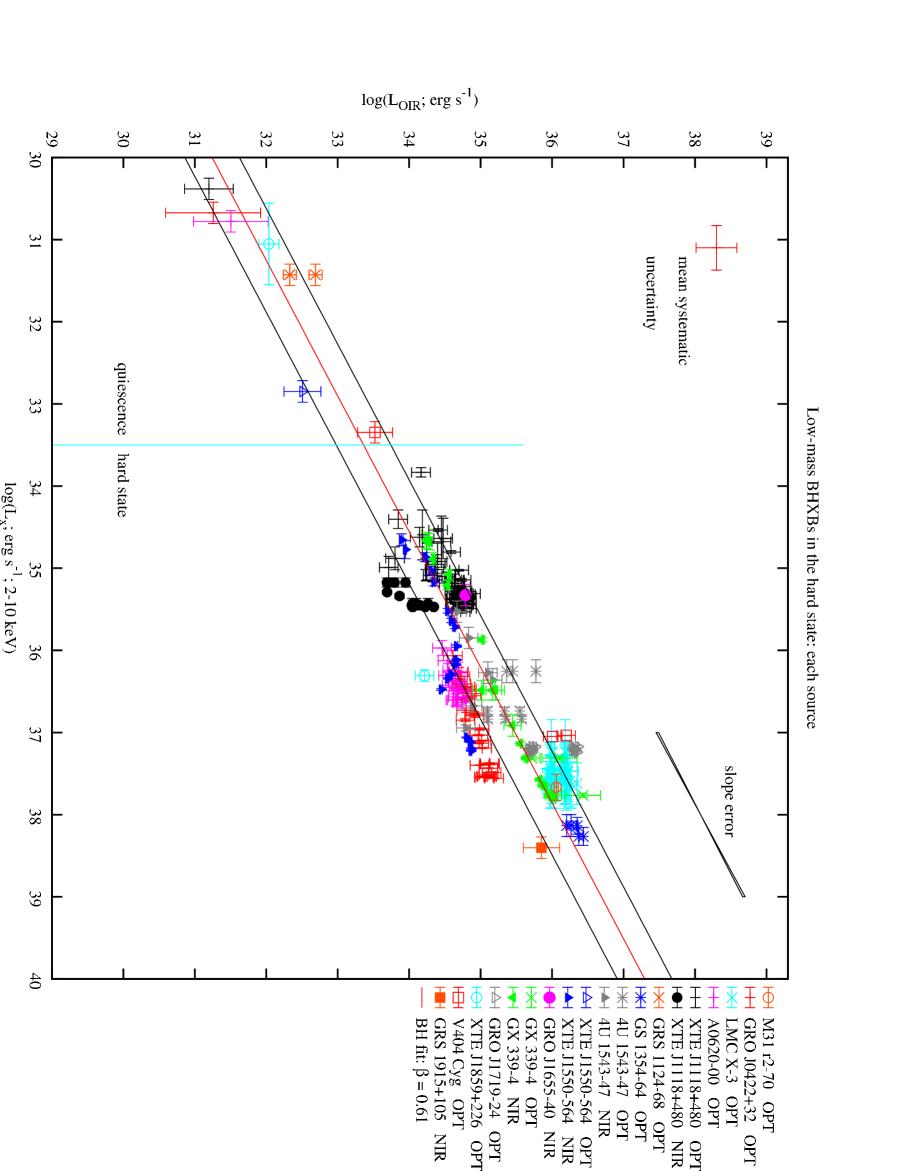
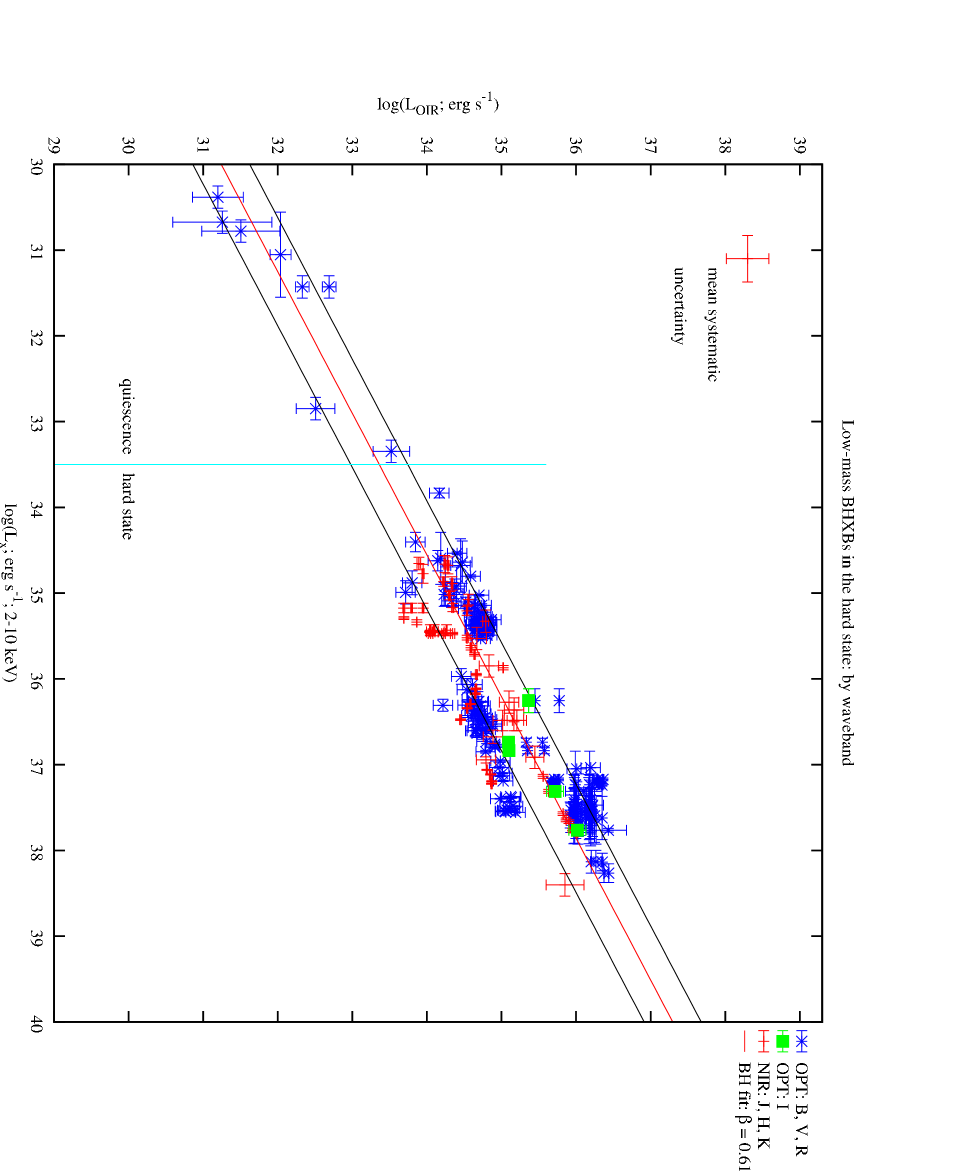
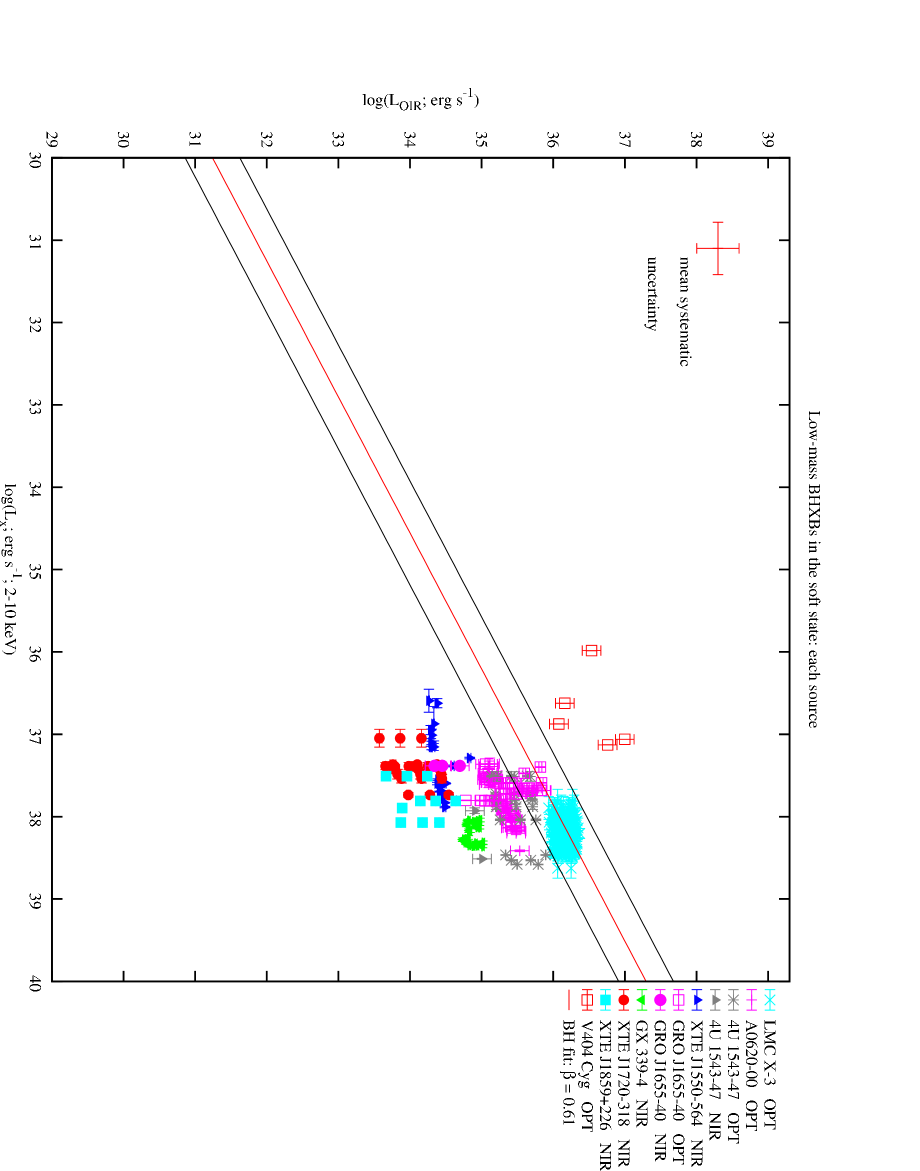
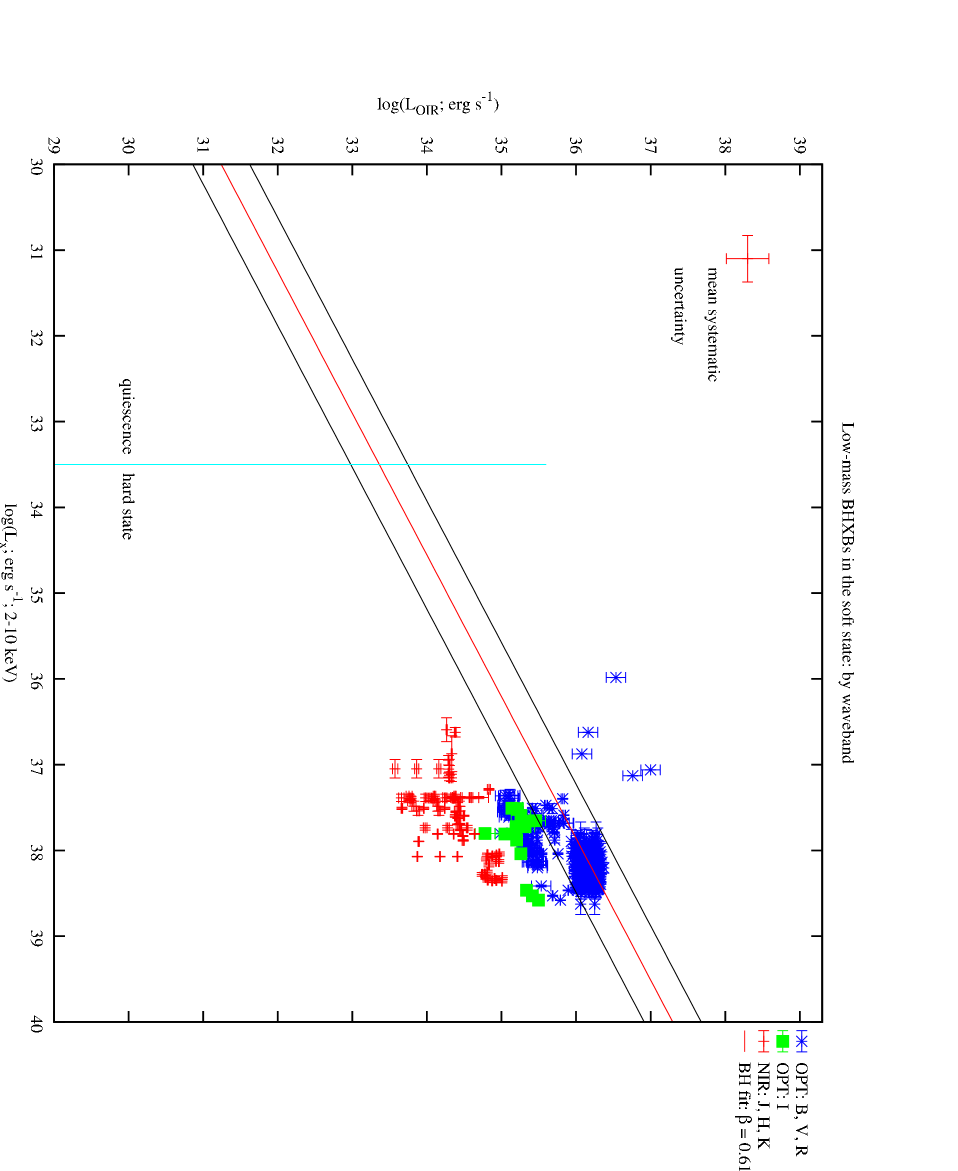
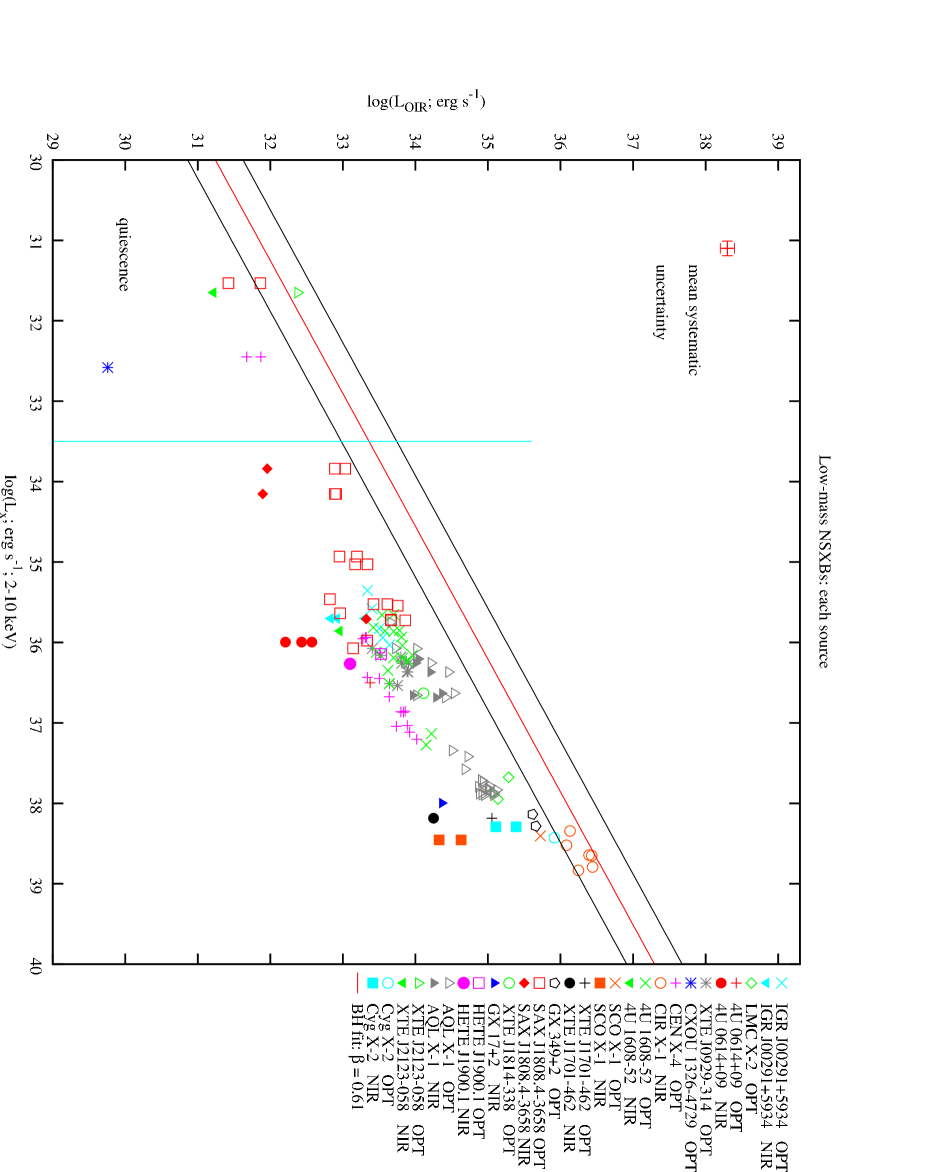
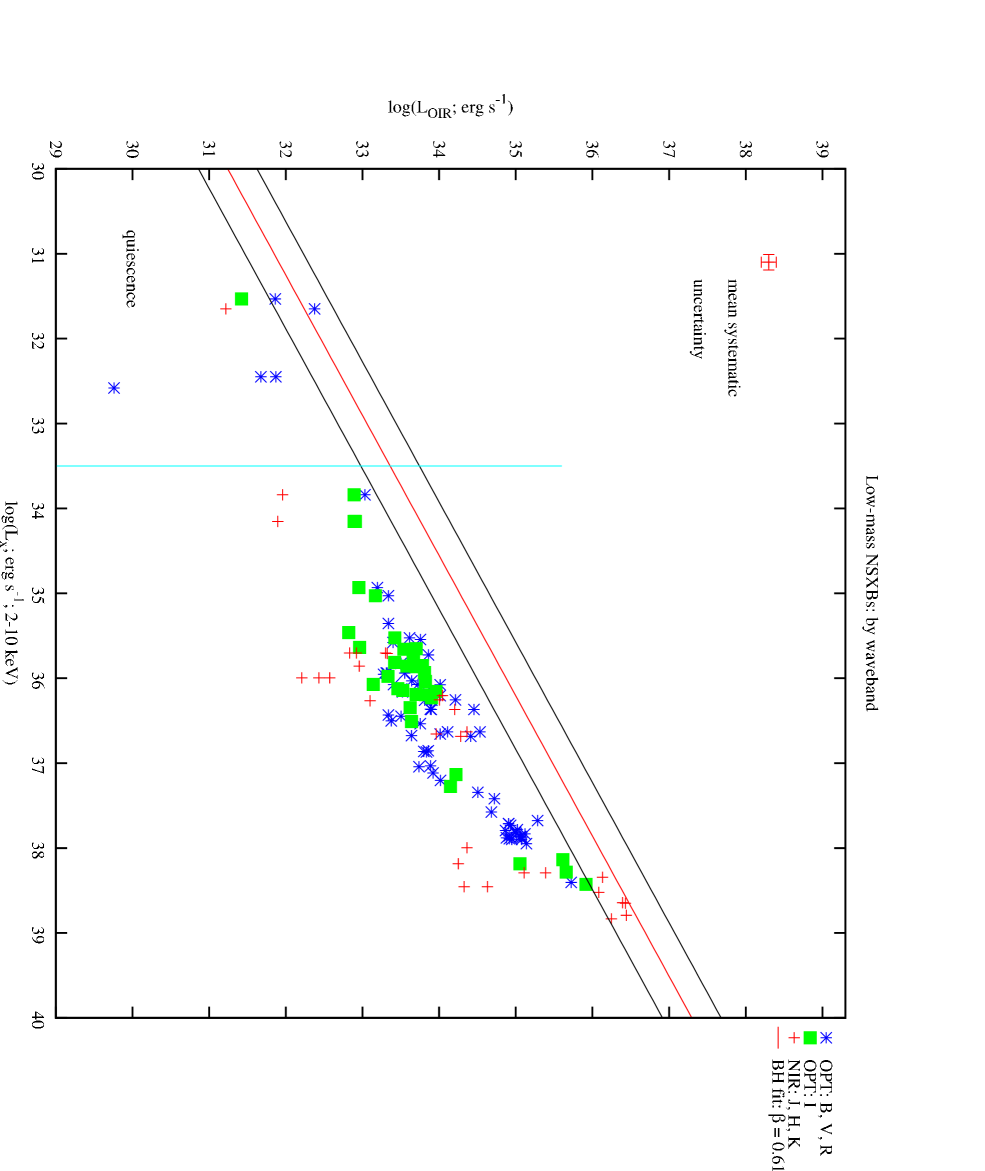
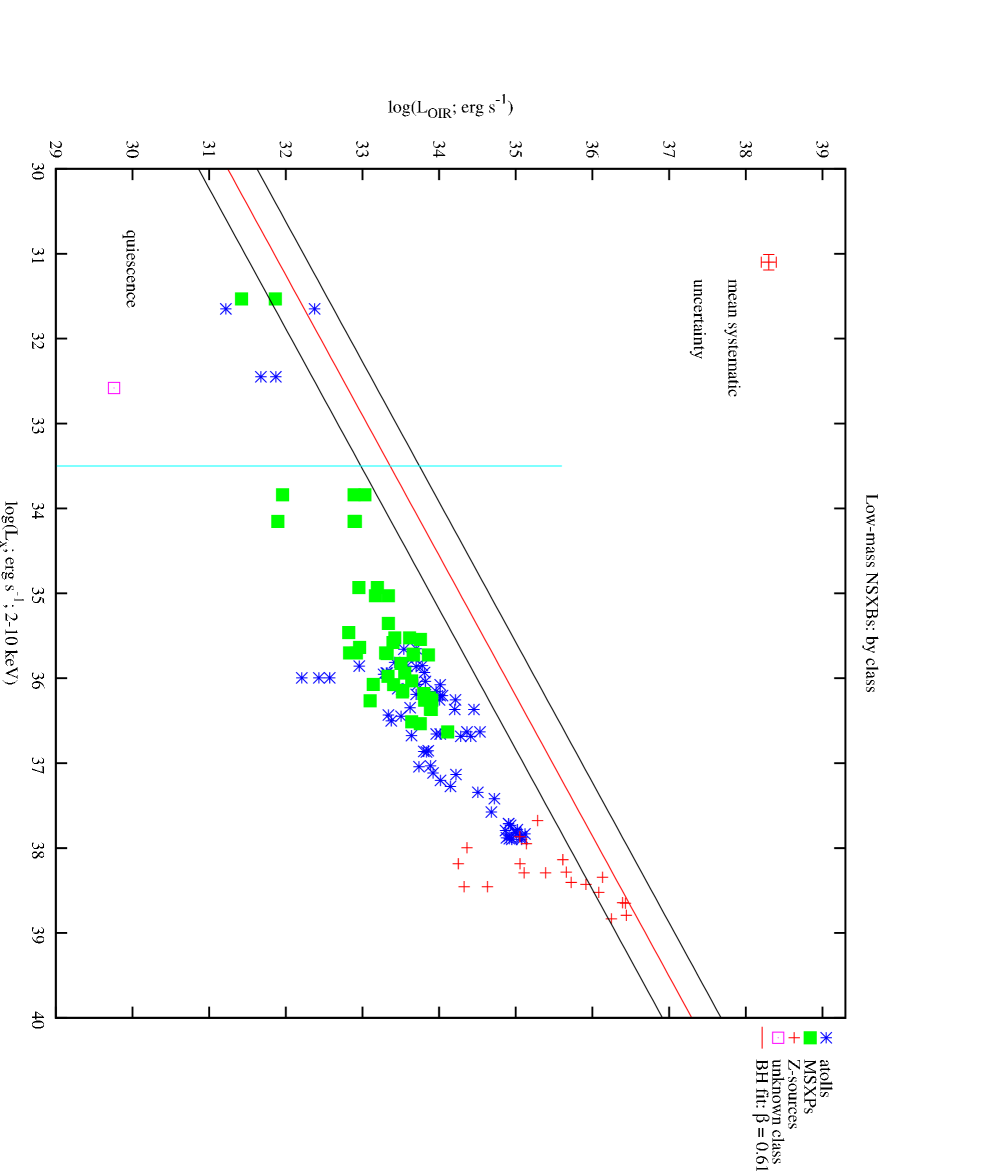
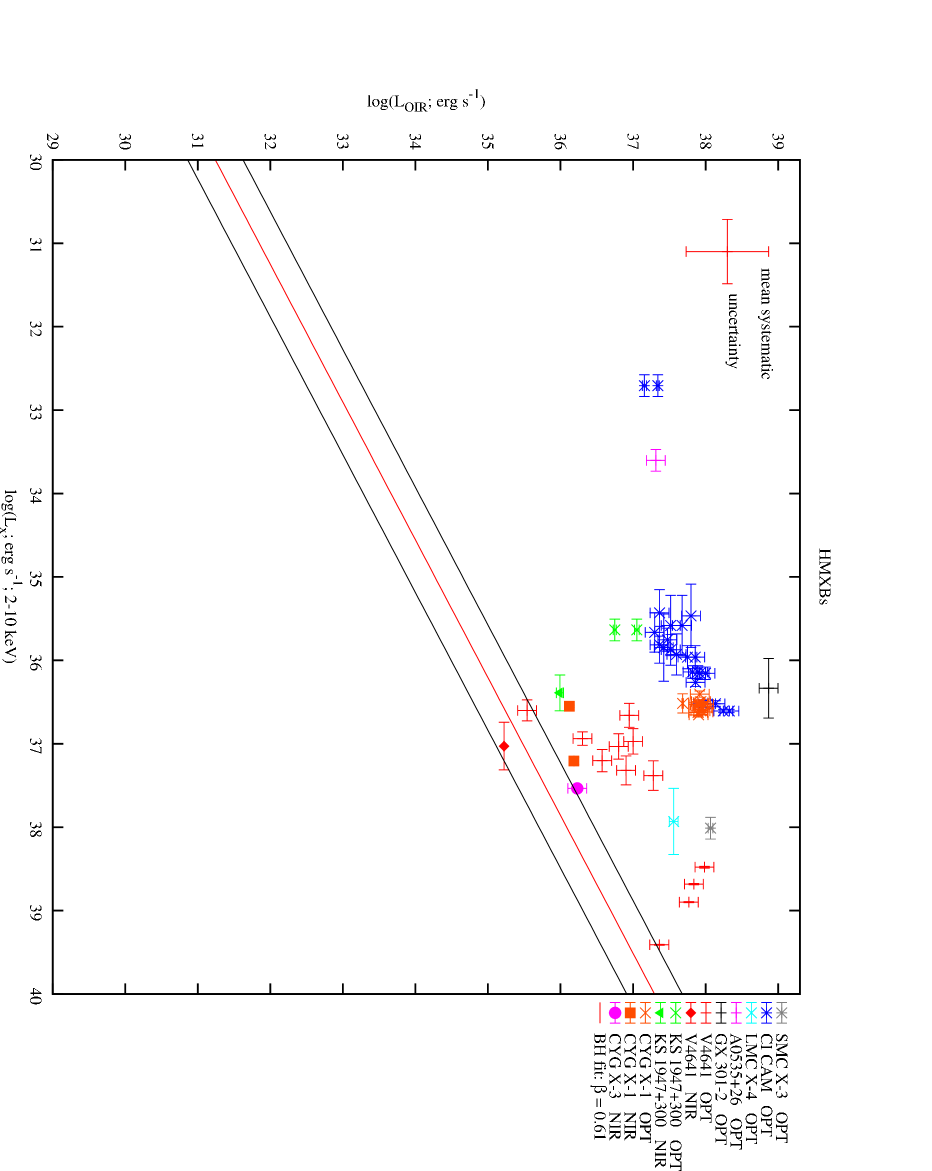
For BHXBs in the hard state, a strong – correlation exists over 8 orders of magnitude in X-ray luminosity. The slope of the global correlation is =0.6050.018, where (I do not take into account the and error bars in calculating ). The package gnuplot is used to calculate correlations; equal weighting is applied to each data point. The relations will be biased towards sources with more data points, but I argue that all data points are equally important because a maximum of one data point is used per day per waveband per source, and the sources tend to vary on timescales days. The data from all 15 individual sources lie close to this correlation but deviations in the slopes and normalisations of individual sources are present. For example, there is a strong correlation for the outburst of GRO J0422+32 but its slope is shallower; =0.33 (however including the quiescent point, =0.54) and for XTE J1118+480, =0.58 from the optical data (including quiescence) whereas =1.36 for the NIR data (although this does not cover much range in luminosity and does not include any quiescent data). There are no obvious differences in the correlation for optical data compared to NIR data (Fig. 14).
In the soft state, the optical data (-bands) lie close to the hard state correlation for BHXBs (Fig. 16), and the NIR data (-bands) lie below the correlation. For the NSXBs (Fig. 17), an OIR–X-ray correlation is also found but it is not a single power-law; appears to be larger at high compared with at low . The upturn (steeper slope) is dominated by the Z-sources and the shallower slope is dominated by the MSXPs below erg s-1 (there is little data of atolls below this luminosity except in quiescence; Fig. 19). In addition most of the NSXB data lie below the BHXB data, i.e. at a given , the OIR luminosity of the BHXBs in the hard state is around an order of magnitude or so higher than that of a NSXB. As with the hard state BHXB correlation, there is no strong relation between slope/normalisation and waveband (Fig. 18).
If we neglect the data from sources in quiescence ( erg s-1), the BHXB hard state fit is . This is very similar to the fit with quiescent data included. The similarity of the fits strengthens the case for the quiescent state being an extension to the hard state. For the analysis in the following subsections, we use the fits with quiescent data included, as they are similar enough either way. In addition, it is also interesting that the fit to the BHXB quiescent data alone has a slope .
From Fig. 20 it is clear that the OIR luminosity of HMXBs is typically orders of magnitude larger than that of LMXBs, and does not appear to correlate with . This is consistent with the high-mass companion star dominating the OIR emission. The large range in OIR luminosities between sources is likely to be due to the differing masses and spectral types of the companions. Since this interpretation agrees with the evidence in the literature, I will not discuss the HMXBs in further detail (although they are mentioned in Section 2.5.3).
There are clear advantages and disadvantages of these OIR–X-ray compilations compared to the – approach of Gallo et al. (2003) and Migliari & Fender (2006). The hard state OIR–X-ray correlation in BHXBs includes data from many sources in low-luminosity quiescent states (7 sources with erg s-1), which was not possible for the radio–X-ray correlation due to radio detector limits (see Section 1.2.1; although this has recently been achieved with long radio integration times; Gallo et al., 2006). The OIR samples also include sources in the LMC and M31, which are too distant (and hence faint) to observe at radio wavelengths. However, unlike the radio–X-ray comparisons, HMXBs cannot be included in these OIR–X-ray plots as the OIR emission is dominated by the companion. In addition, two BHXBs (for example) situated in the galactic plane (1E 1740.7–2942 and GRS 1758–258) were included in the radio–X-ray correlation but are not observable at OIR wavelengths due to the high levels of extinction towards the sources.
In Section 2.4 we attempt to interpret the relations found between OIR and X-ray luminosities in terms of the most likely dominant emission processes. In Section 2.5 we discuss additional patterns, applications and implications of the empirical relations. The results and interpretations are summarised in Section 2.6.
2.4 Interpretation & Discussion
2.4.1 Jet Suppression in the Soft State in BHXBs
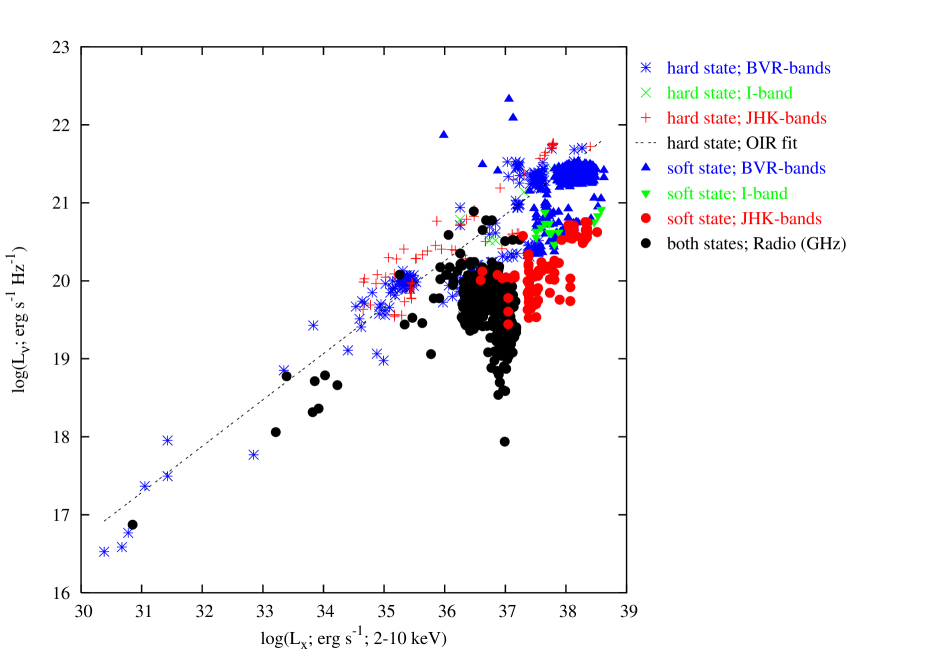
The significant drop in some of the OIR data in the soft state for BHXBs compared to the hard state (Figs. 15 and 16) is not due to changes in the X-ray luminosity during state transition because although the X-ray spectrum significantly changes during transition, the bolometric (and 2–10 keV) X-ray luminosity does not (e.g. Zhang et al., 1997; Körding, Fender & Migliari, 2006). The jet component at radio wavelengths is known to decrease/increase in transition to/from the soft X-ray state, due to the quenching of the jets in the soft state (e.g. Gallo et al., 2003). In Fig. 21, the OIR data from BHXBs are split into three wavebands: -bands, -band and -bands (as in Figs. 14 and 16), the monochromatic OIR luminosity (; i.e. flux density scaled for distance) is plotted against , overplotted with the radio data – for BHXBs from Gallo et al. (2003; 2006). It is clear that the normalisations in (as well as the power-law slopes) for the radio–X-ray and OIR–X-ray hard state correlations are similar to one another for BHXBs: at a given , the radio and OIR monochromatic luminosities are equal, implying a flat spectrum from radio to OIR wavelengths for all BHXBs in the hard state. I return to the hard state interpretation in Section 2.4.2.
Fig. 21 also shows a clear suppression of all the data, and a little, if any of the in the soft state. The -band data appear to sit in the centre of the two groups. All 9 BHXBs with soft state data are consistent with this behaviour, suggesting it is ubiquitous in BHXBs. We interpret this as the NIR wavebands being quenched as the jet is switched off, as is observed at radio wavelengths. According to this plot, the NIR appears to be quenched at a higher X-ray luminosity than the radio, but this effect is due to an upper limit adopted by Gallo et al. (2003) when compiling their radio–X-ray data.
The optical wavebands in the soft state lie close to the OIR hard state correlation. Most of the optical data lie below the centre of the hard state correlation, with the exception of V404 Cyg, whose optical luminosity is enhanced in the soft state. There is still a debate as to whether V404 Cyg entered the soft state, and the data here were taken close to the supposed state transition. The -band appears to be the “pivot” point, as already shown by Corbel & Fender (2002) and Homan et al. (2005a) to be where the continuum of the optically thin jet meets that of (possibly) the disc. The NIR quenching in the soft state implies that this waveband is dominated by the jets in luminous hard states, just before/after transition to/from the soft state. The optical data are not quenched, suggesting a different process is dominating at these wavelengths.
An alternative interpretation could be that the disc dominates the OIR in both the hard and soft states, but changes temperature during state transition, shifting the blackbody from (e.g.) the OIR in the hard state, to the optical–UV in the soft state. This would have the effect of reducing the NIR in the soft state but maintaining the optical, as is observed. We argue that this is not the case because there is evidence in many BHXBs for two spectral components of OIR emission, the redder of which is quenched in the soft state (Chapter 3; Jain et al., 2001b; Buxton & Bailyn, 2004; Homan et al., 2005a).
The jets should contribute negligible OIR flux in the soft state, so the OIR contribution of the jets at high luminosity in the hard state can be estimated from the level of soft state quenching. The mean offset of the OIR soft state data from the hard state fit is 0.300.32 dex, 0.710.21 dex and 1.100.26 dex in for the , and -bands, respectively. This corresponds to a respective fractional jet component of 50, 81 and 925 percent in the , and -bands. It is clear that the spectrum of the jet extends, with spectral index , from the radio regime to the NIR in BHXBs. The position of the turnover from optically thick to optically thin emission must be close to the NIR waveband for the radio–NIR spectrum to appear flat (unless the optically thick spectrum is highly inverted, which is not seen in the radio spectrum most of the time; see e.g. Fender, 2001). The OIR spectrum in the hard state is flatter than in the soft state, as is expected if the jet component is present in the former and not in the latter; this is explored further in Chapter 3.
There are no clear OIR–X-ray relations in the soft state alone; the data do not span a large enough region in . In Chapter 4, OIR–X-ray relations in the soft state are observed in individual sources which indicate the viscously-heated disc dominates the soft state emission (see Chapter 4 for analysis and discussion).
2.4.2 Modelling OIR–X-ray Relations
We now attempt to interpret the empirical OIR–X-ray relations in terms the three most cited OIR emission processes: X-ray reprocessing in the disc, the viscously heated disc and jet emission. For X-ray reprocessing in the disc, we adopt the theoretical model between optical and X-ray luminosities of van Paradijs & McClintock (1994) but also take into account a dependency of the relation on system mass that was neglected by van Paradijs & McClintock, but is needed here to compare between NSXBs and BHXBs. From Kepler’s third law and equation 5 of van Paradijs & McClintock (and the discussion that follows), we have:
In the left panel of Fig. 22 we plot the monochromatic luminosity (optical and NIR) versus for each BHXB data point in the hard state (adopting the values of , and for each source from Table 2). In the upper panel of Fig. 23 the same is plotted for each NSXB data point, using the system parameters from Table 4. The solid line in these panels represents the power-law fit to the optical hard state BHXB data and optical NSXB data, respectively, fixing the slope at unity (). We see that the X-ray reprocessing model describes the slope of the data well for both types of source. We expect a lower normalisation for the NIR data due to the shape of the OIR spectrum, which may have a spectral index (a conservative range based on theoretical and empirical results of X-ray reprocessing; see e.g. Hynes, 2005). The upper and lower dotted lines indicate the expected correlations of the NIR data (approximating the optical to the -band centred at and the NIR to the -band at ) if and , respectively. However, the NIR data lie above these expected correlations for emission from X-ray reprocessing in both the BHXB and NSXB systems.
For NSXBs with observationally unconstrained neutron star masses, we assume . This is the approximate mass of all known neutron stars, although there are exceptions where the mass is likely to be up to (e.g. Campana et al., 2002; Cornelisse et al., 2007). We do not include data in Fig. 23 from systems in which the orbital period or the companion mass is unconstrained (see Table 4). We note that data from Cir X–1 in Fig. 23 (open circles in the top right corner of the figure) may not be representative because its orbit is eccentric and so the orbital separation cannot be accurately inferred using this method.

For the jets, we take the models described in Section 1.2.3 where the spectrum is flat (optically thick) from radio to OIR, and normalise them using the empirical – relations found by Gallo et al. (2003) and Migliari & Fender (2006) for BHXBs and NSXBs, respectively. In the right panel of Fig. 22 we plot versus for hard state BHXBs and in the upper panel of Fig. 24 the same is plotted for NSXBs. The same relation is expected between optical and NIR jet emission when plotting monochromatic luminosity because we are assuming the jet spectrum is flat; .
We find that the model for OIR emission from the jet in BHXBs can approximately describe the optical and NIR data of the BHXBs (the data are close to the solid line in the right panel of Fig. 22). The model for OIR emission from jets in NSXBs lies close to the NSXB data at high but cannot describe the data at low ( erg s-1; Fig. 24, upper panel). However, since all the optical NSXB data also lie close to the expected relation for X-ray reprocessing (Fig. 23, upper panel), X-ray reprocessing may be responsible for all the OIR emission instead of the jet. Only the data above erg s-1 could arise due to the presence of a jet (Fig. 24).

The Z-sources, which tend to have much longer orbital periods (and hence larger orbital separations) than atolls and MSXPs, dominate the highest X-ray luminosities. These sources spend most of their time in a soft X-ray state and in fact have radio luminosities lower than predicted by the NSXB hard state radio–X-ray relation if the radio emission originates in the jet (Migliari & Fender, 2006). We would therefore expect the OIR emission from the jets in Z-sources to also be lower than the jet model in Fig. 24 unless the radio–OIR jet spectrum is inverted (positive). In fact from Fig. 3 of Migliari & Fender (2006) we see that at erg s-1, erg s-1 and so from Fig. 24 here, the radio–OIR spectral index for Z-sources444At erg s-1 we can calculate the spectral index between radio and OIR for Z-sources since we know the radio and OIR luminosities. is . With this information alone, the jets can only dominate the OIR of Z-sources if the radio–OIR spectrum is inverted.

The models for OIR emission from a viscously heated disc are described as follows. For the simplest viscously heated steady-state disc, there are two limiting regimes (Frank et al., 2002). For , we expect ṁ1/4. This is simply the Rayleigh-Jeans limit and will only apply well into the IR. For , the relationship is steeper, ṁ2/3. For typical disc edge temperatures of 8,000–12,000 K, expected power-law slopes ( ṁγ), are calculated to vary from in the -band, to in , and in the UV. Using the calculations linking and ṁ in Section 1.2.3, this corresponds to expected correlations of the form , where 0.150.25 for BHXBs and 0.300.50 for NSXBs.
For the BHXBs, the viscous disc models clearly cannot describe the data; the correlation is too steep. Focusing on the NSXBs (Fig. 24, upper panel), we see that the model for emission from a viscously heated disc (which requires a relation for optical data and for NIR) can describe the optical data below erg s-1. Above this the OIR is more luminous than expected from this relation. The viscous disc model is not consistent with the NIR data. We can therefore rule out a viscous disc origin to the OIR emission, at least at erg s-1.
| Sample | Model | - | |||
|---|---|---|---|---|---|
| X-ray reprocessing model | |||||
| BHs; OPT | 0.5 | 0.550.03 | 0.050.03 | 9.30.4 | |
| BHs; NIR | 0.5 | 0.560.03 | 0.060.03 | 15.5–81.3† | |
| Viscous disc model | |||||
| BHs; OPT | 0.25 | 0.590.02 | 0.340.02 | – | |
| BHs; NIR | 0.17 | 0.610.04 | 0.440.04 | – | |
| Jet model | |||||
| BHs; OPT | 0.7 | 0.590.02 | 0.110.02 | 1.050.07 | |
| BHs; NIR | 0.7 | 0.610.04 | 0.090.04 | 1.780.16 | |
When measuring for a sample, (the normalisation) is also a free parameter (i.e. this is a fit to the data) whereas for measuring , is fixed at the value of the model , and is a free parameter (i.e. this is measuring the mean normalisation offset of the data from the model). ∗ for the X-ray reprocessing model, is defined by the fit to the optical NSXB data used in Paper I; † the range corresponds to an OIR spectral index .
A summary of the results of fitting these models to the observed BHXB data is provided in Table 9. There is no global power-law correlation found in NSXBs (the relation steepens at higher ) so we I do not include NSXBs in this table. The following Section (2.4.3) discusses the models for NSXBs with the additional information of how the optical and NIR spectral index changes with . It is clear that the slopes of the observed relations for BHXBs can be explained by the X-ray reprocessing model or the jet model, but not by the viscous disc model (Homan et al. 2005 also ruled out a viscous disc origin to the OIR emission in the hard state of GX 339–4 because the mass accretion rate inferred from the luminosity is much higher than expected).
The normalisation of the BHXB data is closer to the jet model than the reprocessing model. Although this is consistent with the constraints derived from Section 2.4.1 (the jets are contributing percent of the NIR luminosity here), an optical excess of 1 order of magnitude (compared to NSXBs) from the reprocessing model is not expected. The excess is unlikely to be fully explained by the jets because of the lack of optical quenching in the soft state (Section 2.4.1). In addition, the optical spectrum of most BHXBs is inconsistent with jet emission dominating (Chapter 3). Instead we suggest that OIR emission from reprocessing is enhanced for BHXBs at a given due to the localisation of the source of X-rays. For example, the X-ray emitting region in BHXBs may have a larger scale height than in NSXBs and will therefore illuminate the disc more readily (e.g. Miniutti & Fabian, 2004). This may account for the high value of for the optical BHXB data, but still struggles to explain the even higher for the NIR BHXB data, which strongly suggests the NIR is indeed jet-dominated. On the other hand, some of the X-ray emission could originate in an outflow (e.g. Markoff et al., 2001, 2005) which may be relativistic and therefore beamed, which would result in less X-rays illuminating the accretion disc. In this sense our results suggest the X-rays are not significantly beamed if X-ray reprocessing dominates the OIR.
We note that there are deviations of individual sources from the correlations which may be caused by distance and reddening errors, or by differing emission process contributions due to the range of orbital separations or slight differences in the slope of the radio–OIR jet spectrum between sources (or other system parameters not considered). For example, XTE J1118+480 has a small disc and is known to produce significant optical jet emission (e.g. Malzac, Merloni & Fabian, 2004; Hynes et al., 2006b) whereas V404 Cyg possesses a large disc and is dominated by X-ray reprocessing in the disc (e.g. Wagner et al., 1991). Other OIR emission mechanisms that could contribute, for example disc OIR emission due to magnetic reconnection, have not been modelled here and could also contribute to the scatter in Fig. 22. These processes cannot be ruled out, but are unlikely to easily explain the observed correlations.
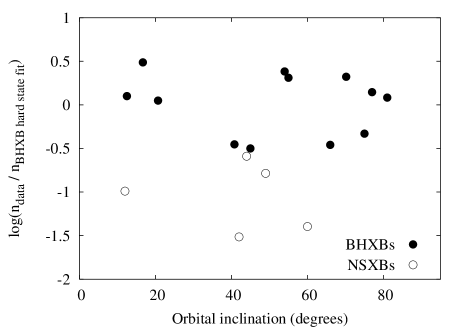
In addition, the orbital inclination may affect the level of OIR emission, in particular from X-ray reprocessing in the disc. To explore this, I have plotted in Fig. 25 the average normalisation of the data for each source against the known estimated orbital inclination, fixing the slope at for each source. The best estimate of the inclination of each system (where known) was obtained from Ritter & Kolb (2003), Treves et al. (1988), Fomalont, Geldzahler & Bradshaw (2001), Wang et al. (2001) and Falanga et al. (2005). Note that for the NSXBs I use the data from Paper I; a smaller sample than that of Paper IV, but a global OIR–X-ray relation was found for NSXBs in Paper I and so one can measure the more easily than from the data in Paper IV. We find no evidence for there being a direct relation between and the orbital inclination , suggesting the effect of inclination is subtle.
2.4.3 OIR Spectral Index – X-ray Relations in NSXBs
In Chapter 3 the OIR spectrum of BHXBs and NSXBs is discussed as a function of OIR luminosity. For BHXBs this can be directly related to X-ray luminosity since and are well correlated with a single power-law in BHXBs. In this Section we explore the direct relationship between the optical/NIR spectral index and in NSXBs. This analysis is also motivated by the apparent NIR-excess recently seen in MSXPs (see Section 1.2.2; Paper IV).
The lower panels of Figs. 23 and 24 describe the dependence of the shape of the OIR spectrum of NSXBs with and , respectively. The spectral index is calculated for all NSXB OIR data where two or more optical or NIR data points are quasi-simultaneous. The spectral index of the optical (using data in the , or -bands) and NIR (, , , or -bands) data are shown separately. We define the -band as the break between optical and NIR here because it is often the colours that indicate the NIR excess (and for many of these observations data were not obtained). For consistency (and to separate the two wavebands used to calculate ) the two lowest frequency NIR bandpasses in each OIR SED are used to calculate and the two highest frequency optical bands are used to calculate . Data from the Z-sources are shown as different symbols to the atolls/MSXPs because the spectral index of the former group appears to behave differently to that of the latter (see below).
As the plots show, there is a relatively large mean systematic uncertainty here in measurements of the spectral index . These are very likely (unavoidable) substantial overestimates, for the following reason. For the data gathered, errors are quoted for each magnitude or flux measurement, but there is no knowledge of if these errors are related between two wavebands. In most cases they are likely to be correlated for consecutive data taken with the same telescope but with different filters. The errors associated with the spectral index as derived from the colour (e.g. -) will therefore be less than this error as estimated by error propagation from the magnitude or flux errors. For example, if the fluxes in and have quoted errors of 30%, the spectral index since the two wavebands are close together in log(frequency). This estimate is therefore a huge overestimate if the flux errors are correlated.
It is evident from the lower panel of Fig. 24 that there is a relation between and for MSXPs and atolls: the NIR spectrum becomes redder at higher luminosities. Quantitatively, becomes negative when erg s-1 and is positive for all data below erg s-1. This is opposite to the expected relation if the origin of the emission is the disc blackbody, where one would expect a bluer (hotter) spectrum at higher luminosities.
The only process expected to produce an OIR spectrum of index at high luminosities in these systems is optically thin synchrotron. It is therefore intriguing that for atolls and MSXPs when ergs s-1; the X-ray luminosity range in which the jet could play a role (Fig. 24, upper panel). Since there are just five NIR data points in the lower panel of Fig. 24 below erg s-1, we perform a Kolmogorov-Smirnov (K-S) test to quantify the significance of the apparent – relation for the atolls/MSXPs. We use the ‘Numerical recipes in FORTRAN’ (Press et al., 1992) routine ‘kstwo’ which is the K-S test for two data sets, to determine if the values of differ significantly below and above erg s-1. The maximum difference between the cumulative distributions is with a corresponding probability of ; i.e. the probability that the NIR spectral index of the data below erg s-1 belongs to the same population as the data above erg s-1 is 0.05 percent.
In addition, we have carried out a Spearman’s Rank correlation test on the – and – data of atolls/MSXPs (Table 10). An anti-correlation between and is found at the 3.8 confidence level, supporting the above K-S test results. We do not find a significant relation between and except when we impose a somewhat arbitrary X-ray luminosity cut: for data above erg s-1 there is an anti-correlation at the 3.5 confidence level. This again could be due to the jet contribution dominating at these highest luminosities. The confidence of this result should be taken with caution as it could be dominated by the group of data with the highest values which happen to lie just above the erg s-1 cut.
| OIR data | Range in | Correlation | Significance |
|---|---|---|---|
| used | (erg s-1) | coefficient | |
| all | 3.8 | ||
| all | 0.8 | ||
| 3.5 |
The optical spectral index is generally positive for atolls and MSXPs (Fig. 24 lower panel), but decreases at erg s-1. We would expect to become negative at a higher X-ray luminosity than if the origin of the redder emission component is the jets. As the X-ray luminosity is increased, the optically thin synchrotron jet component will dominate over X-ray reprocessing in the NIR bands before the optical as the jet component has a negative spectral index. At erg s-1, is negative in 63 percent of the optical data of atolls/MSXPs. Below erg s-1 this is 7 percent. These few data in the latter group with are at low ( erg s-1) and may be due to cooler accretion discs (possibly like the BHXBs; Paper I). However, the mean uncertainty in the values of are fairly large, so we can only make conclusions from general trends and not individual data points.
Almost all of the spectra of the Z-sources are blue (; Fig. 24, lower panel). This supports the suggestion in Section 2.4.2 that X-ray reprocessing dominates the OIR of the Z-sources due to their larger accretion discs and lower radio jet luminosities (at a given ). The Z-sources cannot be dominated by optically thin synchrotron emission as this requires . Since the radio–OIR spectrum of Z-sources is (Section 2.4.2), the optically thick part of the jet spectrum could dominate the OIR if also (although this requires the optically thick/thin break to be in the optical regime or bluer). is observed for most of the data from the Z-sources (Fig. 24 lower panel), which implies this is not the case, however we cannot rule out an optically thick jet origin to a few of the OIR Z-source data (those with lower spectral indices).
The lower panel of Fig. 23 shows how the optical and NIR spectral index changes with . The Z-source data in this panel have the largest values of . The expected level of OIR emission from reprocessing in the disc in these systems is larger than that of the atolls/MSXPs due to their larger accretion discs and higher X-ray luminosities, further supporting the X-ray reprocessing scenario.
A direct measurement of the jet radio–NIR spectral index for the atolls/MSXPs can be made, using the NIR data which are dominated by the jets. In the luminosity range erg s-1, the NIR data with a negative spectral index are on average 0.70 dex more luminous than expected from the jet model (which assumes a flat radio–NIR spectrum; we know the radio luminosity at this from Migliari & Fender, 2006). Some low level contribution from the disc could only partly explain this excess. The corresponding radio–NIR spectral index in that range of is (0.70 dex in luminosity divided by 4.5 dex in frequency between radio and NIR). The optically thick to optically thin break frequency in NSXBs is thought to be in the mid-IR (Migliari et al., 2006), making the optically thick radio–mid-IR jet spectrum more inverted; .
2.5 Applications of the Correlations
The existence of the OIR–X-ray relations leads to a number of intriguing tools and uses for quasi-simultaneous multi-wavelength data.
2.5.1 The Rise and Fall of a BHXB Outburst
During a transient outburst typical of BHXBs, the source will either remain in the hard state for the entire outburst (e.g. XTE J1118+480; GRO J1719–24; see also Brocksopp et al., 2004) or transit into the soft (or intermediate or very high) state, before returning to the hard state and declining in luminosity. A hysteresis effect has been identified in BHXB transients, and at least one NSXB transient: the hard to soft state transition always occurs at a higher X-ray luminosity than the transition back to the hard state (Maccarone & Coppi 2003; Maccarone, Gallo & Fender 2003; Yu et al. 2003; Fender et al. 2004; Homan & Belloni 2005).

Here, we present a prediction of the OIR behaviour of an outburst that results from this hysteresis effect and the models in Section 3.2. The following sequence of events should occur for a BHXB outburst that enters the soft state:
-
•
and increase in the hard state rise of the outburst, with jets and reprocessing contributing to the OIR.
-
•
The source enters the soft state, quenching the jet component. drops but is maintained.
-
•
and decrease before transition back to the hard state, when the jet component returns.
-
•
and continue to decline, with jets and X-ray reprocessing contributing towards .
This sequence is illustrated in the top panel of Fig. 26. In this schematic, we fix the hard-to-soft state transition at erg and the soft-to-hard, at erg . To test our hysteresis prediction, we split the hard state BHXB data into data from the rise of outbursts and data from the declines. We define rise and decline as before and after the peak X-ray (2–10 keV) luminosity of the outburst, respectively. We do not include data on the decline for sources that remained in the hard state throughout the outburst, as this is not what our prediction is testing. In the lower panel of Fig. 26 we plot these and the soft state data. Data from persistent sources (LMC X–3 and GRS 1915+105) and from sources in or near quiescence are not included. We find that the prediction is consistent with the data, with some inevitable scatter from errors as described in Section 2.4.2. The loop is larger in the NIR data, as is expected because the jets contribute more in the NIR than in the optical regime. Other reasons for any deviations from the expected models are also discussed in Section 2.4.2.
I return to this subject in Chapter 4, where the above hysteresis is indeed observed with the predicted hard state slopes. However there is a twist: the NIR luminosity at a given is higher on the decline than on the rise of an outburst (at least in one source).
2.5.2 The Mass Accretion Rate
In Section 1.2.3 I show how and ṁ are thought to be linked for BHXBs and NSXBs. Here, we can use the empirical – correlations to link the OIR luminosity to the mass accretion rate. For the NSXBs this can be compared to observed OIR luminosities only when (a) is low and the jet component is not dominant, and (b) when the NSXB is in a hard state (see above).
BHXBs: ṁ1.2
NSXBs: ṁ0.6
Essentially, for BHXBs and NSXBs respond to in the same way, but not to ṁ, since varies with ṁ differently for BHXBs and NSXBs. From equations (1) and (7) of Körding, Fender & Migliari (2006) we can estimate accretion rates directly from in the hard state:
BHXBs: (ṁ/ )1.2
Or: ṁ/ ( )0.8
NSXBs: (ṁ/ )0.6
Or: ṁ/ ( )1.7
Given the level of the scatter in the correlations, we expect these calculations to be accurate to one order of magnitude. The OIR luminosity is all that is required to estimate ṁ for hard state objects, however ṁ would be more accurately measured from , where most of the energy is usually released. In addition, it is possible to estimate the X-ray, OIR and radio luminosities in the hard state quasi-simultaneously, given the value of just one because they are all linked through correlations.
2.5.3 The Parameters of an X-ray Binary
Quasi-simultaneous OIR and X-ray luminosities can constrain the nature of the compact object (BHXB or NSXB), the mass of the companion (HMXB or LMXB) and the distance and reddening to an X-ray binary. This is possible because the data from BHXBs (in the hard and soft states), NSXBs and HMXBs lie in different areas of the – diagram, with some areas of overlap (Fig. 27). If the distance and reddening towards a source are known (not necessarily at a high level of accuracy), its quasi-simultaneous OIR and X-ray fluxes could reveal the source to be any one of the above types of XB. In addition, if the nature of the compact object is known (BH or NS), but the distance and/or reddening is not, the fluxes can constrain these parameters. I stress that the total errors associated with the data (top left error bars in Figs. 13–20) need to be considered to define the areas of overlap.
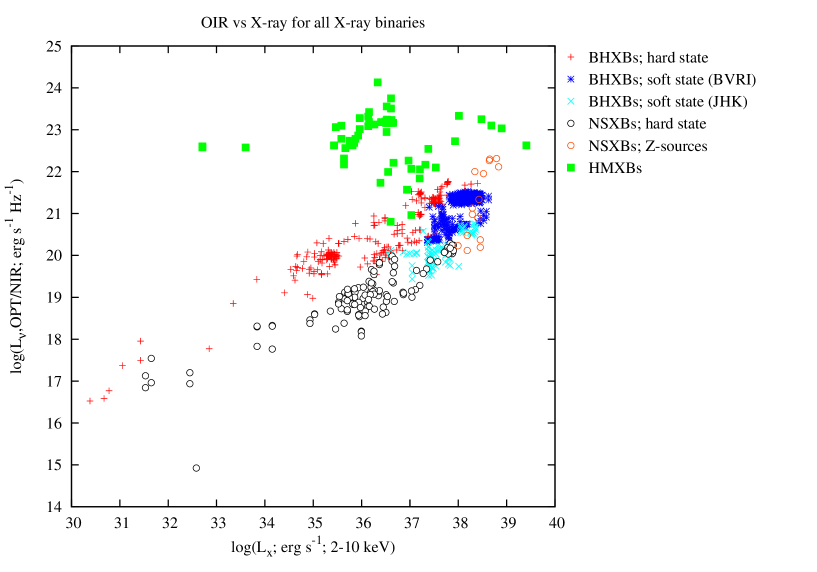
Current techniques used to infer the nature of the compact object in XBs include X-ray timing analysis (e.g. thermonuclear instabilities on accreting neutron stars produce Type I X-Ray bursts), the X-ray spectrum (the well-known X-ray states of BHXBs and tracks in the colour–colour diagrams of NSXBs; e.g. McClintock & Remillard, 2006) and optical timing analysis in quiescence (the orbital period and radial velocity amplitude constrain the mass function). This new tool has the power to constrain the nature of the compact object requiring only , and, only at high luminosities, the X-ray state of the source at the time of observations.
This tool may have many applications. X-ray all-sky monitors such as the RXTE ASM are continuously discovering new XBs which are subsequently identified at optical wavelengths. In addition, campaigns are underway to find extragalactic XBs, many of which have optical counterparts discovered with the (e.g. Williams et al., 2005). It would also be interesting to see where ULXs and SMBHs (e.g. the X-ray and NIR flares seen from Sagittarius A*; e.g. Yuan, Quataert & Narayan, 2004) lie in the – diagram with the inclusion of a mass term, and whether this could be used to constrain the BH mass in these systems.
2.6 Summary
I have collected a wealth of OIR and X-ray fluxes from over 40 XBs (including new observations of three sources) in order to identify the mechanisms responsible for the OIR emission using correlation analysis between the two regimes. A strong correlation between quasi-simultaneous OIR and X-ray luminosities has been discovered for BHXBs in the hard state: . This correlation holds over 8 orders of magnitude in and includes data from BHXBs in quiescence and at large distances (LMC and M31), which were (until recently; see Gallo et al., 2006) unattainable for radio–X-ray correlations in XBs. All the NIR (and some of the optical) BHXB luminosities are suppressed in the soft state; a behaviour indicative of synchrotron emission from the jets at high luminosities in the hard state. Comparing the hard state OIR data to radio data of Gallo et al. (2003), we find that the radio–OIR jet spectrum in BHXBs is flat ( constant) at a given (see also Fender, 2001).
A – relation is found for NSXBs but it cannot be described by a single power-law. Below erg s-1, a NSXB is typically 20 times fainter in OIR than a BHXB, at a given . The average radio–OIR spectrum for NSXBs is at least at high luminosities when the radio jet is detected. In atolls and MSXPs, the observed spectral index of the continuum becomes red () above erg s-1 and erg s-1 for the NIR and optical continuum, respectively. The Z-sources (which occupy the highest luminosities) have a blue () OIR spectrum.
By comparing the observed OIR–X-ray relations with those expected from models of a number of emission processes, one is able to constrain the mean OIR contributions of these processes for XBs. Table 11 summarises the results. We find from the level of soft state quenching in BHXBs that the jets are contributing 90 percent of the NIR emission at high luminosities in the hard state. The optical BHXB data could have a jet contribution between zero and 76 percent. In BHXBs, ambiguity arises from the fact that the slope of the expected OIR–X-ray relations from the jets and X-ray reprocessing are essentially indistinguishable. Emission from the viscously heated disc may contribute at low luminosities in BHXBs, but cannot account for the observed correlations. The OIR light from soft state BHXBs could originate from a combination of X-ray reprocessing (as the OIR–X-ray relations suggest) and the viscous disc (e.g. Homan et al., 2005a, see also Chapter 4).
The dominating OIR emission processes in NSXBs vary with X-ray luminosity and between source types (atolls/MSXPs and Z-sources). Models predict that X-ray reprocessing in the accretion disc should dominate the OIR at low luminosities and the jets, if present, should dominate at high luminosities for NSXBs with relatively small accretion discs. The observed spectral index of the OIR continuum and the OIR–X-ray relations indicate this is the case in atolls and MSXPs: the jets dominate the NIR and optical emission above erg s-1 and erg s-1, respectively. Below these luminosities X-ray reprocessing dominates, although we cannot rule out a viscously heated disc origin to the optical emission. The average radio–NIR spectral index of the actual jets in atolls/MSXPs (at high luminosities when they are detected in the NIR) is slightly inverted: . In the Z-sources, which have larger discs, we find that X-ray reprocessing is responsible for all OIR emission, and the radio–OIR jet spectrum has to be (otherwise the jet spectrum would dominate over the disc). However, the optically thick part of the jet spectrum could dominate in a few cases.
In general, the exact contributions of the emission processes are likely to be sensitive to many individual parameters, such as the size of the accretion disc and the shape of the jet spectrum (e.g. the OIR luminosity of the jets is very sensitive to the slope of the optically thick jet spectrum).
| Sample | X-ray | Jet emission | Viscous disc | Intrinsic |
|---|---|---|---|---|
| reprocessing | companion | |||
| BHXBs; OPT; hard state | ||||
| BHXBs; NIR; hard state | ||||
| BHXBs; OIR; soft state | ||||
| Atolls/MSXPs; OPT; erg s-1 | ||||
| Atolls/MSXPs; NIR; erg s-1 | ||||
| Atolls/MSXPs; OPT; erg s-1 | ||||
| Atolls/MSXPs; NIR; erg s-1 | ||||
| Z-sources; OIR | ||||
| HMXBs; OIR; all |
I have presented a prediction of the – behaviour of a BHXB outburst that enters the soft state, where the peak in the hard state rise is greater than in the hard state decline (the well known hysteretical behaviour). The data obtained in this Chapter appear to agree with the prediction, with some scatter (see Chapter 4 for a slight revision of this behaviour motivated by empirical hysteresis). It is also possible to estimate the X-ray, OIR and radio luminosity and the mass accretion rate in NSXBs and hard state BHXBs quasi-simultaneously, from observations of just one of these wavebands, since they are all linked through correlations. This is currently possible due to daily monitoring of the X-ray and OIR fluxes being done for some sources by e.g. the RXTE ASM and by ground-based telescopes. In addition, we have discovered a potentially powerful tool to complement current techniques, that can constrain the nature of the compact object, the mass of the companion and the distance/reddening towards an XB, given only the quasi-simultaneous X-ray and OIR luminosities. Data from BHXBs (in the hard and soft states), NSXBs and HMXBs lie in different areas of the – diagram, with small areas of overlap. The tool is most useful for e.g. faint sources with poor timing analysis or at large distances, i.e. extragalactic XBs and new transients. Finally, future – correlation analysis could be used to constrain the emission process contributions in the intermediate and very high X-ray states of BHXBs and in ULXs and SMBHs.
3 OIR spectral energy distributions
3.1 Introduction
In Chapter 2 correlation analysis was used to constrain the dominating OIR emission processes in X-ray binaries. In this Chapter I present a collection of OIR Spectral Energy Distributions (SEDs) which are used to further constrain the emission processes, this time from the shape of the spectrum of the continuum. In Chapter 2 it was shown that a number of separate processes could explain most of the relations between OIR, X-ray and radio luminosities in BHXBs and NSXBs. However, these processes are expected to have different spectral slopes, and so SEDs can help to reveal the ones which dominate at a given luminosity. The results of this Chapter are presented and discussed in Paper I (focusing on the BHXBs) and Paper IV (focusing on the NSXBs).
As with Chapter 2, most of the data collection, presentation and analysis is my own work. The co-authors of the papers provided valuable comments and suggested changes. Data were used that were provided by the co-authors (Rob Fender, Peter Jonker, Rob Hynes, Catherine Brocksopp, Jeroen Homan and Michelle Buxton) and also Erik Kuulkers. Use of the word ‘we’ is adopted in this Chapter when referring to work not done by myself alone.
3.2 Methodology
I conducted a literature search for OIR Spectral Energy Distributions (SEDs) of BHXBs and NSXBs. Fluxes were used when two or more OIR wavebands were quasi-simultaneous (preferably during the same run using the same instrument, but often within one day using different optical and NIR telescopes). No X-ray fluxes were required for the SEDs, however for the BHXBs the X-ray state of the source on the date was noted. No distinctions were made in the data from NSXBs except to note the different source type; atoll, Z-source or MSXP. Where the companion star significantly contributes to the emission (i.e. in quiescence), the estimated wavelength-dependent contribution of the companion was subtracted (adopting the quoted contributions given in the papers from which the data were acquired). The lowest flux data from the Z-sources were not used as the companion contribution is largely unknown.
Fluxes and magnitudes were de-reddened and converted to intrinsic monochromatic luminosities in the same manner as described in Sections 2.2.1 and 2.2.2, adopting the estimates of source distance and interstellar extinction given in Tables 2–5. The data reduction procedure for observations obtained for the first time by us (the sources GX 349+2, LMC X–2 and 4U 0614+09) are described in Sections 2.2.3 and 2.2.4.
3.3 Results

| Source | X-ray | Dates (MJD) | References |
| state | |||
| GRO J0422+32 | hard | 48866, 48870, 49006–7, 49039, 49209, 49590 | 1 – 4 |
| LMC X–3 | hard | 50151, 50683 | |
| soft | 50324, 51038 | ||
| unknown | 46804 | 5 – 7 | |
| A0620–00 | hard | 42792, 43097–100, 42859 | |
| soft | 42650–2, 42703 | 8 – 11 | |
| XTE J1118+480 | hard | 51652, 51975, 53385-6, 53393, 53409, 53412 | 12 – 131 |
| GRS 1124–68 | hard | 48453, 48622 | |
| soft | 48367-71 | 14 – 16 | |
| GS 1354–64 | hard | 50778, 50782, 50851, 50888 | 17 |
| 4U 1543–47 | hard | 52486, 52490, 52495, 52501 | |
| soft | 52454, 52469 | 18 | |
| XTE J1550–564 | hard | 51260, 51630, 51652, 51717 | |
| soft | 51210, 51660, 51682 | 19 – 20 | |
| GRO J1655–40 | hard | 53422 | |
| soft | 50217, 50254, 50286, 50648 | 21 – 23 |
1Some of this data is previously unpublished and was obtained with the Liverpool Telescope and the United Kingdom Infrared Telescope. See Brocksopp et al. (in preparation) for the data reduction recipe used. References for Table 12 and 13: (1) Bartolini et al. (1994); (2) Goranskii et al. (1996); (3) Castro-Tirado, Ortiz & Gallego (1997); (4) Hynes & Haswell (1999); (5) Brocksopp et al. (2001a); (6) Treves et al. (1987); (7) Treves et al. (1988); (8) Robertson, Warren & Bywater (1976); (9) Oke & Greenstein (1977); (10) Oke (1977); (11) Kleinmann, Brecher & Ingham (1976); (12) Chaty et al. (2003); (13) Paper I (see Brocksopp et al. in preparation); (14) King et al. (1996); (15) della Valle et al. (1998); (16) Bailyn (1992); (17) Brocksopp et al. (2001b); (18) Buxton & Bailyn (2004); (19) Jain et al. (2001a); (20) Jain et al. (2001b); (21) Buxton, Bailyn & Maitra (2005a); (22) Hynes et al. (1998); (23) Chaty et al. (2002); (24) Corbel & Fender (2002); (25) Homan et al. (2005a); (26) Sekiguchi & van Wyk (1993); (27) Allen & Jones (1993); (28) Allen & Gilmore (1993); (29) Brocksopp et al. (2004); (30) Nagata et al. (2003); (31) Haswell et al. (2000); (32) Hynes et al. (2002a); (33) Charles et al. (1981); (34) Chevalier & Ilovaisky (1990); (35) Szkody et al. (1989); (36) Gehrz, Johnson & Harrison (1989); (37) Casares et al. (1991); (38) Han & Hjellming (1992).
| Source | X-ray | Dates (MJD) | References |
|---|---|---|---|
| state | |||
| GX 339–4 | hard | 44748–59, 49539, 50648, 52368, 52382 | |
| intermediate | 52406 | 23 – 25 | |
| GRO J1719–24 | hard | 49096, 49101, 49108, 49266, 49280, 49539 | 23, 26 – 29 |
| XTE J1720–318 | hard | 52782 | |
| soft | 52659, 52685, 52713 | 30 | |
| XTE J1859+226 | hard | 51605–8 | |
| soft | 51465, 51469, 51478, 51488, 51501 | 31, 32 | |
| GS 2000+251 | soft | 47360 | |
| unknown | 47482 | 33, 34 | |
| V404 Cyg | hard | 47684, 47718–27 | |
| soft | 47678 | 35 – 38 |
OIR SEDs were collected of 15 BHXBs in a range of luminosities and X-ray states and are presented in Fig. 28. The dates of observations and references are given in Table 12–13. The SEDs of 17 NSXBs are shown in Fig. 29 and the references for the data are listed in Table 5. A separate table is provided for the BHXBs because the references of much of the data are different from those for the BHXB data used in Chapter 2. The references for the NSXB data are all in Table 5 because the SEDs of NSXBs are already used in Chapter 2 to estimate the optical and NIR spectral indices. Unlike Chapter 2, all of the quasi-simultaneous OIR wavebands are shown in the SEDs in this Chapter (Fig. 29) whereas only a few wavebands were used to estimate the spectral indices in Chapter 2 (see Section 2.4.3). In the following subsection we attempt to interpret the OIR SEDs in terms of the dominating emission processes.
3.4 Interpretation & Discussion
3.4.1 The BHXB SEDs
Although no clear patterns are visible from the BHXB SEDs in Fig. 28 on first inspection, closer analysis reveals support for many of the conclusions made in Chapter 2. Optically thin synchrotron emission is expected to produce an OIR spectral index 0, and this is seen in part of the SEDs of 10 out of 14 BHXBs in the hard state. In the soft state only 3 out of 10 BHXBs are observed to have 0, suggesting a synchrotron component playing a larger role in the hard state than in the soft ( in some sources could be dominated by uncertainties in ; e.g. the SEDs of XTE J1550–564 are red even in the soft state, which is likely due to an underestimated extinction; see Jonker & Nelemans, 2004). In comparison, 0 is seen in the SEDs of 10/14 BHXBs in the hard state and 10/10 in the soft state. These spectra are likely to have a thermal origin and agree with recent analysis of optical/UV SEDs of 6 BHXBs (Hynes, 2005). The SEDs generally appear redder in the hard state than in the soft, as is observed by the NIR suppression in the soft state (Section 2.4.1).
A clear suppression of the NIR, and not the optical bands in the soft state is visible in the SEDs of GX 339–4, XTE J1550–564 and 4U 1543–47 (Homan et al., 2005a; Jain et al., 2001b; Buxton & Bailyn, 2004). In contrast, the NIR spectral index of XTE J1720–318 and XTE J1859+226 appear not to change between the hard and soft states. The SEDs show no substantial evidence for the turnover in the jet spectrum from optically thick ( 0) to optically thin (0.6) synchrotron emission, as we may expect to see in the hard state (except in GX 339–4; see Corbel & Fender, 2002). This is consistent with the turnover lying redward of the -band. In some systems, is more negative at low luminosities. This effect could be the result of (a) a cooler accretion disc, or (b) the jets contributing more than the disc at low luminosities. Since the former process cannot explain the steeply negative SEDs of a few BHXBs at low luminosities, we suspect both processes may play a role.

Finally, the hard state NIR excess seen in GX 339–4 (Corbel & Fender 2002; Homan et al. 2005a; interpreted as where the optically thin jet spectrum meets the blue thermal spectrum) is here also seen in LMC X–3 (tentatively), 4U 1543–47, XTE J1550–564 and V404 Cyg. In these sources, we interpret the NIR excess as originating in the optically thin part of the jet spectrum.
3.4.2 The NSXB SEDs
We group the panels in Fig. 29 into the different types of NSXB: MSXPs in the upper panels, then atolls, then Z-sources in the lower panels. One can visually see a NIR excess () joining a blue () optical spectrum in the SEDs of four of the five MSXPs (the ‘V’-shape). This is indicative of two separate spectral components and, like the BHXBs, is interpreted as the optically thin jet spectrum meeting the thermal spectrum of the accretion disc. The NIR excess disappears at low luminosities in a total of four outbursts of three MSXPs; no NIR excess is seen below erg s-1 Hz-1 in any MSXP or in fact any NSXB. This behaviour was suggested by the – plots in Section 2.4.3 but here the two spectral slopes are identified in the same spectra of the same source. Radio emission has been detected briefly from MSXPs at the peak of their outbursts (e.g. Gaensler, Stappers & Getts, 1999); this is consistent with the jet being brightest at their highest X-ray luminosities, as the NIR jet suggests.
Of the five atolls in Fig. 29, one (Aql X–1; the atoll with the most data and highest luminosity) has a negative spectral index; more-so at high luminosity. There is little NIR coverage of atolls in the literature (at least at high luminosities) and from the data we have, the OIR SEDs are positive in all sources except Aql X–1, consistent with the disc dominating the OIR. The optical spectral index for Aql X–1 is very negative at the highest luminosities, suggesting all of the OIR was dominated by the jets during the peak of the bright 1978 outburst of this source. The SED of 4U 0614+09 flattens (becomes redder) in the NIR; this is known to be where the disc spectrum meets that of the jet (Migliari et al., 2006).
There is no evidence for a jet () component contributing to the OIR spectra of any of the seven Z-sources in Fig. 29. The jets should be OIR-bright in Z-sources but because of their larger discs, X-ray reprocessing dominates. For the new transient Z-source XTE J1701–462 (Homan et al., 2007a), the optical extinction is not well constrained and we show three SEDs in Fig. 29 of the same data, using different values of to illustrate the possible range in spectral indices. The spectral indices in a few observations are also consistent with an optically thick jet which extends from the radio regime (e.g. the shallower spectral index of Cyg X–2). This would require the optically thick–optically thin turnover to be at a higher frequency than the optical, contradictory to its position for at least one atoll (Migliari et al., 2006).
3.4.3 The Power of the Jets
The evidence in this Chapter confirms the presence of a flat or slightly inverted jet spectrum from radio to NIR wavelengths in some NSXBs (atolls and MSXPs at least) and in hard state BHXBs, which breaks to an optically thin spectrum redward of the OIR regime. This turnover is close to the -band in BHXBs (see Section 2.4.1). The turnover may be further into the NIR for NSXBs (Migliari et al., 2006) but if the radio–NIR spectrum is flat (as is shown here), this would require an inverted () optically thick radio–mid-IR jet spectrum. The power of the jets is sensitive to the position of the turnover since it is dominated by the higher energy photons. However, the most recent calculations of the jet power (e.g. Gallo et al., 2005; Heinz & Grimm, 2005; Migliari & Fender, 2006) already assume the jet spectrum extends to the IR (for the BHXBs at least), and extra calculations are beyond the scope of this work.
3.5 Summary
Quasi-simultaneous OIR data have been collected for 32 LMXBs: 15 black hole systems, five MSXPs, five atolls and seven Z-sources. The optical and NIR spectral slopes (parameterised by the spectral index ) are compared between object types and as a function of luminosity. In Chapter 2 it was not possible to differentiate between different emission processes which are predicted to have similar OIR–X-ray relations, but this has been possible in this Chapter for emission processes which are expected to differ in spectral slope.
| Sample | X-ray | Jet emission | Jet emission | Viscous |
|---|---|---|---|---|
| reprocessing | (opt. thin) | (opt. thick) | disc | |
| BHXBs; OPT; hard state | ||||
| BHXBs; NIR; hard state | some | some | ||
| BHXBs; OIR; soft state | ||||
| Atolls/MSXPs; OPT; highest | ||||
| Atolls/MSXPs; NIR; high | ||||
| Atolls/MSXPs; OPT; low/moderate | ||||
| Atolls/MSXPs; NIR; low | ||||
| Z-sources; OIR | some |
In Table 14 I summarise the emission processes that can explain the OIR SEDs of BHXBs and NSXBs. The majority of the OIR SEDs of BHXBs are thermal, with . This is consistent with X-ray reprocessing in the disc dominating the emission, largely agreeing with the literature. The NIR region of the BHXB SEDs are almost all non-thermal () in the hard state, indicating optically thin synchrotron emission from the jets; a separate spectral component which is seen to join the disc component in some sources, around the -band. This emission is in fact found to be suppressed in the soft state, which is expected as the jet component is quenched in both this regime and the radio.
The emission in the soft state of BHXBs could originate from a combination of X-ray reprocessing (as the OIR–X-ray relations suggest; see Chapter 2) and the viscous disc (see Chapter 4 and e.g. Homan et al., 2005a). The SEDs of many BHXBs are redder at low luminosities, which seems to be due to both a cooler disc blackbody and possibly a higher fractional contribution from the jets. BHXBs may be jet-dominated at low luminosities (for more on jet-dominated states, see Fender 2001; Falcke, Körding & Markoff 2004; Fender et al. 2004; Gallo et al. 2005; Körding, Fender & Migliari 2006). The optically thick jet spectrum of BHXBs must extend to near the -band for (a) the radio spectrum to be flat (Fender, 2001), (b) the radio–to–OIR spectrum to appear flat (Section 2.4.1), and (c) the NIR spectrum to be optically thin (this Chapter).
We find that thermal emission due to X-ray reprocessing can explain all the NSXB data except at high luminosities for some NSXBs, namely the atolls and MSXPs. Optically thin synchrotron emission from the jets (with an observed OIR spectral index of ) dominate the NIR light at high luminosities and the optical at the peak of the bright outbursts in these systems. For NSXB Z-sources, the OIR observations can be explained by X-ray reprocessing alone, although synchrotron emission may make a low level contribution to the NIR. The optically thick jet spectrum could dominate the OIR in one or two cases if the spectral break is at a higher frequency than currently thought. The turnover in the optically thick jet spectrum of NSXBs must be redward of the -band for the NIR to be optically thin (as seen in the atolls/MSXPs). The radio spectral index of NSXBs is fairly unconstrained (e.g. Migliari & Fender, 2006) and could be more inverted than that of BHXBs because (a) the radio–to–OIR spectral index is slightly inverted (Section 2.4.3) and (b) the turnover is in the mid-IR in at least one atoll (Migliari et al., 2006).
4 NIR – X-ray hysteresis
4.1 Introduction
In Chapter 2 a global correlation between X-ray and OIR luminosities was found for BHXBs in the hard state. This led onto a prediction (Section 2.5.1) of the track a BHXB should trace out during a transient hard state–soft state–hard state outburst. Here, outbursts from individual BHXBs are examined and a new hysteresis effect is found: the NIR emission appears to be weaker in the hard state rise of an outburst than the hard state decline of an outburst at a given X-ray luminosity. The hysteresis could be the result of a number of different effects, each of which are discussed in detail. In addition, correlations are found between X-ray and NIR luminosities in the soft state in two sources. In the same manner as Chapter 2, correlation analysis is used to constrain the emission mechanisms which dominate in the soft state.
This project led to a publication in the Monthly Notices of the Royal Astronomical Society (; Russell, Maccarone, Körding & Homan 2007; Paper V). Thomas Maccarone led the initial motivation of this project; to test whether there are parallel tracks in jet power versus X-ray power in X-ray binaries in the hard state, and provided much of the discussion and introduction. Elmar Körding contributed to the discussion, in particular the dependency of the mass accretion rate on a number of system variables. Jeroen Homan provided most of the data and suggested some changes to the manuscript. The literature search, methodology and results were provided by myself and I also contributed to all sections and compiled, re-arranged and edited the manuscript. Since in this Chapter there are many discussions involving the dimensionless viscosity parameter (the symbol alpha is used extensively for this in the literature), I adopt the symbol for the spectral index () as opposed to (which is used in other Chapters), in this Chapter.
4.2 The data
I searched the literature for BHXBs with well sampled quasi-simultaneous ( day) NIR–X-ray or radio–X-ray data on the rise and/or decline of a transient outburst (where NIR refers to , or -band). Data from three sources were found: 4U 1543–47, XTE J1550–564 and GX 339–4. XTE J1550–564 is the only source for which both rise and decay data of the same outburst were available. Apparent fluxes were converted to intrinsic luminosities adopting the best known estimates of the distance to the sources, the extinction and neutral hydrogen column density . In Table 15 these values and the outbursts, telescopes used and references of the data are listed. is adopted for XTE J1550–564 as opposed to , which is adopted in Chapters 2 and 3. A value of is inferred from the hydrogen column density measured from X-ray observations of this source (Tomsick, Corbel & Kaaret, 2001, 2003b; Kaaret et al., 2003). A value of produces a red optical spectrum ( where ; Chapter 3), which would indicate a much cooler disc than is expected, whereas with the spectrum is blue (), as is expected for the Rayleigh-Jeans side of the disc blackbody spectrum. While uncertainties in the extinction will affect the relative normalisations of the – relations for different sources, they will not affect the slopes of the relations for the individual sources. At the time of carrying out the projects of Chapters 2 and 3, the lower value of was the most cited for this source and so that was the one we adopted; but the above more careful analysis indicates the larger value is more accurate, so it is adopted here in this later project.
To calculate the X-ray unabsorbed 2–10 keV luminosity, a power-law of spectral index 0.6 (photon index ) is assumed when the source is in the hard state and a blackbody at a temperature of 1 keV when the source is in the soft state (these are the same as in the previous Chapters). The resulting luminosities do not change significantly if similar reasonable approximations to these values are adopted. RXTE ASM X-ray counts were converted to flux units using the NASA tool Web-PIMMS. Since data close to state transitions are used, the dates of these transitions are adopted from those found by the analyses of the authors in the literature. Inaccurate background subtraction could severely affect the X-ray luminosity estimates at low luminosities. For 4U 1543–47, Kalemci et al. (2005) have accounted for the Galactic X-ray background (e.g. Lahav et al., 1993; Brandt et al., 2002; Page et al., 2006). The X-ray data used here for XTE J1550–564 are more than two orders of magnitude above the quiescent level so no background subtraction is necessary. The X-ray background contamination for GX 339–4 is uncertain (Nowak et al., 2002), but for a reasonable choice of background fluxes the slope of the resulting NIR–X-ray correlation (see Section 4.3) does not change.


| Source | Outburst | Telescopes | Distance | / | Flux | |
|---|---|---|---|---|---|---|
| / kpc | 10 | refs | ||||
| 4U 1543–47 | 2002; decline | YALO 1.0 m, RXTE | 7.50.5 | 1.550.15 | 4.30.2 | 1, 2 |
| PCA/HEXTE/ASM | ||||||
| XTE | 2000; rise | YALO 1.0 m, RXTE | 5.32.3 | 5.0 | 8.72.1 | 3, 4 |
| J1550–564 | + decline | PCA/HEXTE/ASM | ||||
| GX 339–4 | 2002; rise | YALO 1.0 m, | 8.0 | 3.90.5 | 6 | 5 |
| RXTE PCA/ASM | ||||||
| GX 339–4 | 1999; decline | ATCA1, RXTE PCA | 6 |
1Australia Telescope Compact Array. The distances and extinction estimates are from the references in Tables 2 and 3, except for XTE J1550–564 (Tomsick et al., 2001, 2003b; Kaaret et al., 2003, see text). References for the fluxes used: (1) Buxton & Bailyn (2004); (2) Kalemci et al. (2005); (3) Jain et al. (2001b); (4) Miller et al. (2001); (5) Homan et al. (2005a); (6) Nowak et al. (2005).
For NIR data near quiescence (or close to the lowest NIR fluxes observed from the source) I only include data which are mag above the measured quiescent flux level. This quiescent level is also subtracted from all NIR data so that only the outburst flux remains (the NIR in quiescence is likely dominated by the companion star). The well-sampled NIR quiescent level of XTE J1550–564 is brighter by magnitudes after the 2000 outburst than prior to it (Fig 1a of Jain et al., 2001b). This enhancement could be due to thermal emission from the heated accretion disc, or jet emission.
It is possible that the star or outer regions of the accretion disc are re-emitting X-ray radiation which was absorbed during the outburst. The donor star in XTE J1550–564 (which has spectral type G8 to K4; Orosz et al., 2002) occupies around 10 percent of the solid angle seen by the X-ray source and should absorb percent of the radiation incident on it (Basko & Sunyaev, 1973). Since the outburst gave off ergs and the source brightened by about ergs s-1 in the infrared, it could maintain this brightening for years if all the energy was lost in this infrared waveband. The brightening was present in at least the optical -band too, but the brightening of the broadband optical–infrared spectrum could still be sustained for more than one year, longer than the duration of the quiescent light curve used here. In addition, Orosz et al. (2002) found that the quiescent optical flux level of XTE J1550–564 was lower in May 2001 than before and after the 2000 outburst. The (not-dereddened) base levels of have been subtracted from the data on the hard state rise and subtracted from the hard state decline data. Long-term variations in infrared quiescent levels have been observed in GRO J0422+32, A0620–00 and Aql X–1 (Reynolds et al. 2007; C. Bailyn, private communication).
4.3 Results
The X-ray and NIR light curves of the 2000 outburst of XTE J1550–564 are plotted in Fig. 30 (upper panel; see also Jain et al., 2001b). In both X-ray and NIR light curves there is a break in the relation between luminosity and time on the outburst rise. One explanation for this could be that the point at which the luminosity versus time curve flattens corresponds to the start of the hard/intermediate state, and not to the bona fide hard state. However, this traditionally occurs when the X-ray spectrum begins to soften, which happened about six days after the X-ray break (the first transition dashed line in Fig. 30; see also Miller et al. 2001). We note also that the flattening in the infrared appears to happen a few days before the flattening in the X-rays, and the optical (-band) precedes the NIR (-band) also by days (Jain et al., 2001b). One may expect these delays to reveal a relation between wavelength and delay time, but the order between the wavebands is incorrect for this to be the case; the optical change is followed by the infrared and then X-ray. The reasons for these delays between wavebands are not clear. Uemura et al. (2000) found that the X-rays lagged the optical rise of an outburst of XTE J1118+480 by about 10 days, and interpreted it as an ‘outside-in’ outburst; the optical emission originating from the viscously-heated (as opposed to X-ray heated) accretion disc. In the case here of XTE J1550–564, we would not expect the NIR light to lag the optical, as is observed, if the viscous disc is the origin of the emission.
We have fit exponentials in luminosity versus time for the initial rise data before the break to a shallower slope in both light curves (Fig. 30 upper panel; Fig. 31). These are required to obtain the – relation before the break, as there is little quasi-simultaneous data on the rise but clear luminosity–time relations exist. For the X-ray light curve we have made a fit (with errors since we are extrapolating) to the first four RXTE ASM data points (all have significance). The break appears just after these data in the X-rays and all four points lie very close to the fit. All -band data before the gap at MJD 51634–40 were used for the –time fit.

In Fig. 32 we plot the quasi-simultaneous NIR (or radio) and X-ray luminosities for each source. The luminosity–time fits to the rise of the XTE J1550–564 outburst in NIR and X-ray (Figs. 30 and 31) are used to infer the – relation on the rise for this source before the data are sampled well (propagating the errors from both fits). This fit has a slope where . Interestingly, fitting the data after the aforementioned NIR and X-ray breaks (and before the state transition) in the XTE J1550–564 light curve yields the same slope: .
For GX 339–4 we have NIR rise data and radio decline data from different outbursts (Homan et al., 2005a; Nowak et al., 2005). We therefore cannot compare the normalisations of the rise and decline in this source even if we assume the two outbursts were similar hysteretically; assumptions are required of the radio-to-NIR spectral index. For 4U 1543–47 we have outburst decline data only, but there is an increase in the NIR flux when the source enters the hard state, as is expected from jet emission (Homan et al. 2005a; Paper I).
| Source | Data | Slope |
|---|---|---|
| 4U 1543–47 | soft state | 0.130.01 |
| 4U 1543–47 | hard state decline | 0.5–0.8 |
| GX 339–4 | hard state rise | 0.550.01 |
| GX 339–4 | hard state decline2 | 0.700.06 |
| XTE J1550–564 | hard state rise | 0.690.03 |
| XTE J1550–564 | soft state1 | 0.230.02 |
| XTE J1550–564 | hard state decline | 0.630.02 |
1All soft state data are used for this fit except those above the apparent relation at the beginning and end of the soft state phase (likely to be during state transition). 2The slope here is measured from the five radio data points.
One sees from Fig. 32 that the NIR is enhanced at a given X-ray luminosity on the decline compared to the rise for the only source with both rise and decline data from the same outburst, XTE J1550–564 (based on the extrapolation of the X-ray data on the rise, as explained above). The level of enhancement is dex in NIR luminosity, or a factor of . The NIR luminosity at a given (i.e. the normalisation) also differs between sources; this may reflect distance and/or interstellar absorption uncertainties.

A striking observation from Fig. 32 is the similarity of the slope of the – (or –) relation in the hard state rise and decline between sources. In Table 16 we tabulate the slopes measured for each source. The slope of the relation for 4U 1543–47 and XTE J1550–564 on their declines depends on which hard state data are used, since there is an initial NIR rise after the transition to the hard state. The inferred slope is plotted as a function of the range of data used to measure the fit, in Fig. 33. We use all the data at low X-ray luminosity and impose a cut at a higher X-ray luminosity: . is plotted against log() in Fig. 33. There appears to be a smooth relation between and ; the slope becomes shallower when we include the data at high because of the initial NIR rise as the source declines in . The cut required to measure the – relation once the two wavebands are positively correlated should be at a value of after the NIR begins to drop. At this cut we have –0.8 and for 4U 1543–47 and XTE J1550–564, respectively. From Table 16 we can see that generally, the slopes in the hard state (–0.7) are in agreement with the radio–X-ray and optical/NIR–X-ray correlations found from these and other sources (Corbel et al. 2003; Gallo et al. 2003, 2006; Paper I).
In addition, Fig. 32 shows that all the NIR and radio data we use are suppressed in the soft state, indicating its most likely origin in the hard state is the jet, which is expected to be quenched. In addition, the optical–NIR colours are red () in all three sources in the hard state, indicating optically thin emission (Jain et al., 2001b; Buxton & Bailyn, 2004; Homan et al., 2005a). The optical and NIR luminosity from the viscously-heated accretion disc should vary relatively smoothly across the state transition, as should X-ray reprocessing in the disc unless it largely depends on the hard spectral component (see Chapter 2 for a more detailed discussion of these and other sources). The emission may also not be smooth if it is correlated with , the dimensionless viscosity parameter, and if changes across the transition (see Section 4.4.2). Since we see a stronger soft state quenching in the NIR than in the optical wavebands in our sources (Jain et al., 2001b; Buxton & Bailyn, 2004; Homan et al., 2005a), the longer wavelengths have much larger ratios of jet to disc contributions (this is expected since the spectral index of the jet spectrum is less than that of the disc).
In Table 16 we also state the slopes of the – relations in the soft state for 4U 1543–47 and XTE J1550–564. The theoretically expected slope if the origin of the NIR emission is X-ray reprocessing in the disc is (van Paradijs & McClintock, 1994). The shallower slopes observed are close to those expected if the origin of the NIR emission is the viscously heated disc: (Paper I). Since we are using a finite X-ray energy range (2–10 keV) as opposed to the bolometric X-ray luminosity, may be inaccurate because the fraction of the bolometric X-ray luminosity in this range will change with in the soft state. However, this fraction would have to change by a factor of several during the one dex drop in for to be inaccurate by a factor of –4 (as is required if for X-ray reprocessing). We can therefore conclude from correlation analysis that the viscously heated disc is likely to dominate the NIR in the soft state in these two sources. Homan et al. (2005a) also found this to be the dominating NIR emission process for GX 339–4 in the soft state (from the same data that we use here) since changes in the NIR preceded those in the X-ray by several weeks.
It is unlikely that disc emission contaminating the infrared luminosity plays a substantial role in the observed hysteresis effect in XTE J1550–564 in the hard state, because the separation between the rise and decline parallel tracks is a factor of about five in ; the disc component would have to be dominating the NIR luminosity in the rising hard state for this to be the explanation of the effect. It would then be quite surprising for the colours to change so dramatically at the state transition and would have to be for some other reason than the quenching of the jet. In the decaying hard state of XTE J1550–564, a rise is seen in and as well as in at the time of the state transition, indicating again that the jet power-to-disc power ratio is larger for the decaying hard state than for the rising hard state (see the discussion of the optical ‘reflare’ in Jain et al., 2001b).
4.4 Discussion
In this Section we concentrate mainly on interpreting the hysteresis effect. Nearly all models for jet production suggest that the kinetic power supplied to the relativistic jet will be linearly proportional to the mass accretion rate (e.g. Falcke & Biermann, 1995; Meier, 2001). The observed monochromatic luminosity of the synchrotron self-absorbed part of the jet spectrum will be proportional to the kinetic luminosity of the jet to the 1.4 power (e.g. Blandford & Konigl, 1979; Falcke & Biermann, 1995; Heinz & Sunyaev, 2003). As a result, infrared and longer wavelength fluxes may be expected to be excellent tracers of the mass accretion rate, and would be much less sensitive to changes in the accretion efficiency than at X-ray wavelengths (Körding, Fender & Migliari, 2006). However, in at least one neutron star X-ray binary 4U 0614+09, the NIR jet contribution is optically thin with the break between optically thick and optically thin emission lying further into the mid-infrared (Migliari et al., 2006). For BHXBs, it has been shown that this break lies close to the NIR (Corbel & Fender 2002; Paper I) but may change with luminosity (Nowak et al., 2005).
For a jet being powered from an advection dominated accretion flow (ADAF; Narayan & Yi, 1995), it has been suggested that the relation between and the jet’s kinetic luminosity can also depend on the dimensionless viscosity parameter , and on some fudge factors related to the fact that the standard ADAF treatment of rotational velocities and azimuthal magnetic field strengths are only approximations (Meier, 2001). This assumes that an ADAF produces the X-ray emission. We then find that:
| (1) |
where is the total power injected into the jet, is the mass accretion rate through the disc, and is a correction term which is a function of the black hole spin and the fudge factors which are rolled into .
In the following subsections we use these arguments and discuss possible explanations for the observed hysteresis effect.
4.4.1 Hysteresis traces the radiative efficiency of the accretion flow?
Let us first consider the simplest possible interpretation of the parallel tracks in XTE J1550–564 – that they represent variations in the radiative efficiency in the rising and decaying hard states, with the mass accretion rate being traced perfectly by the infrared flux. Here, we effectively assume that the variations in and the fudge factors are unimportant, as are variations in the radiative efficiency of the jet itself for producing infrared emission. Since both the rising hard state and the decaying hard state are observed to follow the relation (Gallo et al. 2003; 2006), they are both expected to have (a radiatively inefficient flow). At the same time, they are both expected to join to the same soft state solution, which is believed to be a radiatively efficient () geometrically thin accretion disc (Shakura & Sunyaev, 1973). XTE J1550–564 was said to be in an intermediate state between the rise and decline of the 2000 outburst based on timing properties and a power law component in the X-ray spectrum. However, the blackbody flux was always dominant over the power law flux (Miller et al., 2003), and the radio/infrared jet was quenched so for purposes of this work we can treat it as a soft state from its jet properties (see e.g. Fender et al., 2004) in the context of our following analysis. A schematic version of the expected track followed by a hysteretic source is plotted in Fig. 34. We then see that the scenario where is well traced in the hard state by the infrared luminosity and in the soft state by the X-ray luminosity is immediately invalidated as this would require the infrared luminosity to be lower at a given on the decline compared to the rise – the opposite to what is observed. To achieve what is observed, we instead require the jet (NIR) luminosity to evolve as the dot-dashed lines in Fig. 34.

4.4.2 Hysteresis traces ?
Next, let us consider the possibility that is instead sensitive to variations in ( and are linked through equation 1). This is a natural explanation for the different state transition luminosities in the rising and falling hard states; it is found by Esin, McClintock & Narayan (1997), for example, that the state transition luminosity should be 1.3, while it is found by Zdziarski (1998) that the state transition luminosity should scale approximately as . In either of these cases, then, one would qualitatively expect that increasing would increase the state transition luminosity. A similar result, albeit without an analytic approximation for the size of the state transition luminosity, is found by Meyer-Hofmeister, Liu & Meyer (2005), who showed that hysteresis may result from the different efficiencies of hard photons and soft photons in evaporating mass from the thin disc into the corona.
Some of the other hysteresis properties of outbursts seem to be qualitatively consistent with the idea that variations play at least some role. A larger mass density at the onset of an outburst may lead to a higher when the instability is triggered. If this is the case, then it will naturally follow that both the peak luminosity of the outburst, and the luminosity at which the hard-to-soft transition occurs, will be correlated with one another through the connection to , as has been shown (Yu, van der Klis & Fender, 2004).
The radiative efficiency of the hot disc will depend on which – track one chooses, and hence on . In general, the X-ray luminosity is given by , where is the radiative efficiency. For a solution where , then . More specifically, when the two hard state tracks must join onto the same radiatively efficient soft state track, then , where is the mass accretion rate at the critical state transition luminosity (which has one value for the rise track and a different one for the decline). Let us now take a general form for the dependence of this value, . The radiative efficiency of the hot disc will then scale as . As a result, at a given X-ray luminosity will scale as , since in the hard state.
The variations will thus not lead to parallel tracks in versus if the state transition luminosity scales as . The dependence of the jet power extraction efficiency will cancel out exactly with the dependence of the X-ray radiative luminosity. The estimate of the state transition luminosity given by Esin et al. (1997) can therefore be valid only if the fudge factors vary hysteretically or if the radiative efficiency of the jet varies hysteretically. The dependence of the transition luminosity on must be weaker than in order for variations to be solely responsible for the parallel tracks in versus .
The estimate of the state transition luminosity put forth by Zdziarski (1998) does have a weaker than dependence for the state transition luminosity: . This leads to a relation where , a closer match to the observations, but still problematic quantitatively. For a given , the X-ray luminosity is times higher in the rising hard state than the decaying one. The difference between the X-ray luminosity at the hard-to-soft transition compared to the soft-to-hard transition is a factor of about five. If the observations are to be interpreted in terms of variations in only, then either the state transition luminosity must scale slightly weaker than linearly with , or the jet power must scale more strongly than linearly with (e.g. if the fudge factors in the Meier 2001 relation scale with in some way).
4.4.3 Hysteresis traces jet behaviour?
The other alternative is that the spectral shape or the radiative efficiency of the jet may change hysteretically. A test of whether the jet power, or the jet spectrum is the most important factor may come from correlated high resolution timing in the X-rays and OIR bands. It has previously been shown that a negatively lagged anti-correlation of optical emission relative to X-ray emission (Kanbach et al., 2001; Hynes et al., 2003b) can be explained as a result of the jet taking away the bulk of the kinetic luminosity from the accretion flow (Malzac et al., 2004). If the hysteresis effect we see is the result of a different amount of kinetic power being taken away by the jet at the same accretion disc , then there should be a signature in the magnitude of the negatively lagged anti-correlation. We note that observing the spectral changes directly would be preferable, but this is quite difficult due to the convergence around the -band of the optical components from the accretion disc, the donor star, and the jet in most systems (e.g. Homan et al. 2005a; Paper I).
A completely independent emission mechanism does exist for explaining the X-ray emission in X-ray binaries – jet emission (e.g. Markoff et al. 2001; 2005). In this scenario, the observed parallel tracks would form a jet–jet hysteresis as opposed to a jet–inflow (e.g. jet–corona) hysteresis. In the pure jet-synchrotron model (Markoff et al., 2001), the NIR-to-X-ray ratio can change at a given only if either the spectral slope changes, or the break frequency where the jet becomes optically thin changes (see e.g. Nowak et al. 2005 for a discussion of attempts to test the model based on observed spectral shapes). In the more recent, more complicated scenarios, where the corona forms the ‘base of the jet’ (Markoff et al., 2005) there are additional parameters which can change this flux ratio, by changing the fraction of the power that comes from Compton scattering at the base of the jet. Given that the physics of the underlying accretion flow feeding the jet is considerably less developed in these models than for ADAF and related models, there are no quantitative determinations of what should be the state transition luminosities or how the resulting hysteresis in the state transitions should behave. It thus seems premature to comment on whether the observations presented in this paper have any implications for or against the viability of jet X-ray models, but we note that we here provide an additional constraint for such models.
4.4.4 Consequences of the interpretation
These findings indicate, on both observational and theoretical grounds, that there is reason to expect substantial scatter in relations between radio/NIR and X-ray luminosity especially if some of the data points are taken during the rising parts of outbursts. At the present time, it seems that most of the scatter in the relations of Gallo et al. (2003; 2006) and Paper I are due to the uncertainties in the measurements of the masses and distances of the different systems used to make the correlations, however two recently discovered sources could be exceptions (Cadolle Bel et al. 2007; Rodriguez et al. 2007; see also Gallo 2007). As more data is collected for some of the sources (especially GX 339-4), it may become clear that the relation is multiple-valued, and the hysteresis effects will need to be considered.
4.5 Conclusions
Quasi-simultaneous NIR and X-ray data have been collected from BHXBs with well-sampled outburst rises and/or declines. Three sources were found satisfying this criteria. The data confirm the intrinsic correlation between NIR (which we show comes from the jets) and X-ray luminosity; found in the hard state (Homan et al. 2005a; Paper I). In the soft state, there is evidence for the NIR emission to be dominated by the viscously heated (as opposed to X-ray heated) accretion disc in all three sources, with observed in two of the three. The emission processes that can explain the NIR–X-ray relations (and the X-ray state-dependent OIR colours) in this Chapter are shown in Table 17.
The normalisation of the hard state correlation can differ with time for a single source. The infrared flux in the 2000 outburst of XTE J1550–564 shows a hysteresis effect, in that the rising hard state has a lower infrared flux at a given X-ray flux than the decaying hard state. Several theoretical explanations for this effect seem plausible, and have direct implications for the accretion process, jet power and the dominating X-ray emission processes. We have ruled out the possibility that the hysteresis is directly caused solely by different radiative efficiencies in the inner accretion flow on the rise and decline. The effect may be due to changes in the viscosity parameter and/or shifts in the spectrum/radiative efficiency of the jet.
| Sample | X-ray | Jet emission | Jet emission | Viscous |
|---|---|---|---|---|
| reprocessing | (opt. thin) | (opt. thick) | disc | |
| BHXBs; NIR; hard state | ||||
| BHXBs; NIR; soft state |
Hopefully, these results will help motivate future observational searches for more examples of jet-disc hysteresis effects and more theoretical work which might help to understand whether the disc viscosity parameter should vary as a function of time over X-ray binary outbursts.
Little OIR data are published from the rise of X-ray transient outbursts since this requires a monitoring campaign; it has been shown that the OIR counterpart begins to rise before the X-ray detection at least in some cases (e.g. Jain, 2001; Jain et al., 2001b). Consequently, the behaviour of the OIR rise is not understood as well as the declines. I, with Fraser Lewis, Rob Fender and Paul Roche am currently carrying out an optical monitoring project of a dozen or so quiescent LMXBs using the 2.0 m Faulkes Telescope North and South (Lewis et al., 2006) in order to spot and track LMXB outbursts and to alert the community, before they are detected at X-ray energies. As of September 2007, two outbursts have been detected, of Aql X–1 – a source which has frequent outbursts and one which is also being monitored (more regularly) by the Yale team (Maitra & Bailyn, 2007). With the Yale team we prepared an Astronomer’s Telegram (Maitra et al., 2007) to encourage the community to make multiwavelength follow-up observations of the bright September 2007 outburst. Most of the sources we are monitoring are not being covered by other teams, and have less frequent outbursts. In a future work we plan to publish our results, including variability analysis of a number of sources in quiescence.
5 NIR Polarimetry
5.1 Introduction
The results of Chapters 2, 3 and 4 indicate that the NIR (and sometimes optical) emission of LMXBs, in particular the black hole systems, is dominated by optically thin synchrotron emission from the jets. This component is identified by its characteristic spectral shape and its relations with other wavebands. However, similar spectral indices and correlations can sometimes be reproduced by other components – a low-temperature blackbody (accretion disc or companion star) peaks in the IR and therefore has a negative OIR spectral index (this would only be seen at low luminosities), and OIR emission from X-ray reprocessing has a similar dependency on X-ray luminosity to OIR jet emission (Chapter 2). There is one characteristic of optically thin synchrotron emission which is predicted to be very different from the other OIR components in an LMXB – strongly polarised emission (Chapter 1).
A strong detection of linearly polarised OIR light would be a diagnostic of optically thin synchrotron emission from a region whose magnetic field is to some extent ordered. A non-detection would not rule out optically thin synchrotron emission, but constrain its magnetic field structure if present. Not only is polarisation a powerful tool to constrain the contribution of the jet at these frequencies, it can also probe the local conditions of the jets, namely the degree of ordering and orientation of the magnetic field. Here, linear polarimetric observations of eight XBs have been obtained using the 8 m VLT and the 3.8 m United Kingdom Infrared Telescope (UKIRT) in order to constrain the origin of the emission and the level of ordering of the jet magnetic field. Seven of the eight targets are observed in NIR filters and the other, in optical filters. This work was completed by myself and Rob Fender only; any occurrences of ‘we’ refer to these persons. At the time of writing, this work is submitted for publication (Paper VI).
5.2 Observations
In an effort to identify the polarised signature of jets in the infrared, the best suited sources and telescopes were selected. The evidence for optically thin emission from the jet in the NIR (and hence our best chance of detecting high levels of LP) comes mainly from BHXBs in outburst in the hard state (e.g. Homan et al., 2005a; Hynes et al., 2006b) and low-magnetic field NSXBs that are active (Migliari et al. 2006; Chapters 2 and 3). However in these earlier Chapters it was proposed that the jet may also contribute or dominate the NIR flux in some quiescent BHXBs, but probably not in quiescent NSXBs. Consequently, we obtained observations of both outbursting and quiescent sources.
5.2.1 Target selection
| Source | Date | MJD | Source | Exposure times | Airmass | ||
| activity | (sec) | ||||||
| VLT + FORS1 | |||||||
| GX 339–4 | 22 Aug 2005 | 53604.1 | L | 264 | 264 | 264 | 1.19–1.26 |
| GX 339–4 | 24 Aug 2005 | 53606.0 | L | 264 | 264 | 264 | 1.14–1.18 |
| GX 339–4 | 31 Aug 2005 | 53613.0 | L | 264 | 264 | 264 | 1.13–1.17 |
| GX 339–4 | 12 Sep 2005 | 53625.0 | L | 264 | 264 | 264 | 1.16–1.23 |
| GX 339–4 | 19 Sep 2005 | 53632.0 | L | 264 | 264 | 264 | 1.20–1.28 |
| Hiltner 652 | 19 Sep 2005 | 53632.0 | PS | 2 | 2 | 2 | 1.03–1.04 |
| VLT + ISAAC | |||||||
| GRO J1655–40 | 14 Oct 2005 | 53657.0 | H | 56 | 1.52 | ||
| GRO J1655–40 | 28 Oct 2005 | 53671.0 | H | 32 | 56 | 80 | 2.05–2.13 |
| WD 2359–434 | 28 Oct 2005 | 53671.0 | US | 14 | 14 | 14 | 1.16–1.17 |
| UKIRT + UIST | |||||||
| XTE J1118+480 | 15 Feb 2006 | 53781.5 | Q | 2880 | 1440 | 1.13–1.25 | |
| Sco X–1 | 15 Feb 2006 | 53781.6 | P | 332 | 328 | 328 | 1.27–1.48 |
| Sco X–1 | 16 Feb 2006 | 53782.6 | P | 96 | 84 | 84 | 1.37–1.52 |
| WD 1344+106 | 17 Feb 2006 | 53783.5 | US | 720 | 1.49–1.58 | ||
| XTE J1118+480 | 17 Feb 2006 | 53783.5 | Q | 2880 | 1.13–1.15 | ||
| Sco X–1 | 07 Mar 2006 | 53801.6 | P | 332 | 328 | 328 | 1.24–1.27 |
| SS 433 | 07 Mar 2006 | 53801.6 | P | 24 | 1.49–1.53 | ||
| HD 38563C | 08 Mar 2006 | 53802.3 | PS | 47 | 1.42–1.48 | ||
| Sco X–1 | 08 Mar 2006 | 53802.6 | P | 96 | 84 | 84 | 1.37–1.52 |
| WD 1615-154 | 08 Mar 2006 | 53802.6 | US | 720 | 1.23–1.24 | ||
| SS 433 | 19 Aug 2006 | 53966.5 | P | 24 | 1.79–1.84 | ||
| GRO J0422+32 | 19 Aug 2006 | 53966.6 | Q | 2160 | 2160 | 1.17–1.30 | |
| Aql X–1 | 20 Aug 2006 | 53967.3 | F | 720 | 720 | 1.06–1.10 | |
| Aql X–1 | 08 Oct 2006 | 54016.4 | Q | 1680 | 1.51–1.88 | ||
| 4U 0614+09 | 08 Oct 2006 | 54016.7 | LP | 480 | 1.02 | ||
| Aql X–1 | 11 Oct 2006 | 54019.2 | Q | 2160 | 2160 | 1.07–1.21 | |
MJD = Modified Julian Day; Exposure times are total on-source integration time. Source activity: F = fading from mini outburst; H = hard state; L = low luminosity state; LP = low, persistent state; P = persistent; PS = polarised standard; Q = quiescent; US = unpolarised standard.
GX 339–4 undergoes quasi-regular outbursts of varying length and peak luminosity. The infrared jet of GX 339–4 is one of the most studied, and the NIR spectrum in the hard state is consistent with optically thin synchrotron emission (Corbel & Fender, 2002; Homan et al., 2005a). This spectral component is observed to join to a thermal spectrum in the optical, with the two components producing half of the flux each around the -band. We were allocated VLT imaging polarimetry with FORS1 (optical) for these observations (ESO Programme ID 076.D-0497). The 2005 outburst of GRO J1655–40 was studied at X-ray, optical and radio wavelengths (e.g. Shaposhnikov et al., 2007). On the outburst decline the source entered the hard state (Homan et al., 2005b) so NIR imaging polarimetry was obtained with a Director’s Discretionary Time (DDT) proposal with ISAAC (ESO Programme ID 275.D-5062).
In addition to outbursting sources, a number of quiescent and persistent sources were selected for NIR polarimetry. Target selection of quiescent systems was based on known NIR magnitudes and the companion star contribution, where measured. For example, the companion in the A0620–00 system is known to contribute % of the -band quiescent flux (Shahbaz, Bandyopadhyay & Charles, 1999). Even if a polarised jet provides the remaining 25% (as opposed to the disc), the level of LP would be dampened by a factor of 4 due to the unpolarised light from the star. Most NIR-bright BHXBs are dominated by their companion stars in quiescence (e.g. V404 Cyg; Casares et al., 1993) but there are some good candidates (e.g. XTE J1118+480 and in outburst, GRS 1915+105). Three NSXBs are also good candidates to identify a NIR jet component. Optically thin synchrotron emission appears to join to the thermal disc spectrum in the NIR in the NSXB 4U 0614+09 (Migliari et al., 2006). Sco X–1 is the brightest () of the Z-sources, a class of NSXB whose jet spectrum may significantly contribute to the NIR. Aql X–1 is very active (it has about one outburst per year) and has a NIR spectrum in outburst consistent with a jet origin (Chapter 3).
The observations used in this Chapter are listed in Table 18. For all three instruments (on two telescopes) imaging polarimetry is obtained using a Wollaston prism inserted in the optical path. The light is split into simultaneous, perpendicularly polarised ordinary and extra-ordinary beams (o- and e-beams). The waveplate was rotated to four angles: 0∘, 22.5∘, 45∘ and 67.5∘; this achieves a higher accuracy of LP and PA than from just two angles 0∘ and 45∘. The flux of the source was then measured in the o- and e-beams for each prism angle (, , , , etc.) using aperture photometry in IRAF and LP and PA were calculated using the ‘ratio’ method from the Stokes parameters and thus:
| (2) | |||
| (3) | |||
| (4) | |||
| (5) |
Flux calibration was possible for most of the targets. The total flux of each source was estimated from the sum of the o- and e-beam fluxes at each angle. Magnitudes were converted to de-reddened flux densities by accounting for interstellar extinction. As with the earlier Chapters, the method of Cardelli, Clayton & Mathis (1989) was adopted, and the known values of were used for each source (Table 19).
| Source | Reference | |
|---|---|---|
| GRO J0422+32 | 0.740.09 | Gelino & Harrison (2003) |
| 4U 0614+09 | 1.410.17 | Nelemans et al. (2004) |
| XTE J1118+480 | 0.053 | Chaty et al. (2003) |
| Sco X–1 | 0.700.23 | Vrtilek et al. (1991b) |
| GRO J1655–40 | 3.70.3 | Hynes et al. (1998) |
| GX 339–4 | 3.90.5 | Jonker & Nelemans (2004) |
| Aql X–1 | 1.550.31 | Chevalier et al. (1999) |
| SS 433 | 6.50.5 | Fukue et al. (1997) |
5.2.2 ESO VLT observations and reduction
The VLT FORS1 Service Mode programme 076.D-0497 was carried out between 22 August and 19 September 2005. The target GX 339–4 was observed on five nights in Bessel , and filters, and the polarised standard star Hiltner 652, on one night (see Table 18 for observations and Table 20 for the results). The seeing ranged from 0.48 to 2.09 arcsec, with a mean of arcsec. The conditions were clear on all nights and photometric on three of the five. Using IRAF, the science images were de-biased and flat-fielded and aperture photometry was performed on GX 339–4 and three stars in the FOV. The point spread function (PSF) of GX 339–4 was found to be blended with two close stars (B and C in Shahbaz et al., 2001). We therefore could not measure small differences in the flux of GX 339–4 alone; we used an aperture which encompassed the PSFs of the contaminating stars. GX 339–4 contributes % of the total flux of this aperture during our observations. If the target is polarised and the contaminating stars are not then the flux from them will dampen the LP measurements.
From the background-subtracted photometry I obtained the Stokes parameters and (equations 2 and 3), and the variability of the total (o + e) flux across the four prism angles. Instrumental polarisation is documented to be less than 0.1% for FORS1. To calibrate the PA, the standard small FORS1 corrections of , where , and were made for the , and filters, respectively. For Hiltner 652, only two prism angles were obtained so and were calculated from these two angles alone (and no variability is quoted). I measure LP% for this polarised standard in , consistent with that quoted by the FORS consortium based on Commissioning data taken with FORS1. Unfortunately Hiltner 652 was slightly saturated in and , and the values of LP are lower than expected. The measured PA in all three filters is at most different from the documented values.
No flux standard stars were observed but the magnitude of GX 339–4 was estimated using four stars in the FOV that are listed in the NOMAD and USNO-B Catalogues (Zacharias et al., 2004; Monet et al., 2003). The magnitudes of these field stars range from , to , . These flux measurements do not require the high level of sensitivity needed for polarimetry, so the magnitude of GX 339–4 alone was estimated (not including the contaminating stars B and C) using a circular aperture of fixed radius centred on GX 339–4. The aperture excludes most of the light from B and C. The 1 errors in the estimated magnitudes of GX 339–4 are inferred from the range of magnitudes implied by each of the four field stars.
GRO J1655–40 was observed on 14 and 28 October 2005 under VLT ISAAC DDT programme 275.D-5062 (Tables 18 and 20). Short wavelength (SW) imaging polarimetry was carried out with (1.25 m), (1.65 m) and (2.16 m) filters. The seeing was 0.71–1.58 arcsec and conditions were photometric on both nights. The unpolarised standard star WD 2359–434 was also observed on 28 October. Data reduction was performed in IRAF; dark frames of equal exposure time to the science frames were subtracted to remove sky background. The science images were then flat-fielded and bad pixels were accounted for.

The Stokes parameters (and the variability of the total flux) were calculated for GRO J1655–40 and two nearby field stars of similar brightness. In Fig. 35, the measured LP is plotted as a function of the confidence of the measurement. The field stars are not polarised (2) except one observation of 1–2% LP, which is probably interstellar in origin. Where the S/N is high enough (Table 20), LP is detected in GRO J1655–40 at a level of 5–6%, with 3 confidence. The absence of this polarisation in the field stars implies it is intrinsic to GRO J1655–40 and not due to instrumental polarisation. It is also too high to be of interstellar origin because the extinction is too low. Serkowski’s law; (Serkowski, Mathewson & Ford, 1975) indicates that the maximum LP caused by interstellar dust in the optical is 12.0% for GRO J1655–40, adopting the extinction upper limit of (Table 19). In the -band, , so % – much lower than is observed. In addition Dubus & Chaty (2006) measured % during quiescence, so the measured LP must be transient.
An unpolarised standard, WD 2359–434 was also observed. No LP is detected in WD 2359–434 except a low level (%) in the -band, which is likely due to instrumental polarisation. The -band values of and for WD 2359–434 were then subtracted from those of GRO J1655–40 to correct for this. No additional systematic correction to the values of PA are required for ISAAC. WD 2359–434 (, , ) was also used to calibrate the flux of GRO J1655–40. Atmospheric extinction was accounted for because the standard star and X-ray binary were observed at different airmasses.
| Source | MJD | Fil- | S/N | app. | LP | PA (∘) | Conf. | Variabi- | ||
| ter | mag. | (mJy) | (%) | () | lity (%) | |||||
| (I) | (II) | (III) | (IV) | (V) | (VI) | (VII) | (VIII) | (IX) | (X) | |
| VLT + FORS1 observations1: | ||||||||||
| GX339 | 53604.1 | 846 | 18.80(06) | 4.19(24) | 2.15(17) | 27.4(4.5) | 12.8 | 3.2(3) | ||
| GX339 | 53604.1 | 592 | 18.70(42) | 2.05(79) | 2.45(24) | 36.4(5.6) | 10.3 | 1.5(4) | ||
| GX339 | 53604.1 | 1630 | 17.65(21) | 2.07(40) | 1.78(9) | 34.1(2.8) | 20.5 | 1.9(1) | ||
| GX339 | 53606.0 | 127 | 18.61(17) | 5.00(77) | 5.6(1.8) | |||||
| GX339 | 53606.0 | 80 | 18.52(40) | 2.38(88) | 26(3) | |||||
| GX339 | 53606.1 | 95 | 17.46(11) | 2.47(26) | 29(2) | |||||
| GX339 | 53613.0 | 237 | 18.68(17) | 4.66(73) | 2.98(60) | 24(12) | 5.0 | 6.8(9) | ||
| GX339 | 53613.0 | 104 | 18.67(40) | 2.07(76) | ||||||
| GX339 | 53613.0 | 73 | 17.41(12) | 2.58(27) | ||||||
| GX339 | 53625.0 | 454 | 18.56(11) | 5.21(54) | 2.02(31) | 34.3(8.9) | 6.5 | 1.6(5) | ||
| GX339 | 53625.0 | 750 | 18.49(40) | 2.46(89) | 2.86(19) | 34.3(3.8) | 15.2 | 2.3(3) | ||
| GX339 | 53625.0 | 432 | 17.54(15) | 2.31(31) | 2.33(33) | 38.9(8.0) | 7.1 | 4.1(5) | ||
| GX339 | 53632.0 | 659 | 18.93(17) | 3.71(58) | 2.10(21) | 24.9(5.9) | 9.8 | 2.2(3) | ||
| GX339 | 53632.0 | 429 | 18.87(40) | 1.72(64) | 2.90(33) | 31.3(6.5) | 8.8 | 2.7(5) | ||
| GX339 | 53632.0 | 355 | 17.68(12) | 2.02(22) | 2.57(40) | 27.1(8.9) | 6.5 | 2.5(6) | ||
| H652 | 53632.0 | 21000 | 6.19(1) | 176.2(1) | 924 | - | ||||
| H6522 | 53632.0 | 32000 | 4.79(1) | 176.9(1) | 1088 | - | ||||
| H6522 | 53632.0 | 26000 | 3.54(1) | 178.6(1) | 644 | - | ||||
| VLT + ISAAC observations: | ||||||||||
| J1655 | 53657.0 | 93 | 12.95(12) | 11.8(1.3) | 4.72(1.52) | 44(18) | 3.1 | |||
| J1655 | 53671.0 | 48 | 13.76(13) | 12.4(1.5) | ||||||
| J1655 | 53671.0 | 22 | 13.01(16) | 11.2(1.6) | ||||||
| J1655 | 53671.0 | 75 | 12.62(12) | 8.04(91) | 5.82(1.88) | 157(18) | 3.1 | 6.9(3.0) | ||
| 2359 | 53671.0 | 210 | 2.04(69) | 153(19) | 3.0 | |||||
| 2359 | 53671.0 | 72 | ||||||||
| 2359 | 53671.0 | 56 | ||||||||
1Polarisation measurements of GX 339–4 include the contaminating stars B and C (Shahbaz et al., 2001) in the aperture; 2Standard star is slightly saturated, which has reduced the apparent LP level detected. Columns give: (I) Source name (see Table 18 for full names); (II) MJD; (III) filter (waveband); (IV) S/N detection of the source; (V) apparent magnitude; (VI) de-reddened flux density; (VII) measured level of polarisation and error, or upper limit if the detection of polarisation is ; (VIII) polarisation angle and error; (IX) confidence of polarisation detected; (X) the standard deviation of the total (sum of o- and e-beam) source intensity as a percentage (/) and error, or upper limit if the variability detection is .
| Source | MJD | Fil- | S/N | app. | LP | PA (∘) | Conf. | Variabi- | |
|---|---|---|---|---|---|---|---|---|---|
| ter | mag. | (mJy) | (%) | () | lity (%) | ||||
| (I) | (II) | (III) | (IV) | (V) | (VI) | (VII) | (VIII) | (IX) | (X) |
| J0422 | 53966.6 | 3.5 | 17.42(42) | 0.072(28) | |||||
| J0422 | 53966.6 | 44 | 18.36(16) | 0.083(12) | |||||
| 0614 | 54016.7 | 37 | 16.64(19) | 0.158(28) | |||||
| J1118 | 53781.5 | 91 | |||||||
| J1118 | 53781.6 | 66 | |||||||
| J1118 | 53783.5 | 28 | |||||||
| ScoX1 | 53781.6 | 3000–3900 | 0.34–0.53 | 22–87 | 9.3–11.5 | 0.87–1.3 | |||
| ScoX1 | 53781.7 | 3000–4500 | 0.30–0.57 | 27–88 | 6.4–18.3 | 1.0–1.9 | |||
| ScoX1 | 53781.6 | 1600–2900 | 0.13–0.52 | 71–86 | 2–10.7 | 1.5–4.5 | |||
| ScoX1 | 53782.6 | 2000 | 0.36(7) | 37(12) | 5.0 | 0.53(11) | |||
| ScoX1 | 53782.6 | 2000 | 0.18(7) | 49(23) | 2.5 | ||||
| ScoX1 | 53782.6 | 1600 | 0.23(9) | 41(23) | 2.5 | ||||
| ScoX1 | 53801.6 | 1100–2000 | 0.30–0.65 | 36–95 | 2.4–6.9 | 0.44–1.4 | |||
| ScoX1 | 53801.6 | 1200–2000 | 0.07–0.54 | 36–49 | 2–7.7 | 0.45–0.57 | |||
| ScoX1 | 53801.6 | 1000–2000 | 0.35–0.91 | 96–111 | 2.6–5.0 | 0.33–0.41 | |||
| ScoX1 | 53802.6 | 1600 | 0.40(9) | 46(13) | 4.4 | 0.44(14) | |||
| ScoX1 | 53802.6 | 700 | |||||||
| ScoX1 | 53802.6 | 600 | |||||||
| AqlX1 | 53967.3 | 88 | 16.30(15) | 0.63(9) | |||||
| AqlX1 | 53967.4 | 41 | 15.47(16) | 0.46(7) | |||||
| AqlX1 | 54016.4 | 28 | 15.56(22) | 0.42(9) | |||||
| AqlX1 | 54019.2 | 19 | 16.65(29) | 0.46(12) | |||||
| AqlX1 | 54019.2 | 27 | 16.06(25) | 0.45(10) | |||||
| SS433 | 53801.6 | 4600 | 9.06(8) | 1950(140) | 0.75(3) | 71(2) | 24.4 | 0.27(5) | |
| SS433 | 53966.5 | 4000 | 8.89(19) | 2290(400) | 0.50(4) | 76(4) | 14.1 | 0.47(6) | |
| 1344 | 53783.5 | 500 | |||||||
| HD38 | 53802.3 | 2100 | 5.56(7) | 84.2 | |||||
| 1615 | 53802.6 | 370 | |||||||
5.2.3 UKIRT observations and reduction
The UKIRT targets were observed (see Table 18 for observations and Table 21 for results) between 15 February and 11 October 2007 by the UKIRT Service Observing Programme (UKIRTSERV). polarimetric observations were made using UIST + IRPOL2. The conditions were mostly clear during the observations (and the seeing was 0.4–1.0 arcsec) but thin cirrus was present on some dates. The POL_ANGLE_JITTER standard recipe was adopted except flat field images were not taken. After dark current and bias subtraction, the flux from the target was measured in a fixed aperture (the same pixels in all images for each source). Since we are dividing the fluxes in these fixed apertures (e.g. ; equation 2) the flat fields would cancel out, so skyflats were not required.
The instrumental polarisation is known to be low (%), which is confirmed by the non-detection of LP from the two unpolarised standards WD 1344+106 and WD 1615-154 (Table 21). The PA was calibrated using the polarised standard HD 38563C; I caution that there may be systematic errors in PA due to just the one calibrator being available. No flux standards were observed, however relative photometry of two stars in the FOV was used (sum of o+e beams) that are listed in the 2MASS catalogue, for each target. For XTE J1118+480 and Sco X–1, no field stars exist in the images that have 2MASS magnitudes, so no flux calibration could be achieved. The polarisation standards could not be used for flux calibration as conditions were not photometric in all observations.
5.3 Results & Discussion
A significant level (3) of LP is detected in four sources: GX 339–4, GRO J1655–40, Sco X–1 and SS 433. Two of these four (GRO J1655–40 and Sco X–1) have intrinsic LP in the NIR which is most likely caused by optically thin synchrotron emission from the inner regions of the jets. SS 433 is polarised in the NIR due to local scattering and GX 339–4 is polarised in the optical most likely due to interstellar dust along its line of sight. The other four sources are not polarised, with 3 upper limits of 5–15% (it is not possible to detect lower levels of LP in most quiescent systems due to the low S/N). Here, I discuss the results for each individual source.
5.3.1 Individual sources
GX 339–4:
This source was observed on five occasions spanning 28 days during a low luminosity state soon after its 2004–5 outburst. LP is detected at a level of 2–3% in GX 339–4 (which includes the two close contaminating stars, see Section 5.2.2) in all three optical filters in all data with a high S/N (Table 20). From all the polarisation measurements, an average LP of 2.4% in detected. In Fig. 36, LP is plotted as a function of PA for GX 339–4 (including the contaminating stars; upper panel) and three other stars in the FOV (lower panel). Both LP and PA for GX 339–4 are similar to those measured from the field stars, with the values of PA differing for a few field star observations. This is a strong indication that the polarisation in all sources (including the contaminating stars B and C) is caused by the same process, interstellar dust. Moreover, significant variability of LP is not detected. The extinction towards GX 339–4 has been measured at (Jonker & Nelemans, 2004) which is high enough to explain the observed polarisation. Indeed, the extinction can be constrained from the measured level of LP using Serkowski’s law, (Serkowski et al., 1975). We find that , which does not refine the currently estimated value of . The axis of the resolved radio jet of GX 339–4 (Gallo et al., 2004) is at 116∘, approximately perpendicular to the PA of LP in GX 339–4, however there is no indication that the two are linked, for the above reasons.


The magnitudes obtained of GX 339–4 alone (, , ; not including the contaminating stars) are similar to the and magnitudes measured a month or so earlier (C. Bailyn, private communication) but are 1.5 magnitudes brighter than the lowest level of (Shahbaz et al., 2001). Even at this lowest level the star in the GX 339–4 system contributes % of the -band emission (Shahbaz et al., 2001). The de-reddened optical SED of GX 339–4 for the five observations are shown in Fig. 37. The spectrum is blue and fairly steep between and ( between and ) indicating thermal emission, probably from the X-ray heated disc. However there is tentative evidence for a flattening towards the -band. This could be the same -band flattening as seen during outburst, which is the optically thin jet spectrum beginning to dominate (Corbel & Fender, 2002; Homan et al., 2005a). If so, the detection of the jet in the -band at these low luminosities suggests the break frequency in the jet spectrum (between optically thick and thin emission) does not appear to change substantially with mass accretion rate. The -band flux errors are large however, and there may be no flattening. We may expect to see short timescale flux variability if the jet does play a role; GX 339–4 varies by % in the high S/N observations (column X of Table 20), and the variability is not stronger in the -band. We cannot therefore make any conclusions as to whether the jet component is polarised or not; the jet contribution to the -band at these low flux levels is likely to be low. It is interesting to note that the optically thin radio jet ejecta seen from this source are polarised at a level of 4–9% (Gallo et al., 2004). A polarisation spectrum (LP versus ) is not plotted for GX 339–4 because we find no relation between P and for GX 339–4 or for any of the field stars, within the errors of each measurement.
GRO J1655–40:
% LP is detected in this source at the 3 level in and , when it was in a hard state at the end of its 2005 outburst. In the upper panel of Fig. 38 the polarisation spectrum is plotted, including the optical measurements of Gliozzi et al. (1998) during a soft state in 1997. The optical polarisation, which varies as a function of orbital phase (taken in outburst during a soft X-ray state), is caused by local scattering and should decrease at lower frequencies. A statistical increase is seen in LP in the NIR (shown by the fit to the optical–NIR data) which must therefore have a different origin to the optical LP. The -band LP of 5.81.9% is not consistent with the 95% confidence upper limit of LP1.3% in seen during quiescence (Dubus & Chaty, 2006). The NIR LP must be intrinsic and transient, and we interpret it as originating from the optically thin region of the jets.
The PA of the optical LP (120–130∘) is also different from that measured both in (44) and (157). Rotation of PA with time is seen in some jets (e.g. Hannikainen et al., 2000; Fender et al., 2002; Gallo et al., 2004) indicating an overall rotation of the local magnetic field. The LP detection is 14 days after the , implying the magnetic field may be rotating during this time. The -band PA is consistent with the direction of the jet on the plane of the sky; 47∘ (Hjellming & Rupen, 1995), implying that the electric field vector is parallel to the jets at this time and the magnetic field is perpendicular to the jets. Two weeks later the field orientation had appeared to change by . Interestingly, Hannikainen et al. (2000) found from well-sampled radio data that the field orientation of discrete ejection events (as opposed to the steady, compact jet) changed only near the end of the 1994 outburst; here a change is also seen in the compact jet at the end of its 2005 outburst.
The de-reddened flux densities of GRO J1655–40 indicate a blue spectrum, and are similar to those measured by Migliari et al. (2007) between two and five weeks earlier. In their Fig. 6, the broadband SED shows the companion star dominating the optical and NIR, with the jet dominating only below Hz. The observations here are therefore also dominated by the star. According to the model in Fig. 6 of Migliari et al. (upper panel), the jet contributes % and % of the emission in and , respectively. If the jet is the source of the polarisation and the star and any other contributions are not polarised, this implies the jet itself is % polarised in and % polarised in . We would not expect this level of LP from the optically thick jet, so the jet spectrum must turn over to become optically thin () at some frequency above Hz (contrary to the models of Migliari et al., 2007). If we take the faintest possible NIR jet scenario, one where the turnover is at Hz and the optically thin spectrum is steep (), the jet would contribute 14% of the light at and 9% at . This would result in a jet LP of % in and % in . The likely level of jet contribution is between the two above estimates, so a jet LP of 15–42% in and 16–52% in can explain the data. These results indicate a fairly ordered magnetic field, with from the -band result (The -band is less constraining).


In addition, the flux from GRO J1655–40 is marginally variable in (73% standard deviation; column X of Table 20) on short timescales ( sec time resolution). If the star is not variable then this suggests the jet component is varying by 9–43%. Large-amplitude variability has been seen associated with NIR optically thin synchrotron emission from the jets in XTE J1118+480 (Hynes et al., 2006b).
GRO J0422+32:
The apparent magnitudes and colour of this source are found to be consistent with the quiescent values measured by Gelino & Harrison (2003). The S/N is low; we are able to place a 3 upper limit on the -band polarisation; LP11.6%. It has been shown that the star likely dominates the NIR light (Gelino & Harrison, 2003) although recent observations detect a strong flickering component which may come from the disc (Reynolds et al., 2007).
4U 0614+09:
This NSXB is detected with a -band magnitude brighter than reported from observations made in 2002. The system is an ultra-compact NSXB whereby the white dwarf donor has not directly been detected. Migliari et al. (2006) showed that the mid-IR spectrum is dominated by optically thin synchrotron emission from the jets (with ), and this joins the disc component () around the -band. Therefore our -band measurement is likely to be jet-dominated. Despite this, LP is not detected, with a 3 upper limit of 16%. According to the spectrum in Migliari et al. (2006), the jet contributes around twice as much light as the disc in the -band. Assuming that the accretion disc contributes less than 40% of the -band light, the jet component must be less than 27% polarised. The corresponding magnetic field ordering is .
XTE J1118+480:
The polarisation spectrum of this source, including optical data from Schultz et al. (2004) is shown in the middle panel of Fig. 38. Schultz et al. claim the LP is variable (with a positive detection in some optical bands but not in others) and their strongest detection (2.6) is in the -band; LP = 0.570.22%. There is no apparent increase at higher frequencies, with a -band upper limit of 0.38% (3) so the positive detection is unlikely to be due to interstellar dust (the extinction is very low; see Table 19). The upper limits are on the order of 7% LP in and . According to a recent study of the broadband quiescent spectrum of XTE J1118+480 (using for the first time optical, NIR and mid-IR data; Gallo et al., 2007), the jet could make a significant contribution to the mid-IR–optical spectrum. In their model (middle right panel of their Fig. 3), the jet contributes approximately 35%, 25% and 28% of the flux in , and , respectively. From the polarisation measurements, this would correspond to a jet LP of % (), % () and 2.00.8% (). This is by no means a solid result, but the -band detection suggests the jet does indeed contribute. The accretion disc is also likely to make a contribution to at least the optical wavebands (Mikołajewska et al., 2005) but other origins of LP such as scattering are likely to be stronger at higher frequencies, contrary to observations (Schultz et al., 2004).
Sco X–1:
The optical light of Sco X–1 is polarised at a low level due to interstellar dust (Landstreet & Angel, 1972; Schultz, Hakala & Huovelin, 2004) but there is one claim that it is variable and therefore intrinsic (Shakhovskoi & Efimov, 1975). Recent NIR spectropolarimetry has revealed intrinsic LP in the and region of the spectrum, with a clear increase in LP below 1.4 Hz that is interpreted as coming from the (optically thin) jet (Shahbaz et al., 2007). Here, we report polarimetry over four epochs that shows a clear variability of LP which is stronger at lower frequencies (Fig. 39). The optical data and interstellar model fit of Schultz et al. (2004) is included (much like Fig. 3 of Shahbaz et al., 2007). The NIR LP cannot be explained by the interstellar model because it is significantly greater than that expected, and variable. The -band data are all consistent with the model, whereas only two of the six -band measurements agree.

Z-sources like Sco X–1 have the signature of OIR colours and correlated (with X-ray) variability typical of an irradiated accretion disc (e.g. McGowan et al. 2003; Chapters 2 and 3). They also have a radio counterpart, likely from the jet (e.g. Migliari & Fender, 2006)555Some interpretations prefer an origin located in the neutron star magnetosphere (e.g. Paizis et al., 2006), but in Sco X–1 the jet is clearly resolved (Fomalont et al., 2001)., the spectrum of which may extend to the NIR, but is generally fainter than the disc in this regime (Chapters 2 and 3). The variable and -band LP strongly suggest the jet is present. The low level (maximum LP 1.0%) does not rule out optically thick emission, which can produce this level. The LP levels here largely agree with those of Shahbaz et al.; at the -band central frequency they measure LP = 0.5–1.3% whereas our levels range from LP = 0.13–0.91%, and at they measure LP = 0.2–0.7% and we have LP levels between 0.07% and 0.57%. Shahbaz et al. show the LP could increase to up to % in the mid-IR. Here, it is shown that the LP is highly variable and sometimes absent, suggesting either the conditions in the inner regions of the jet are variable, or the jet luminosity (and hence LP) is changing with time, perhaps correlated with the Z-track.
Interestingly, the PA of the most significant LP detections is -, differing from a PA of when the level is consistent with the interstellar model (Fig. 40). is also the PA of the interstellar polarisation measured in the optical, further confirming the origin of the NIR LP is likely to be interstellar when its level is consistent with the model. The resolved radio jets (Fomalont et al., 2001) are in a direction (which is constant over many years) on the plane of the sky different from the PA of the polarised NIR jet. There may be systematic errors in the measurements of PA (Section 5.2.3) but the fact that the low-LP measurements of this source are consistent with the interstellar model suggest these errors are low. Shahbaz et al. (2007) measured a slightly different PA to us; 116–147∘ which is perpendicular to the jet axis, indicating a magnetic field aligned with the jet.
The total flux of Sco X–1 (which is uncalibrated) is generally variable by %. Any jet component is likely to be variable so this suggests a low jet contribution. If this is the case, the jet must be % polarised, and so it must be coming from the optically thin region. It would be interesting to use simultaneous X-ray data in a future study, to test whether the LP (and flux) is correlated with the position on the Z-track.
Aql X–1:
An optical polarimetric study of this source was carried out by Charles et al. (1980) who found LP 1.5%, which they interpret to be interstellar in origin. However they also detected marginal variability, with one measurement of LP = 2.30.5%. The S/N was low in our NIR observations and we can place 3 upper limits of LP 5%, 17% and 12% in , and , respectively (the aperture includes a very close contaminating star which appears to contribute about half the flux in ; star in Chevalier et al., 1999).
The observations here span three epochs, the first of which was at the end of a small outburst (Bailyn et al., 2006). Indeed, the derived magnitudes are consistent with those found in quiescence by Garcia et al. (1999) except in the first epoch (20 Aug 2006), where and are 0.200.15 and 0.270.16 magnitudes brighter than the mean quiescent values. On this date, the – de-reddened SED is blue (column VI of Table 21) implying the emission is from the disc, although the contaminating star will affect this measurement. The disc and donor star are expected to dominate the OIR light in quiescence, but during outburst the contributions vary. A dramatic reddening of the optical SED was seen at the peak of the bright 1978 outburst of Aql X–1 (Charles et al., 1980) which could be explained by the domination of the jet component (Chapters 2 and 3). However the jet is likely to contribute very little to the OIR light in quiescence.
SS 433:
High levels of LP have been detected in this HMXB in the optical and UV, which can be explained by a combination of Thompson and Rayleigh scattering (Dolan et al., 1997). In the lower panel of Fig. 38 the polarisation spectrum of SS 433 in shown with the two -band measurements from this work, the optical/UV data and a -band upper limit from Thompson et al. (1979). Our data follow the general trend of decreasing LP with decreasing frequency, so we expect the origin is the same as in the optical. However, the PAs differ between the -band ( during two epochs) and the optical (), which could be explained by an interstellar contribution at these low levels of LP (the extinction is high; see Table 19).
5.4 Summary and conclusions
Linear polarimetric observations are presented of seven X-ray binaries in the NIR regime and one in the optical. A significant level (3) of linear polarisation is detected in four sources. The polarisation is found to be intrinsic (at the level) in two sources; GRO J1655–40 (–7% in and -bands during an outburst) and Sco X–1 (–0.9% in and ), which is stronger at lower frequencies. This is likely to be the signature of optically thin synchrotron emission from the collimated jets in these systems, whose presence indicates a partially-ordered magnetic field is present at the inner regions of the jets. In Sco X–1 the intrinsic polarisation is at a comparable level to that measured recently by Shahbaz et al. (2007), but it is also highly variable in and -bands; sometimes it is absent. The variability could be due to changes in either the jet magnetic field structure or the jet power and luminosity. In the -band (i.e. at shorter wavelengths) the polarisation is not significantly variable and is consistent with an interstellar origin. The optical light from GX 339–4 is also polarised, but at a level and position angle consistent with scattering by interstellar dust. The other polarised source is SS 433, which has a low level (0.5–0.8%) of -band polarisation, likely due to local scattering. The NIR counterparts of GRO J0422+32, XTE J1118+480, 4U 0614+09 and Aql X–1 (which were all in or near quiescence) have a linear polarisation level of % (3 upper limit, some are %).
| Sample | X-ray | Viscous | Optically | Optically | Intrinsic |
|---|---|---|---|---|---|
| reprocessing | disc | thin jet | thick jet | companion | |
| BHXBs; OPT; low-lum. hard state | |||||
| BHXBs; NIR; low-lum. hard state | |||||
| NSXB Z-sources; NIR |
Some results in this Chapter have constrained the dominating optical or NIR emission mechanisms in these sources (Table 22). The optical SED of GX 339–4 is blue during a low-luminosity hard state, which can be explained by disc emission but not jet (whose spectrum is flat or red) or companion star (which has never been detected even at its lowest flux levels; Shahbaz et al., 2001) emission. The NIR LP of BHXB GRO J1655–40 in a low-luminosity hard state is higher than predicted from all emission processes except optically thin synchrotron emission from the jets, but its NIR SED indicates the star is the main emission contributor (see Migliari et al., 2007). Finally, the variable polarisation seen in the Z-source Sco X–1 can be explained by either optically thick or optically thin synchrotron emission from its jets.
As far as the local conditions in the region of the inner jets is concerned, , the dimensionless parameter representing the ordering of the magnetic field has been constrained in two sources. In the BHXB GRO J1655–40, whereas in the NSXB 4U 0614+09, . The BHXB result is consistent with those found from radio studies of the transient jet ejections in BHXBs (e.g. Fender et al., 2002; Brocksopp et al., 2007) and multi-wavelength studies of jets in AGN (e.g. Saikia & Salter, 1988; Jorstad et al., 2007). The inner regions of steady jets from BHXBs may have a similar magnetic field configuration to the brighter, transient jets. A dramatic change in PA in GRO J1655–40 at the end of its outbursts (also seen in the radio) suggests the magnetic field structure may change at low jet powers, and/or the polarisation may originate from a different region of the jet at these later times. For NSXBs, this is the first time a constraint on has been made (none exist from radio observations). The non-detection of polarisation in any of the low-luminosity sources suggests either the jet contribution is insignificant or the magnetic field is not well-ordered (although the S/N is low). This Chapter demonstrates that polarimetry is a powerful tool to constrain the conditions in the inner regions of the jets in X-ray binaries.
6 The Cygnus X–1 jet-powered nebula
6.1 Introduction
It was explained in Section 1.2.5 that XBs can indirectly produce OIR emission originating from extended matter in proximity to the system. In particular, emission which is essentially energised by the jets of XBs can be used to constrain the properties of the jets; a common technique used for AGN jets energising their surrounding media. In Chapters 2 and 3 the broadband spectrum of the steady, hard state jet was constrained, providing constraints on the total power of these jets. Here, optical observations of the extended structure (nebula) associated with the jet of Cyg X–1 are used to constrain the properties of the emitting gas and the power of the jet which powers the structure.
Wide field imaging observations were performed with the INT of the region of the Cyg X–1 nebula in H and [O III] (5007 Å) filters in order to (a) constrain the velocity and temperature of the shocked gas and hence the time-averaged power of the X-ray binary jet of Cyg X–1, (b) obtain for the first time flux-calibrated optical emission line measurements from a nebula powered by an X-ray binary jet, and (c) search for any jet–ISM interactions associated with the counter jet supposedly to the south of Cyg X–1.
The observations and data reduction procedures in this Chapter were performed by myself (except the 2004 observations used in the initial paper; Gallo et al., 2005, which were taken by Dimitris Mislis); the co-authors Rob Fender, Elena Gallo and Christian Kaiser made contributions towards the text, analysis and discussions. In addition, Elena Gallo provided the wide-field radio map of the region used for Section 6.4.4. This work is published in MNRAS (Russell, Fender, Gallo & Kaiser 2007; Paper III, and also summarised in a published conference proceedings; Paper II. The 2004 H observations and analyses were used in the initial Cyg X–1 nebula paper published in Nature (Gallo et al., 2005). Fraser Lewis provided the H images of the Cyg X–1 nebula taken with the Faulkes Telescope North (which are not currently published).
6.2 Observations and Data Reduction
Cyg X–1 was observed using the Wide Field Camera (WFC) on the 2.5m INT in the H filter on 2004-04-05 during a Service Night (bright time; full moon). Conditions were photometric with a seeing of arcsec. These observations were used for the first paper; Gallo et al. (2005). After this publication, the field of Cyg X–1 and two Landolt standard stars were observed with the same telescope and camera in narrowband and broadband filters on 2005-10-10 as part of a Galactic survey of emission line nebulae powered by X-ray binary jets (Russell et al., in preparation; see Chapter 7). The conditions were cloudless with a seeing of 1–2 arcsec. The moon was set, making it possible to achieve a higher S/N than the 2004 images. The WFC consists of 4 CCDs (charge-coupled devices) of 20484100 imaging pixels, each of scale 0.333 arcsec pixel-1. The field of view is 3434 arcmin. In addition, the Cyg X–1 region was imaged in H using HawkCam on the Faulkes Telescope North in 2007. Table 23 lists the observations used for this work.
| Run | MJD | Target | RA & Dec. (centre of | Air- | Filter | Exp. |
| no. | CCD 4 for WFC; J2000) | mass | time(sec) | |||
| 2004 INT data: | ||||||
| 393072 | 53100.14 | Cyg X–1 | 19 58 21.67 +35 12 05.7 | 1.91 | H 6568Å | 1200 |
| 393073 | 53100.16 | Cyg X–1 | 19 58 21.67 +35 12 05.7 | 1.67 | H 6568Å | 1200 |
| 393074 | 53100.17 | Cyg X–1 | 19 58 21.68 +35 12 05.7 | 1.53 | H 6568Å | 1200 |
| 393075 | 53100.19 | Cyg X–1 | 19 58 21.68 +35 12 05.8 | 1.41 | H 6568Å | 1200 |
| 393076 | 53100.20 | Cyg X–1 | 19 58 21.68 +35 12 05.7 | 1.32 | H 6568Å | 1200 |
| 2005 INT data: | ||||||
| 473434 | 53653.92 | Cyg X–1 north | 19 59 38.49 +35 18 20.0 | 1.17 | [O III] 5007Å | 1200 |
| 473435 | 53653.94 | Cyg X–1 north | 19 59 39.31 +35 18 29.6 | 1.23 | [O III] 5007Å | 1200 |
| 473436 | 53653.96 | Cyg X–1 north | 19 59 38.50 +35 18 20.0 | 1.31 | Harris V | 600 |
| 473437 | 53653.96 | Cyg X–1 north | 19 59 38.49 +35 18 20.0 | 1.38 | H 6568Å | 1200 |
| 473438 | 53653.98 | Cyg X–1 north | 19 59 39.31 +35 18 30.0 | 1.49 | H 6568Å | 1200 |
| 473439 | 53654.00 | Cyg X–1 north | 19 59 37.68 +35 18 10.0 | 1.62 | Harris R | 600 |
| 473441 | 53654.01 | Cyg X–1 south | 19 59 07.99 +34 56 59.9 | 1.86 | [O III] 5007Å | 900 |
| 473442 | 53654.03 | Cyg X–1 south | 19 59 08.80 +34 57 09.8 | 2.06 | [O III] 5007Å | 900 |
| 473452 | 53654.11 | Landolt 94–171 | 02 53 38.80 +00 17 17.9 | 1.14 | Harris R | 10 |
| 473454 | 53654.11 | Landolt 94–171 | 02 53 38.79 +00 17 18.0 | 1.14 | Harris V | 10 |
| 473457 | 53654.11 | Landolt 94–702 | 02 58 13.39 +01 10 54.0 | 1.13 | Harris V | 10 |
| 473458 | 53654.11 | Landolt 94–702 | 02 58 13.39 +01 10 53.9 | 1.13 | Harris R | 10 |
| 2007 Faulkes Telescope data: | ||||||
| – | 54183.55 | Cyg X–1 P1 | 19:58:02.00 +35:20:20.0 | 2.45 | H 6568Å | 4200 |
| – | 54183.60 | Cyg X–1 P2 | 19:58:02.00 +35:16:00.0 | 1.63 | H 6568Å | 4200 |
| – | 54183.61 | Cyg X–1 P3 | 19:58:22.00 +35:20:20.0 | 1.55 | H 6568Å | 4200 |
| – | 54183.62 | Cyg X–1 P4 | 19:58:37.00 +34:59:10.0 | 1.44 | H 6568Å | 4200 |
The positions refer to the centre of CCD 4 of the WFC (which is the middle of the three eastern CCDs; Fig. 42), or the four positions used to make the mosaic from the Faulkes Telescope in the right panel of Fig. 41. 10 bias frames and 5H, 7[O III] 5007 Å, 6Harris -band and 5Harris -band sky flats were taken in the same observing night for the 2005 data.
For the 2004 data, IRAF was used for data reduction. The combined average bias frame for each of the four CCDs was subtracted from each image from the corresponding CCD (including the flat fields) and the science frames were divided by the normalised average flat field frame before being combined into one image for each CCD. A nearby bright star just to the west of Cyg X–1 caused a ghost on the image, which was removed by manually subtracting a constant value from the affected region of the image. The Faulkes data from 2007 are automatically de-biased and flat-fielded by the pipeline. The images were combined in IRAF. The resulting images are presented in Fig. 41. We show radio contours from Gallo et al. (2005) overplotted on the INT image (left panel). Since the Faulkes image is not as deep as the INT ones (especially the 2005 data), we do not use these data in any following analyses except in Section 6.4.4, where a region to the south is used which was not imaged by the INT.
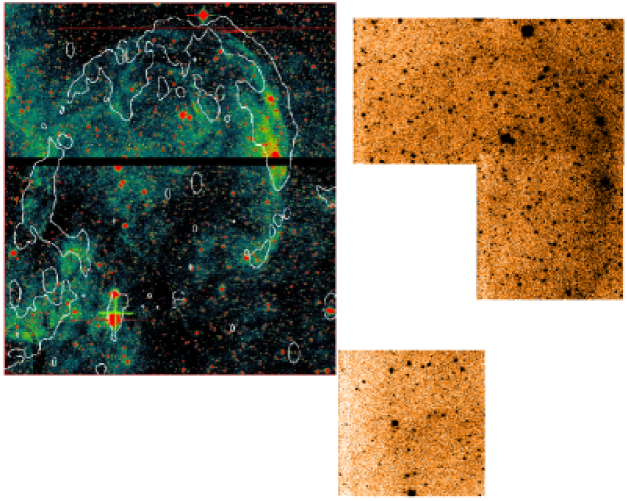
Data reduction was performed using the pipeline package THELI (details in Erben et al., 2005) for the 2005 data. After manually separating the data into type (bias/flat/science) and filter, THELI separated each CCD, created a master bias and de-biased normalised master flats for each CCD before subtracting the master bias from the science frames and dividing them by the master flats. The package read the exposure time and RA & Dec from the FITS file headers (it is currently configured for reducing data from instruments including the INT WFC) and matched several hundred stars in each exposure with those in the online MAST Guide Star Catalog (release 2.2). THELI then aligned and stacked (for each position and filter) the images, and position-calibrated mosaics were created, with flux in counts s-1pixel-1. The resulting H and [O III] mosaics of the Cyg X–1 field are displayed in Fig. 42.
6.3 Flux calibration
No standard star was observed that could be used to calibrate the 2004 data, however it is still possible to estimate a conservative lower limit to the flux density of the nebula. According to the exposure time calculator for the INT, given the conditions during the observations (seeing, moon phase, airmass), the sky brightness would be 18.3 mag arcsec-2 which equals 0.138 mJy arcsec-2 (see conversion method in Section 2.2.2). The Cyg X–1 nebula is clearly seen in not only the combined H image (left panel of Fig. 41) but also in the individual images of 1200 sec each. For the nebula to be visible, the S/N must exceed one. The exposure time calculator predicts an extended source of magnitude 23.1 mag arcsec-2 would have a S/N = 1.0 in 1200 sec in H, which equals mJy arcsec-2. Adopting the known interstellar extinction towards Cyg X–1 (; Wu et al., 1982), the intrinsic flux density would be 0.0219 mJy arcsec-2. Therefore, since the nebula is visible in the 1200 sec image (and hence has S/N 1), it must have a flux density of mJy arcsec-2. The measured radio flux density of the nebula is times this value (Gallo et al., 2005), so the radio–optical spectrum of the nebula cannot be explained by optically thin synchrotron emission, which requires . The more likely scenario is bremsstrahlung emission from a thermal plasma producing the radio, with H line emission from recombination in the shock. These results were used in Gallo et al. (2005).
For the 2005 data, the Landolt standard stars 94–171 (; ) and 94–702 (; ) were observed at low airmass (see Table 23). Aperture photometry was performed on the standards in the and -band reduced images with PHOTOM and the airmass–dependent atmospheric extinction was accounted for according to King (1985). The resulting conversion between intrinsic flux density (at airmass ) and counts s-1 differed between the two standards by a factor 0.5 and 6.5 percent for and , respectively. The H filter is located within the passband of the Harris filter, and [O III] is located within the Harris filter. For a flat spectrum source, the WFC -band filter collects 15.742 times more flux than the H filter, and likewise collects 11.127 times more flux than [O III]. By multiplying by these factors we obtain mJy (intrinsic) per counts s-1 for H and mJy (intrinsic) per counts s-1 for [O III].
As a calibration check, the fluxes of 10 stars in our reduced Cyg X–1 H image were measured, that are listed in the INT Photometric H Survey of the Northern Galactic Plane (IPHAS; Drew et al., 2005) catalogue (which uses the same telescope, instrument and filter). The ratio of the H flux of each star measured here to that listed in the catalogue is 1.060.39 (). We can therefore assume our flux calibration is accurate, and we adopt a error for each flux measurement (H and [O III]), of 0.14 dex (i.e. ).
Since the 2005 data are the deepest, have the most number of filters used and are the only set to be flux calibrated, we use only this data in the following analyses.
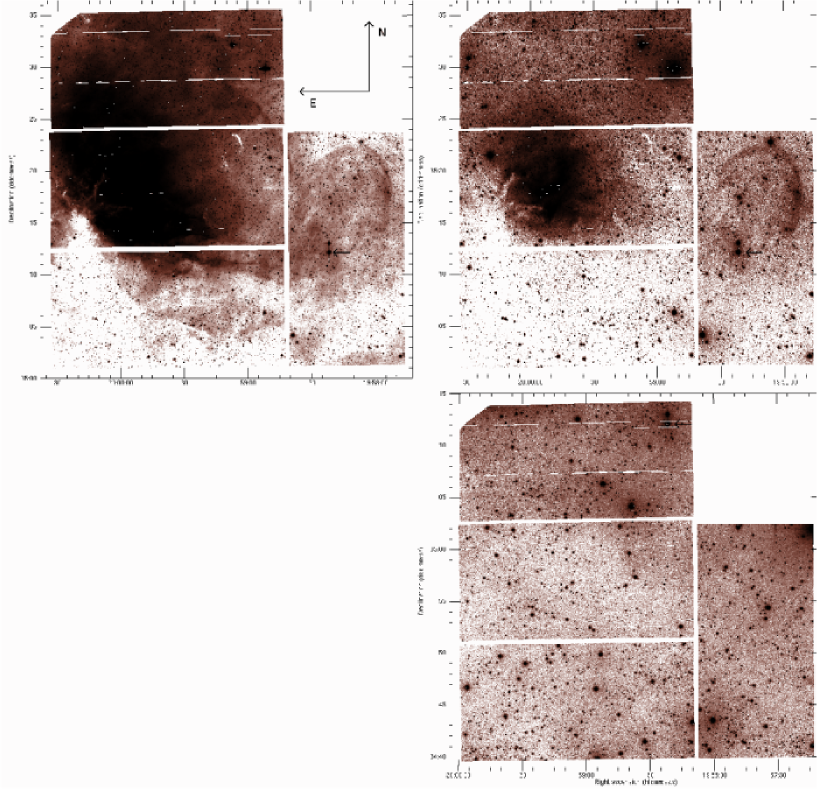
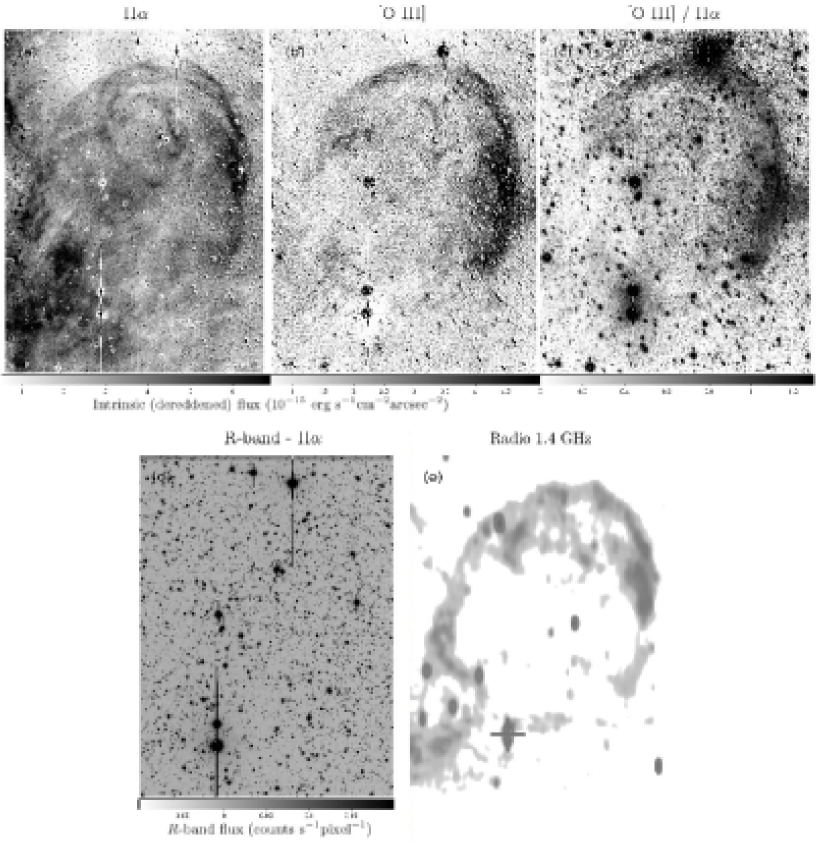
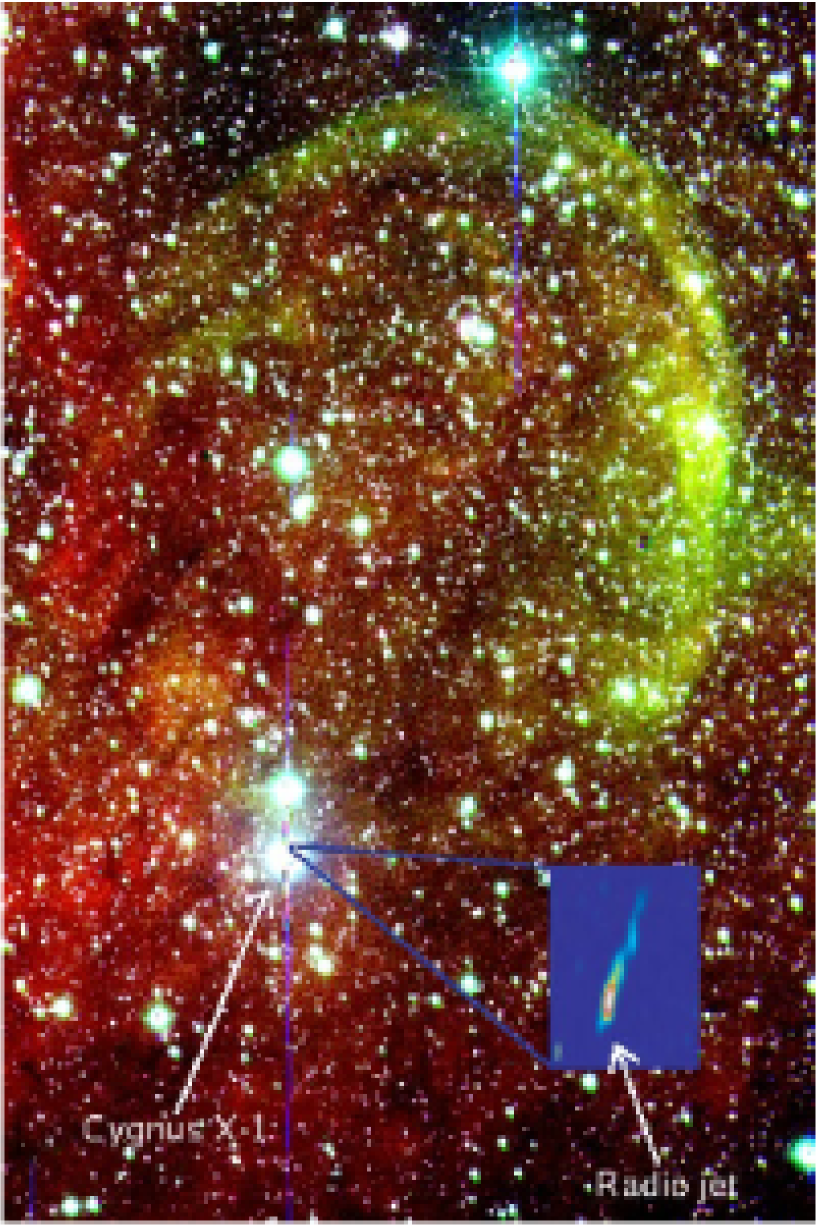

Flux-calibrated continuum-subtracted H and [O III] images of the region of Cyg X–1 were created (Fig. 43a, 43b) using IMUTIL and IMMATCH in IRAF . The resulting images are corrected for interstellar extinction towards Cyg X–1 adopting (Wu et al., 1982). The extinction towards Cyg X–1 and its nebula may vary over the field of view. The total neutral hydrogen column density through the Galaxy at various positions in a deg2 area around Cyg X–1 (Hartmann & Burton, 1997) is indicated in Fig. 45. appears to vary smoothly over the field, and the four closest points to Cyg X–1 yield cm-2 in the region containing Cyg X–1, or adopting (Predehl & Schmitt, 1995). If the extinction towards Cyg X–1 (i.e. not through the whole Galaxy in this direction) also varies by 0.53 over the much smaller field of view of the nebula (a conservative case), an error is introduced of 0.18 dex and 0.25 dex to the H and [O III] flux measurements, respectively (no distance estimate is required). The measurements of [O III] / H however only suffer a 0.06 dex uncertainty due to the different extinctions suffered at the two wavelengths ([O III] at 5007 Å and H at 6568Å; this concerns only the contribution to the error budget of the extinction).
Propagating the above two sources of error, we arrive at:
| (6) | |||
| (7) | |||
| (8) |
[O III] / H and -band H images were also created (Fig. 43c, 43d). The [O III] / H image represents the ratio of the [O III] and H fluxes (in de-reddened erg s-1cm-2arcsec-2) and the H contribution is subtracted from the continuum in the -band H image. The 1.4 GHz radio image of Gallo et al. (2005) is shown in Fig. 43e for comparison. Finally, a colour image is presented in Fig. 44 which emphasises the difference in / ratio between the Cyg X–1 nebula and the surrounding gas, as discussed below.
6.4 Results
The H and [O III] fluxes measured in a number of positions in the shell of the nebula are plotted in Fig. 46. It seems that the [O III] / H ratio increases with position going clockwise around the shell, from values of / on the eastern side to on the western side of the nebula. The fluxes of both emission lines are also higher on the western side. The line ratio is approximately constant in the filaments inside the nebula, with values of / . The H II region Sh2–101 and the ‘stream’ of diffuse emission joining the region to the Cyg X–1 nebula, possess ratios of order / –0.2, with one area (RA 19 59 45, Dec +35 18 48) having a higher value, / . This area resembles a shell-like feature close to a bright star HD 227018 at the centre of the H II region, and could be a bow shock associated with the motion of this star (which is 12 milli-arcsec per year in the direction of the observed shell in the H II region; Perryman et al., 1997). The flux in the H II region is – erg s-1cm-2arcsec-2; – erg s-1cm-2arcsec-2.

The large quantity of stars in the line of sight of the shell prevent us from accurately calculating the total H and [O III] luminosity of the structure. However, the area of the emitting gas can be conservatively estimated to be between 3 arcmin2 (approximating the nebula to a arcsec2 area) and 46 arcmin2 (the area of a circle with radius 4 arcmin); the mean flux of the nebula (Fig. 46) can then be used to constrain its luminosity. At a distance of 2.1 kpc, the H and [O III] luminosities of the nebula are erg s-1 and erg s-1, respectively.
In ten regions (of arcsec2 areas) inside and outside the H-emitting nebula, the -band de-reddened H-subtracted flux is consistent with zero, and the mean of the standard deviations in each region is erg s-1cm-2arcsec-2. We therefore have a upper limit to the -band flux of erg s-1cm-2arcsec-2, or a flux density of 0.0068 mJy arcsec-2. Similarly, we obtain a upper limit to the -band flux (from ten arcsec-2 regions) of erg s-1cm-2arcsec-2, or 0.0196 mJy arcsec-2. From the -band upper limit, we conclude that the optical continuum flux density is times the radio flux density (Gallo et al., 2005), yielding a radio–optical spectral index .
The broadband spectrum is consistent with bremsstrahlung emission with a flat radio–optical continuum and optical emission lines which are at least one order of magnitude more luminous than the continuum. We cannot however definitely state that the radio emission is thermal in origin, as mixed thermal/non-thermal plasma is seen in some environments (e.g. the arcsec-scale jets of SS 433; Migliari et al., 2002). A future measurement of the radio spectral index, which is difficult to achieve, is required to test whether the radio through optical spectrum is consistent with a thermal plasma or requires two (or more) components. Currently the morphology of the radio emission, being spatially coincident with the rather thin optical shell, does seem to favour the single thermal plasma model.
6.4.1 Morphology and nature of the nebula
The higher S/N in the H image compared to that in Gallo et al. (2005) is striking from the observed structure within the nebula (Fig. 43a). One would expect the most luminous areas of the nebula to occur in regions of the shock front where the line of sight is tangential to its surface and therefore should exist only at the apparent edge of the nebula if the structure is spherical. Filaments of gas are seen within the nebula and are unlikely to originate in unassociated line-of-sight photoionised gas because of their filamental morphology; the nebulosity is less diffuse than the gas in the photoionised H II region. The [O III] / H ratios of in the filaments (see above) and morphology suggest either multiple shock fronts or an uneven non-spherical nebula. The latter is expected for a varying preshock gas density, which is clearly the case on inspection of the variation in H nebulosity close to the nebula.
The [O III] / H image reveals two striking features: firstly the H nebulosity (which extends from the H II region Sh2–101 to the east of the nebula) possesses a low [O III] / H flux ratio compared to the Cyg X–1 nebula, and secondly there exists a thin outer shell to the Cyg X–1 nebula with a higher [O III] / H ratio. H II regions and photoionised gas in general can possess a wide range of [O III] / H ratios (e.g. Johnson, 1953; Blair, Kirshner & Chevalier, 1982) but this morphology of an outer [O III]-emitting shell is only expected from shock-excited gas. These two observations confirm that the gas in the Cyg X–1 nebula must be ionised by a different source to the surrounding nebulosity.
A blow-up of the north-west area of the nebula in [O III] / H is shown in Fig. 47; the figure clearly shows this thin shell of enhanced [O III] / H ratio on the outer side of the ring. A 3.3 arcsec-wide slice is taken through the image (indicated in Fig. 47) and the emission line flux and / flux ratio along this slice is plotted in Fig. 48. The upper panel of Fig. 48 shows that there is a sharp outer edge to the ring, and this edge is further out in [O III] than in H. This results in the thin outer shell of enhanced [O III] / H ratio that is visible in the lower panel of Fig. 48. This outer shell is arcsec thick and the rest of the ring is arcsec thick, at least in the region of the slice. We note that the thin shell of enhanced [O III] / H ratio is not due to inaccurate alignment of the [O III] and H images as the stars are aligned and the thin shell exists on both sides of the nebula.
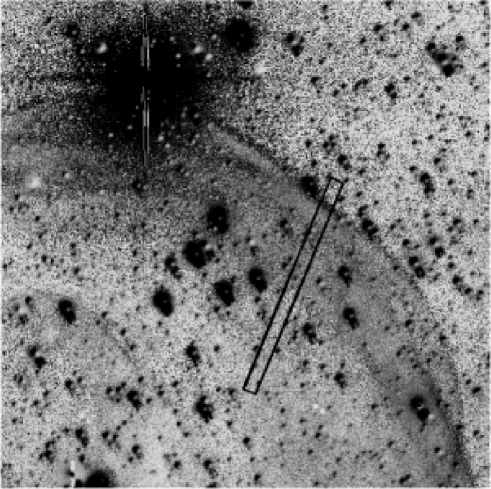

6.4.2 Constraining the shock velocity and jet power
The / flux ratio is measured in seven ‘slices’ (typical thickness 12 pixels arcsec) of the [O III]-emitting shock front, and in four larger regions behind it. In the thin outer shell, / and behind the shell, / . Taking into account the error from equation 8, / in the shock front and / in the nebula behind the shock front.
Both radiative and non-radiative shock waves are expected to produce a mix of line (radiative recombination) and continuum (due to bremsstrahlung emission) output (e.g. Krolik, 1999). Non-radiative shock waves (defined as when the cooling time of the shocked gas exceeds the age of the shock) produce Balmer optical emission lines only, because the heavier atoms are not excited (e.g. McKee & Hollenbach, 1980), so the existence of the strong [O III] line confirms the radiative nature of the Cyg X–1 nebula shock. In a radiative bow shock, the ambient ISM gas is first perturbed by the approaching radiation field. The ionisation of preshock hydrogen becomes progressively more significant in the velocity range km s-1; below 90 km s-1 the preshock gas is essentially neutral and above 120 km s-1 it is entirely ionised (e.g. Shull & McKee, 1979). In addition, at velocities km s-1 the ionising He II (304Å) photons from the cooling region can doubly ionise the oxygen increasing the intensity of the [O III] lines (McKee & Hollenbach, 1980). This leads to the high excitation line [O III] becoming negligible at low velocities in all shock-wave models (Raymond 1979; Shull & McKee 1979; Dopita et al. 1984; Binette, Dopita & Tuohy 1985; Cox & Raymond 1985; Hartigan, Raymond & Hartmann 1987; Dopita & Sutherland 1995; 1996). The outer shell of the Cyg X–1 nebula, bright in [O III] / H, may originate in the ionised atoms close to the front of the bow shock, and its presence confirms its association with the jet of Cyg X–1.
Radiative shock models predict that relative optical line strengths of the shocked gas are highly sensitive to the temperature and velocity of the shock wave, and vary only weakly with the conditions in the preshock gas such as the elemental abundances (e.g. Cox & Raymond, 1985). Temperatures and velocities of shocked matter, mainly in SNRs, are commonly inferred by comparing their observed optical or ultraviolet (UV) line ratios to these models (e.g. Blair et al., 1991; Vancura et al., 1992; Levenson et al., 1995; Bocchino et al., 2000; Mavromatakis et al., 2001). The bright [O III] / H shock front of the Cyg X–1 nebula appears to be thicker on the western side of the nebula, and the H and [O III] surface brightness is also higher in this region (Fig. 46). This implies the shock may be faster here, possibly due to a lower preshock density; it is the furthest area of the nebula from the H II region (or due to the proper motion of Cyg X–1; see below).

The relation between the shock velocity and [O III] / H ratio in the shell is described for most of the published models of steady-flow radiative shocks with self-consistent pre-ionisation (Cox & Raymond, 1985; Binette et al., 1985; Hartigan et al., 1987; Dopita & Sutherland, 1995). The reliability of these models can be assessed from their level of agreement, unless there are systematic uncertainties common to all models (which seems not to be the case as the velocities predicted by the models are consistent with velocities observed using other methods; e.g. Michael et al., 2000; Pun et al., 2002). In Fig. 49, the aforementioned relation predicted from five of the most advanced radiative shock models is plotted. The empirical [O III] / H ratio found for the Cyg X–1 shock front is overplotted. Bearing in mind the previously estimated range of shock velocities, 20 km s-1 (Gallo et al., 2005), outside the range km s-1, no models successfully predict the observed [O III] / H measurement to within 1. Subsequently, a temperature of the gas in the shocked shell (Gallo et al., 2005) of K is inferred. The models in Fig. 49 assume typical Galactic abundances and preshock particle densities within the range inferred for the Cyg X–1 nebula; cm-3 (Gallo et al., 2005).
By constraining the velocity and temperature of the gas in the shock front, it is possible to refine a number of parameters such as the particle density in the shell and power in the jet (Gallo et al., 2005). Tables 24 and 25 list the unchanged and revised parameters inferred respectively, for the nebula and jet. The same methodology is adopted to calculate the parameters as used in Gallo et al. (2005). The temperature-dependent ionisation fraction of the gas is taken from Spitzer (1978). At the temperatures inferred, the hydrogen in the shocked shell is fully ionised. The accuracy of the shock velocity, the time-averaged jet power and the jet lifetime have improved from dex to dex. Assuming the power originates in the hard state jet which is switched on for percent of the lifetime of Cyg X–1 (e.g. Gallo et al., 2005), the total power of both these jets is between 30 and 100 percent of the bolometric 0.1–200 keV X-ray luminosity ( erg s-1; Di Salvo et al., 2001).
Assuming the shock velocity has been approximately constant over the lifetime of the jet, the jet lifetime –0.04 Myr is much shorter than the estimated age of the progenitor of the black hole, –7 Myr (Mirabel & Rodrigues, 2003). However, given that the proper motion of Cyg X–1 is milli-arcsec year-1 in a direction degrees from the jet direction (Stirling et al., 2001; Lestrade et al., 1999; Mirabel & Rodrigues, 2003), the system must have travelled between 2.5 and 9.1 arcmins during the lifetime of the jet. We speculate that the jet may have been present for the lifetime of Cyg X–1, but only when the system moved into the ISM close to the H II region did the local density become large enough for a bow shock to form. In fact, the age of the nebula (if it is powered by the jet) cannot exceed Myr because the position of Cyg X–1 at the birth of the jet would be in front of the bow shock. This scenario may also explain the apparent higher [O III] / H ratio and velocity of the gas on the western side of the nebula compared with the eastern side: the western side is further from the jet origin as the Cyg X–1 system moves.
| Parameter | Value |
|---|---|
| Monochromatic radio luminosity | erg s-1Hz-1 |
| Cyg X–1 – shell separation | cm |
| Jet inclination angle to line of sight | |
| Thickness of shell | cm |
| Source unit volume | cm3 |
| Bremsstrahlung emissivity for hydrogen gas | erg s-1Hz-1 cm-3 |
| Gaunt factor | |
| Number density of preshock gas | cm-3 |
| Parameter | Value |
|---|---|
| H flux of shell | erg s-1cm-2arcsec-2 |
| H luminosity of nebula | erg s-1 |
| [O III] flux of shell | erg s-1cm-2arcsec-2 |
| [O III] luminosity of nebula | erg s-1 |
| [O III] / H ratio in shock front | / |
| [O III] / H ratio behind shock front | / |
| Optical continuum flux density of shell | Jy arcsec-2 (3) |
| Shock velocity | km s-1 |
| Shocked gas temperature | K |
| Number density of ionised particles in shell | cm-3 |
| Ionisation fraction | |
| Number density of total particles in the shell | cm-3 |
| Jet lifetime | Myr |
| Time-averaged jet power | – erg s-1 |
| Hard state jet power including both jets | – erg s-1 |
| Outflow power / X-ray luminosity |
6.4.3 Ruling out alternative origins of the shell
It has been shown (Section 6.4.1) that the morphology of the Cyg X–1 nebula indicates the gas is shock-excited and not photoionised; the structure is therefore not a planetary nebula or an H II region. The nebula also cannot be a SNR associated with Cyg X–1 itself (Gallo et al., 2005). The proximity of the nebula to Cyg X–1, its alignment with the Cyg X–1 jet and the agreement of its age inferred from its velocity and from the proper motion of Cyg X–1 (Section 4.2) all point towards the jet-powered scenario. The one remaining alternative is a field SNR not associated with Cyg X–1; this possibility is explored here.
Xu, Zhang & Han (2005a) plot the diameter of 185 Galactic SNRs against their 1 GHz surface brightness (Fig. 3 of that paper). The radio surface brightness of the Cyg X–1 nebula is W m-2 Hz-1 sr-1 (lower than any SNR in the sample of Xu et al., 2005a), and would have a diameter of pc if it were to lie close to the diameter–surface brightness relation for SNRs. The nebula has an angular diameter of arcmin, suggesting a distance to the source of kpc if it is a SNR. However, the authors note that this surface brightness–diameter relation could be severely biased by selection effects (Xu, Zhang & Han, 2005b). Large, low surface-brightness SNRs may not have been detected in surveys due to confusion with strong foreground and background sources (e.g. Green, 2004). We therefore cannot completely rule out a SNR origin to the nebula, but its alignment with the relativistic jet of Cyg X–1 (for example) strongly suggests it is related to the system.
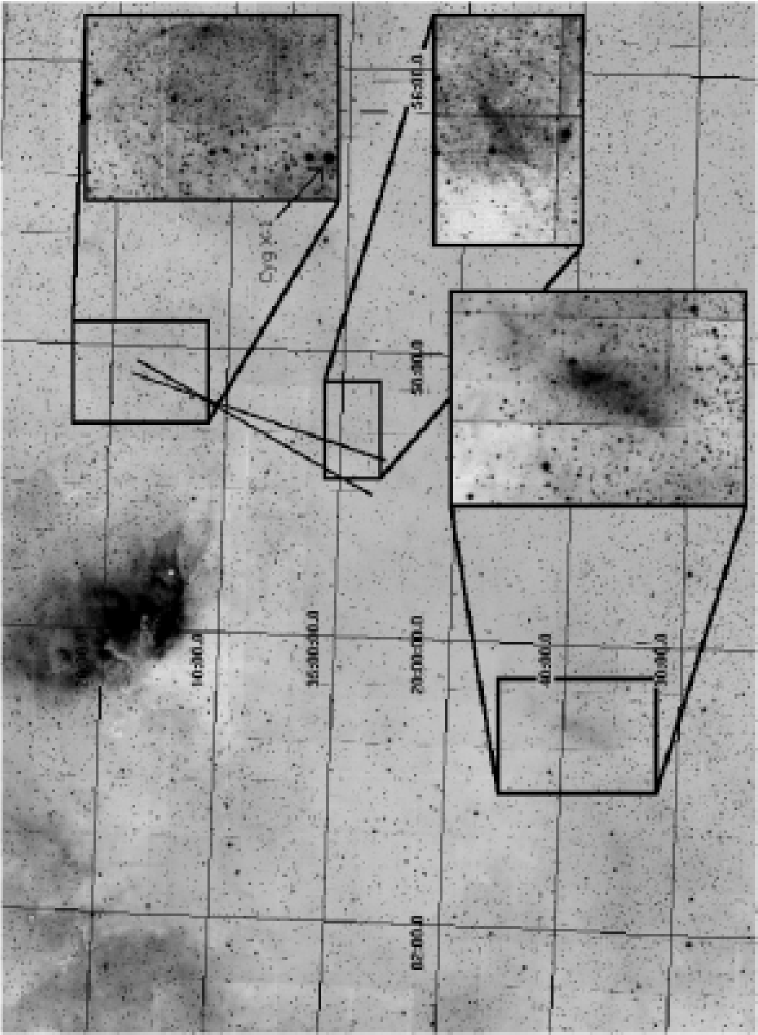
6.4.4 The search for ISM interactions with the southern jet
A deg2 field in [O III] south of Cyg X–1 was searched for a shell powered by the southern jet (lower panel of Fig. 42). No shell was observed in the 1800 sec image, nor any visual nebulosity detected in the [O III] images that is consistent with the southern jet of Cyg X–1 interacting with the ISM. The mass density of ISM may be much less to the south; the jet should travel essentially ballistically and undetected until being decelerated by a denser region. Heinz (2002) found that the rarity of jet-powered lobes in microquasars compared to AGN is likely due to the lower density environment. In addition, it is interesting to note that the X-ray-bright shocked edges surrounding AGN radio lobes are sometimes one-sided (Kraft et al., 2003). A deg2 H mosaic from the IPHAS survey (Drew et al., 2005; Witham et al., 2006, see Fig. 50) was searched. Two candidate ‘hot spots’ analogous to those associated with AGN jets were identified, and are expanded in the figure.
Radio emission exists in the region close to the northern hot spot according to Martí et al. (1996), but it is uncertain whether it originates in point sources or extended emission. We inspected the southern region of the 1.4 GHz radio image obtained by Gallo et al. (2005) to search for diffuse emission. In a 16001600 arcsec region close to the more northern H hot spot (the southern hot spot is not within the radio field of view), the mean r.m.s. flux density is Jy beam-1, yielding a 3 upper limit to the (putative) radio hot spot in that region of 1.2 mJy beam-1. Deeper radio observations are needed to test whether the candidate H hot spots have radio counterparts, as would be expected if they are jet–ISM interaction sites.
A follow-up observation was made of the region of the more northern of the two hot spots, in H with the Faulkes Telescope North (see Section 6.2). The image is presented in the right panel of Fig. 41 (the lower, southern CCD). The hot spot is visible in the image, but its S/N is no higher than the H image from IPHAS.
6.5 Conclusions
H and [O III] (5007 Å) images of the nebula powered by the jet of the black hole candidate and microquasar Cygnus X–1 have been presented. The nebula and surrounding regions were observed with the 2.5 m INT and the 2.0 m Faulkes Telescope North. The ring-like structure is luminous in [O III] and there exists a thin outer shell with a high [O III] / H flux ratio. The morphology and line ratios indicate that this outer shell probably originates in the collisionally excited atoms close to the front of the bow shock. Its presence indicates that the gas is shock excited as opposed to photoionised, supporting the jet-powered scenario. The shock velocity was previously constrained at 20 km s-1; here it is shown that km s-1 (1 confidence) based on a comparison of the observed [O III] / H ratio in the bow shock with a number of radiative shock models. The H flux behind the shock front is typically erg s-1 cm-2 arcsec-2, and an upper limit of erg s-1cm-2arcsec-2 (3) to the optical (-band) continuum flux of the nebula is also estimated.
Alternative interpretations of the structure such as photoionised gas are ruled out, but an unrelated SNR cannot completely be ignored as a possible origin. However, the morphology of the nebula and its alignment with the jet of Cyg X–1 strongly suggest that it is indeed powered by this jet. We have probably isolated for the first time the thin, hot, compressed gas close to the bow shock front of a nebula powered by an X-ray binary jet.
The time-averaged power of the jet must be – erg s-1 to power a shock wave of the inferred size, luminosity, velocity and temperature. If the steady hard state jet of Cyg X–1 (that is active for percent of the time) is providing this power (rather than the transient jet; Fender et al., 2006), the total energy of both jets in the hard state is 0.3–1.0 times the bolometric X-ray luminosity. This provides the strongest evidence so far that at an accretion rate of percent Eddington, Cyg X–1 is in a state of approximate equipartition between radiative and kinetic output. Lower accretion rates should therefore be jet-dominated (Fender et al. 2003; Körding, Fender & Migliari 2006).
The inferred age of the structure is similar to the time Cyg X–1 has been close to a bright H II region (due to the proper motion of the binary), indicating a dense local medium is required to form the shock wave. In addition, a degree2 field of view to the south of Cyg X–1 in H (provided by the IPHAS survey) is searched for evidence of the counter jet interacting with the surrounding medium. Two candidate regions are identified, whose possible association with the jet could be confirmed with follow-up optical emission line and radio observations.
7 Conclusions & Future Work
The majority of this work has concerned to some extent the dominating OIR continuum emission processes in LMXBs. From Chapters 2–5 a general picture seems to emerge, in which the detected OIR emission originates from different components depending on the luminosity and spectral state of the source at the time and the nature of the compact object; i.e. essentially the rate and nature of the mass accretion. Four methods were adopted to constrain these emission processes: correlation analysis (C), SEDs (the OIR spectrum; S), changes in the OIR luminosity during state transitions (T), and linear polarimetry (P). In Table 26 I summarise which emission processes can explain the OIR data, using the four methods. No processes were tested using all four methods, so the number of tests (methods) used for each emission process is shown in the second column. The processes that can explain all of the data when tested are shown in bold.
It is clear that not all of the sources in a given luminosity/state have the same dominating optical and NIR emission processes, probably due to differing source parameters (see Section 1.1.1) like the size of the accretion disc. However, many results in each of the Chapters 2–5 agree, and by summarising these results in Table 26 it is possible to identify the emission processes that dominate most of the time at a given luminosity/state and to see how these differ between BHXBs and NSXBs.
Quiescent LMXBs (both black hole and neutron star systems) are dominated by the companion star most of the time, but the jet and disc may play a role in BHXBs in quiescence. Comparing these results to the literature, there is evidence for a disc contribution in quiescence in many BHXBs (McClintock et al., 1995; Orosz et al., 1996; Zurita et al., 2003); this is generally thought to be the viscous disc as opposed to the X-ray heated disc (as the X-rays are probably too faint in quiescence to heat the disc). A jet contribution is as yet fairly unexplored (recent works have begun to explore this; Gallo et al., 2007). The BHXBs with the faintest discs and stars are likely to have a larger fraction of OIR jet emission (see Hynes et al., 2006b; Reynolds et al., 2007; Gallo et al., 2007). The OIR emission of NSXBs, like the BHXBs are mostly dominated by the companion in quiescence but at least some probably have a disc contribution (Table 26 and e.g. Campana et al., 2002; Casares et al., 2002). There is no empirical evidence for a jet contribution; this agrees with what is expected from correlation analysis of NSXBs (see Sections 1.2.3; 2.4.2).
| Waveband / Luminosity | Tests | — Accretion Disc — | —– Jet emission —– | Comp- | ||
|---|---|---|---|---|---|---|
| / X-ray state | X-ray | Viscous | Optically | Optically | anion | |
| reprocessing | disc | thin | thick | |||
| ————— Black hole X-ray binaries ————— | ||||||
| OPT; Quiescence | 2 | C,S | S | C | C | C,S |
| NIR; Quiescence | 1 | S | S | S | ||
| OPT; Low lum. hard state | 3 | C,S | S | C | C | |
| NIR; Low lum. hard state | 3 | S | S | C,S,P | C | P |
| OPT; High lum. hard state | 3 | C,S | S | C,T | C,T | |
| NIR; High lum. hard state | 3 | S,T | S | C,S,T | C,T | |
| OPT; Soft state | 2 | S,T | S,T | |||
| NIR; Soft state | 3 | S,T | C,S,T | |||
| ————— Neutron star X-ray binaries ————— | ||||||
| OPT; Quiescence | 2 | C,S | C,S | C,S | ||
| NIR; Quiescence | 2 | S | S | C,S | ||
| OPT; Low lum; atolls/MSXPs | 2 | C,S | C,S | |||
| NIR; Low lum; atolls/MSXPs | 2 | S | S | |||
| OPT; High lum; atolls/MSXPs | 2 | C | C | C,S | C | |
| NIR; High lum; atolls/MSXPs | 2 | C,S | C | |||
| OPT; High lum; Z-sources | 2 | C,S | S | C | C,S | |
| NIR; High lum; Z-sources | 3 | S | S | C,P | C,S,P | |
| ————— High mass X-ray binaries ————— | ||||||
| OIR; All | 1 | C | ||||
Low lum. means outbursting sources with erg s-1; High lum. means outbursting sources with erg s-1. C = correlation analysis; S = SEDs (the OIR spectrum); T = changes in the OIR luminosity during state transitions; P = linear polarimetry.
BHXBs in a hard X-ray state in outburst appear to be dominated by the X-ray heated disc and the optically thin region of the jet spectrum in the optical and NIR, respectively (both at high and low luminosities). The OIR seems to be the regime in which the two components have comparable luminosities, and the ‘V’-shape formed by the two components is seen in the SEDs of some BHXBs (Chapter 3). The position of the ‘V’ changes between sources (likely due to different positions of the turnover in the jet spectrum or different sizes of accretion disc); for example XTE J1859+226 has a blue OIR spectrum in the hard state but Hynes et al. (2002a) showed that a non-thermal component is present that reddens the NIR slightly (hence the ‘V’ is further into the NIR here). In GX 339–4 and 4U 1543–47, the jet component is more dominant at high luminosity than at low luminosity in the hard state (Buxton & Bailyn, 2004; Homan et al., 2005a), as is expected from the models in Section 2.4.2 whereby the jet component drops off with slightly more steeply than the X-ray heated disc does. This suggests the disc may dominate the OIR in quiescence (in the absence of a star) and the jet may be more luminous than the disc only redward of the NIR here. On the other hand, the SEDs of BHXBs are often redder at lower luminosities in the hard state (Chapter 3); this could be explained by the jet dominating more (the opposite to above) or the disc blackbody being cooler. The only direct measurement of the level of jet contribution is made at the highest luminosity in the hard state (from the level of soft state quenching), where the jet contributes % of the NIR light and % of the optical.
The jet and disc may not always dominate the NIR and optical emission (respectively) of BHXBs in the hard state; in fact most emission processes considered can sometimes explain the emission (Table 26). Further studies of BHXBs in outburst may reveal relations between the dominating processes and some parameters of the binary like the size of the disc. For BHXBs in the soft state the jet is quenched and there is empirical evidence for the viscous disc to dominate the OIR (shown in Chapter 4 in particular; see also Kuulkers, 1998; Homan et al., 2005a) but many results are also consistent with X-ray reprocessing; it is likely that both play a role and their level of contribution depends on the source parameters.
NSXBs in outburst at low luminosities seem to be always dominated by the accretion disc in the OIR, which largely agrees with the literature (e.g. McGowan et al., 2003; Hynes et al., 2006a). At high luminosities the optically thin jet component becomes more dominant (moreso in the NIR than the optical); this is seen more prominently in sources with smaller accretion discs, i.e. the MSXPs (Wang et al., 2001; Krauss et al., 2005; Torres et al., 2007). The NSXBs with the highest luminosities and largest discs, the Z-sources, are dominated by the (probably X-ray reprocessing) disc but most likely have a jet contribution. The position of Z-sources in their colour–colour diagrams or HIDs changes on timescales of hours–days and the jet seems to be quenched during episodes in the flaring branch (e.g. Migliari & Fender, 2006). The linear polarisation of Sco X–1 (which most likely originates in the jet) seems to flicker (Chapter 5); further NIR or mid-IR polarimetric observations of Z-sources, correlated with X-ray hardness may reveal the X-ray state-dependent NIR contribution of the jet in Z-sources (the level of jet OIR contribution in Z-sources is currently not certain, although it will be more prominent in the NIR than the optical).
In general there seems to be less ambiguity as to the dominating OIR processes in NSXBs compared to BHXBs; few emission processes can explain the OIR behaviour of NSXBs except those mentioned above. This is probably at least partly due to the very different relations between and for the emission processes of NSXBs; in BHXBs, the OIR light from X-ray reprocessing and the jet have roughly the same dependency on , whereas in NSXBs the relations are not so similar (see Section 2.4.2). This work has demonstrated that it is important not to make assumptions about the dominating OIR emission, especially in BHXBs during outburst. However since the contributions have been constrained and separated fairly satisfactorily in some cases, this work has made it possible to make such assumptions in these cases, allowing analysis of the different components. For example, in Chapter 4 the origin of the hysteresis affect could not have been discussed in depth without knowing the the NIR is dominated by the jet in hard state BHXBs.
Promising future methods to constrain the dominating OIR emission mechanisms include well-sampled photometry (i.e. tracking the OIR colours through an outburst) and linear polarimetry; optically thin synchrotron emission is expected to be highly polarised if the magnetic field is ordered. NIR linear polarimetry during times in which the jet is known to dominate (e.g. BHXBs in bright hard states) will constrain the conditions in the inner regions of the jets close to where they are launched. Future polarimetric studies may reveal changes in these conditions as a function of jet power (i.e. jet luminosity) and differences between object types (black hole or neutron star systems). In particular, the BHXB GX 339–4 undergoes quasi-regular outbursts with a bright NIR jet (e.g. Homan et al., 2005a). In quiescence, a positive polarisation detection from the jet will indicate its contribution is significant, supporting jet-dominated scenarios. In addition, circular polarimetry could provide clues towards the orientation of the magnetic field and/or the conditions in the local medium.
A method not adopted in this work is fast timing analysis. Variability is expected and seen from many of the OIR emission processes (e.g. Zurita et al., 2003; Eikenberry et al., 2007). A future work could be to perform fast timing photometry of the hard state NIR optically thin jet component, when it is known to dominate. Comparing the features in the resulting power spectrum to X-ray power spectra could constrain the contribution of the synchrotron jet component in the X-ray regime (which is currently debated). One source so far has shown dips in optical light curves in advance of X-rays, which are likely to be a signature of jet emission (Kanbach et al., 2001; Malzac et al., 2004). In addition, if the behaviour of the OIR variability differs between disc and jet components for example (like above), this analysis could help to identify their respective levels of contribution, e.g. in quiescence. Monitoring campaigns of LMXBs like ours using the Faulkes Telescopes (see Section 4.5) will reveal the long-term variability of quiescent systems; differences between BHXBs and NSXBs could be interesting because the jet component is expected to be present in the BHXBs but not in the NSXBs at these low luminosities.
It has been found (Chapter 2) that at a given X-ray luminosity, a BHXB is typically times more luminous in OIR than an atoll or MSXP NSXB (Z-sources can be as OIR-luminous as BHXBs or NSXBs). The reasons for this are unclear but have direct implications for the nature and physical location of the illuminating X-ray source; a hot topic of debate.
It was shown in Chapter 2 that the data of BHXBs (in hard and soft states), NSXBs (atolls/MSXPs and Z-sources) and HMXBs occupy different areas of the – diagram, with small areas of overlap. Therefore this diagram is a useful tool to identify the nature of a new X-ray binary, if its distance and reddening are known. For most Galactic XBs the distance and reddening of new transients are not known, but this tool may instead be useful for extragalactic XBs; many XBs with X-ray and optical counterparts have now been discovered in nearby galaxies such as M31 (e.g. Williams et al., 2005).
The correlation analysis method used in Chapter 2 could be applied to OIR–X-ray data not used so far, such as BHXBs in intermediate/very high states (to identify when exactly the dominating processes change during state transitions), NSXBs with high magnetic fields that have faint or no jets (good for a test sample to compare to), ULXs and (incorporating a mass term) SMBHs. The empirical hysteresis effect found in Chapter 4 has direct implications for the behaviour of many parameters such as the disc viscosity parameter and the power and spectrum of the jets; future works on these topics should take into account this effect.
It has been known for a number of years that the the broadband optically thick synchrotron spectrum of the jet extends to the IR in some sources (e.g. Corbel & Fender, 2002), but much of the work here has shown that this is probably common to all LMXBs. The power in the jets is higher than thought previously under the assumption that the spectrum turns over in the radio or mm-regime. It is difficult to estimate quantitatively the power of the jets without constraining their radiative efficiency, which is also hard to constrain. However the results here lead us one step closer to estimating the jet power. The jet power of one BHXB, Cyg X–1, is constrained in Chapter 6 by a completely different method which is independent of the jet radiative efficiency – from the interaction of the jet with the surrounding ISM. If eventually the jet power can be constrained in a number of systems using this method, and the jet spectrum can be constrained for the same sources, the jet radiative efficiency can be estimated and compared between sources.
I (with Rob Fender, Elena Gallo, Christian Kaiser, James Miller-Jones and Sebastian Heinz) am gathering observations of potential X-ray binary jet-powered nebulae to test the ubiquity of the jet power from X-ray binaries and constrain the matter and energy they input into the ISM. LMXBs may have less powerful jets than Cyg X–1 when time-averaged, due to their long phases in quiescence, but they are longer lived and so the [jet power lifetime] product may be comparable and nebulae may be detected. Any nebulae discovered associated with the jet of an LMXB will provide constraints on these speculations.
So far, wide-field imaging of the fields around 30 X-ray binaries have been obtained in H (and some in [O III]) using the INT and the ESO/MPI 2.2 m telescopes (for some preliminary results see also Paper II). In most fields no shell-like nebulae are discovered, however a few candidates were found. The analyses of these data are ongoing, and follow-up observations of some candidate nebulae are required to confirm their nature. A couple of candidates are presented in Fig. 51. A known X-ray-ionised nebula (XIN) surrounds LMC X–1 which is photoionised by the UV and X-ray photons from the XB (Pakull & Angebault, 1986) and the jets are probably interacting with this nebula (Cooke et al., 2007). For GRS 1009–45, an oval-shaped nebula to the east of the X-ray binary may be shock-excited from the jets, and is consistent with the morphology of some AGN radio lobes. Follow-up narrowband observations in e.g. [S II] (as this is much stronger in shocked gas than photoionised gas) are required to test this.
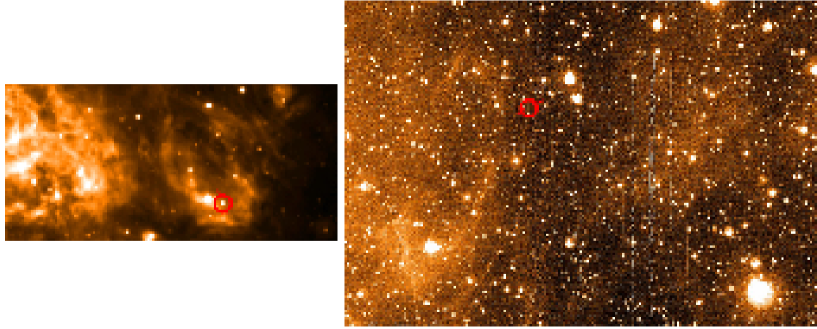
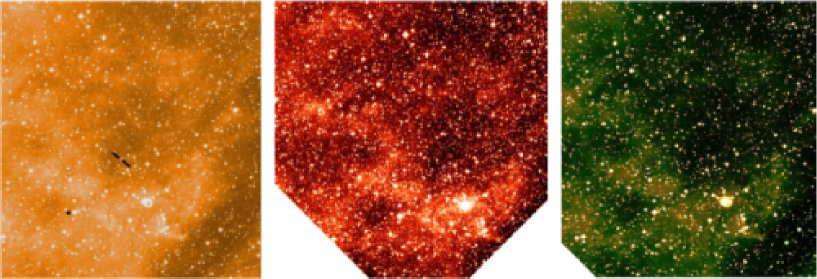
An apparent H shell to the south west of GRO J1655–40 is aligned with the resolved radio jet (Hjellming & Rupen, 1995). Follow-up imaging in [S II] (performed with the Danish 1.5m telescope) revealed the shell to be clearly visible in [S II] line emission, implying the gas is shocked-excited as opposed to photoionised (Fig. 52). There is also extended radio emission in the region of this nebula (Combi et al., 2001). Flux calibration of the optical images and overlaying of archival radio data may confirm this structure to be associated with the jet.
The properties of the gas in the Cyg X–1 nebula (any any other jet-powered structures discovered), and hence the properties of the jet that powers it, may be constrained with optical and UV (e.g. Blair et al., 1991) spectroscopic observations. Many of these properties are related to optical emission line ratios. In addition, observations in [S II] would test whether the H-emitting gas in the hot spots to the south of Cyg X–1 are shock-excited or photoionised, and deeper [O III] observations may constrain the velocity of any shocked gas.
Imaging in infrared emission lines may also help to identify nebulae hidden behind many magnitudes of interstellar dust extinction. In general, few Galactic jet-powered nebulae are discovered so far, probably because the conditions required are rare: a high local mass density is required for a bow shock to form (Heinz, 2002), however low Galactic extinction towards the source is also needed to see the faint structures in the optical regime, and a low space velocity of the system may be needed so that the power is not dissipated over too large a volume.
Evidence for the existence of synchrotron-emitting jets in BHXBs is solid; spectral evidence for the existence of these jets in NSXBs presented in this work (and showed for the first time by Migliari et al., 2006), along with radio detections which are sometimes resolved (see Fomalont et al., 2001; Migliari & Fender, 2006), have direct implications for the local conditions and accretion processes in NSXBs.
To conclude, ‘we know more than we ever have, but every answer unveils a whole new set of questions’ (my father Edwin Russell, 2007).
References
- Allen & Gilmore (1993) Allen W., Gilmore A. C., 1993, IAUC, 5784
- Allen & Jones (1993) Allen W. H., Jones A. F., 1993, IAUC, 5774
- Bailyn (1992) Bailyn C. D., 1992, ApJ, 391, 298
- Bailyn et al. (2006) Bailyn C., Neil E., Maitra D., 2006, ATel, 869
- Balbus & Hawley (1991) Balbus S. A., Hawley J. F., 1991, ApJ, 376, 214
- Bandyopadhyay et al. (1999) Bandyopadhyay R. M., Shahbaz T., Charles P. A., Naylor T., 1999, MNRAS, 306, 417
- Barret & Olive (2002) Barret D., Olive J-F., 2002, ApJ, 576, 391
- Bartolini et al. (1994) Bartolini C., Guarnieri A., Piccioni A., Beskin G. M., Neizvestny S. I., 1994, ApJS, 92, 455
- Basko & Sunyaev (1973) Basko M. M., Sunyaev R. A., 1973, Ap&SS, 23, 117
- Basko et al. (1974) Basko M. M., Sunyaev R. A., Titarchuk L. G., 1974, A&A, 31, 249
- Bellamy et al. (2006) Bellamy M., Howard D., Wolstenholme C., 2006, in Black Holes & Revelations, A&E, HEL3002CDX, 3
- Belloni et al. (2005) Belloni T., Homan J., Casella P., van der Klis M., Nespoli E., Lewin W. H. G., Miller J. M., Méndez M., 2005, A&A, 440, 207
- Berger et al. (2005) Berger E., et al., 2005, Nat, 438, 988
- Binette et al. (1985) Binette L., Dopita M. A., Tuohy I. R., 1985, ApJ, 297, 476
- Björnsson & Blumenthal (1982) Björnsson C.-I., Blumenthal G. R., 1982, ApJ, 259, 805
- Blair et al. (1982) Blair W. P., Kirshner R. P., Chevalier R. A., 1982, ApJ, 254, 50
- Blair et al. (1984) Blair W. P., Raymond J. C., Dupree A. K., Wu C.-C., Holm A. V., Swank J. H., 1984, ApJ, 278, 270
- Blair et al. (1991) Blair W. P., et al., 1991, ApJ, 379, L33
- Blandford & Konigl (1979) Blandford R. D., Konigl A., 1979, ApJ, 232, 34
- Blandford & Begelman (1999) Blandford R. D., Begelman M. C., 1999, MNRAS, 303, L1
- Blundell & Bowler (2005) Blundell K. M., Bowler M. G., 2005, ApJ, 622, L129
- Bocchino et al. (2000) Bocchino F., Maggio A., Sciortino S., Raymond J., 2000, A&A, 359, 316
- Bochkarev & Lyutyi (1998) Bochkarev N. G., Lyutyi V. M., 1998, AstL, 24, 277
- Bonnet-Bidaud et al. (1989) Bonnet-Bidaud J. M., Motch C., Beuermann K., Pakull M., Parmar A. N., van der Klis M., 1989, A&A, 213, 97
- Boyd et al. (2000) Boyd, P. T., Smale, A. P., Homan, J., Jonker, P. G., van der Klis, M., Kuulkers, E. 2000, ApJ, 542, L127
- Bradshaw et al. (1999) Bradshaw C. F., Fomalont E. B., Geldzahler B. J., 1999, ApJ, 512, L121
- Brandt et al. (1992) Brandt, S., Castro-Tirado, A. J., Lund, N., Dremin, V., Lapshov, I., Syunyaev, R. 1992, A&A, 262, L15
- Brandt et al. (2002) Brandt W. N., Alexander D. M., Bauer F. E., Hornschemeier A. E., 2002, ‘X-ray astronomy in the new millennium’, eds. R. D. Blandford, A. C. Fabian, K. Pounds., Roy Soc of London Phil Tr A, 360, 2057
- Brocksopp et al. (1999a) Brocksopp C., et al., 1999a, MNRAS, 309, 1063
- Brocksopp et al. (1999b) Brocksopp, C., Tarasov, A. E., Lyuty, V. M., Roche, P. 1999b, A&A, 343, 861
- Brocksopp et al. (2001a) Brocksopp, C., Groot, P. J., Wilms, J. 2001a, MNRAS, 328, 139
- Brocksopp et al. (2001b) Brocksopp, C., Jonker, P. G., Fender, R. P., Groot, P. J., van der Klis, M., Tingay, S. J. 2001b, MNRAS, 323, 517
- Brocksopp et al. (2002) Brocksopp C., et al., 2002, MNRAS, 331, 765
- Brocksopp et al. (2004) Brocksopp, C., Bandyopadhyay, R. M., Fender, R. P. 2004, NewA, 9, 249
- Brocksopp et al. (2007) Brocksopp C., Miller-Jones J. C. A., Fender R. P., Stappers B. W., 2007, MNRAS, 378, 1111
- Brown et al. (1978) Brown J. C., McLean I. S., Emslie A. G., 1978, A&A, 68, 415
- Burbidge (1959) Burbidge G. R., 1959, ApJ, 129, 849
- Burderi et al. (2003) Burderi, L., Di Salvo, T., D’Antona, F., Robba, N. R., Testa, V. 2003, A&A, 404, L43
- Burki et al. (1995) Burki G., Rufener F., Burnet M., Richard C., Blecha A., Bratschi P., 1995, A&AS, 112, 383
- Buxton & Bailyn (2004) Buxton, M. M., Bailyn, C. D. 2004, ApJ, 615, 880
- Buxton et al. (2005a) Buxton M., Bailyn C., Maitra D., 2005a, ATel, 418
- Buxton et al. (2005b) Buxton M., Bailyn C., Maitra D., 2005b, ATel, 542
- Cadolle Bel et al. (2004) Cadolle Bel M., et al., 2004, A&A, 426, 659
- Cadolle Bel et al. (2007) Cadolle Bel M., et al., 2007, ApJ, in press (astro-ph/0612575)
- Callanan et al. (1992) Callanan P. J., Charles P. A., Honey W. B., Thorstensen J. R., 1992, MNRAS, 259, 395
- Callanan et al. (1995) Callanan P. J., et al., 1995, ApJ, 441, 786
- Callanan et al. (2002) Callanan P. J., et al., 2002, ApJ, 574, L143
- Campana et al. (2002) Campana S., et al., 2002, ApJ, 575, L15
- Campana & Stella (2003) Campana, S., Stella, L. 2003, ApJ, 597, 474
- Campana & Stella (2004) Campana, S., Stella, L. 2004, NuPhS, 132, 427
- Campana et al. (2004a) Campana, S., Israel, G. L., Stella, L., Gastaldello, F., Mereghetti, S. 2004a, ApJ, 601, 474
- Campana et al. (2004b) Campana S., et al., 2004b, ApJ, 614, L49
- Campana et al. (2005) Campana S., Stella L., Israel G. L., Belloni T., Pagani C., Burrows D. N., Gehrels N., 2005, ATel, 529
- Canizares et al. (1980) Canizares, C. R., McClintock, J. E., Grindlay, J. E. 1980, ApJ, 236, L55
- Cardelli et al. (1989) Cardelli J. A., Clayton G. C., Mathis J. S., 1989, ApJ, 345, 245
- Carilli et al. (1994) Carilli C. L., Perley R. A., Harris D. E., 1994, MNRAS, 270, 173
- Casares et al. (1991) Casares J., Charles P. A., Jones D. H. P., Rutten R. G. M., Callanan P. J., 1991, MNRAS, 250, 712
- Casares et al. (1993) Casares J., Charles P. A., Naylor T., Pavlenko E. P., 1993, MNRAS, 265, 834
- Casares et al. (1995) Casares J., Martin A. C., Charles P. A., Martin E. L., Rebolo R., Harlaftis E. T., Castro-Tirado A. J., 1995, MNRAS, 276, L35
- Casares et al. (1999) Casares J., Dubus G., Homer L., 1999, IAUC, 7113
- Casares et al. (2002) Casares J., Dubus G., Shahbaz T., Zurita C., Charles P. A., 2002, MNRAS, 329, 29
- Casares et al. (2004) Casares J., Zurita C., Shahbaz T., Charles P. A., Fender R. P., 2004, ApJ, 613, L133
- Casella et al. (2007) Casella P., Altamirano D., Patruno A., Wijnands R., van der Klis M., 2007, ApJL, in press (arXiv:0708.1110)
- Castor et al. (1975) Castor J., McCray R., Weaver R., 1975, ApJ, 200, L107
- Castro-Tirado et al. (1997) Castro-Tirado A. J., Ortiz J. L., Gallego, J., 1997, A&A, 322, 507
- Celotti & Fabian (1993) Celotti A., Fabian A. C., 1993, MNRAS, 264, 228
- Chapuis & Corbel (2004) Chapuis C., Corbel S., 2004, A&A, 414, 659
- Charles et al. (1980) Charles P. A., et al., 1980, ApJ, 237, 154
- Charles et al. (1981) Charles P. A., Kidger M. R., Pavlenko E. P., Prokof’eva V. V., Callanan P. J., 1991, MNRAS, 249, 567
- Charles & Naylor (1992) Charles P. A., Naylor T., 1992, MNRAS, 255, P6
- Charles & Coe (2006) Charles P. A., Coe M. J., 2006, in Compact Stellar X-Ray Sources, eds. Lewin W. H. G., van der Klis M., Cambridge University Press, p. 215
- Chaty et al. (2001) Chaty S., Rodríguez L. F., Mirabel I. F., Geballe T. R., Fuchs Y., Claret A., Cesarsky C. J., Cesarsky D., 2001, A&A, 366, 1035
- Chaty et al. (2002) Chaty S., Mirabel I. F., Goldoni P., Mereghetti S., Duc P.-A., Mart, J., Mignani R. P., 2002, MNRAS, 331, 1065
- Chaty et al. (2003) Chaty S., Haswell C. A., Malzac J., Hynes R. I., Shrader C. R., Cui W., 2003, MNRAS, 346, 689
- Chen et al. (1997) Chen, W., Shrader, C. R., Livio, M. 1997, ApJ, 491, 312
- Chevalier & Ilovaisky (1990) Chevalier C., Ilovaisky S. A., 1990, A&A, 238, 163
- Chevalier et al. (1989) Chevalier C., Ilovaisky S. A., van Paradijs J., Pedersen H., van der Klis M., 1989, A&A, 210, 114
- Chevalier et al. (1999) Chevalier C., Ilovaisky S. A., Leisy P., Patat F., 1999, A&A, 347, L51
- Clark et al. (1978) Clark, G., Doxsey, R., Li, F., Jernigan, J. G., van Paradijs, J. 1978, ApJ, 221, L37
- Clark et al. (2000) Clark J. S., et al., 2000, A&A, 356, 50
- Cole (1998) Cole A. A., 1998, ApJ, 500, L137
- Combi et al. (2001) Combi J. A., Romero G. E., Benaglia P., Mirabel I. F., 2001, A&A, 370, L5
- Cooke et al. (2007) Cooke R., Kuncic Z., Sharp R., Bland-Hawthorn J., 2007, ApJL, 667, 163
- Corbel & Fender (2002) Corbel, S., Fender, R. P. 2002, ApJ, 573, L35
- Corbel et al. (1998) Corbel S., Hannikainen D., Gonzalez J. F., Hainaut O. R., 1998, IAUC, 6824
- Corbel et al. (2000) Corbel S., Fender R. P., Tzioumis A.K., Nowak M., McIntyre V., Durouchoux P., Sood R., 2000, A&A, 359, 251
- Corbel et al. (2001) Corbel S., et al., 2001, ApJ, 554, 43
- Corbel et al. (2002) Corbel S., Fender R. P., Tzioumis A. K., Tomsick J. A., Orosz J. A., Miller J. M., Wijnands R., Kaaret P., 2002, Sci, 298, 196
- Corbel et al. (2003) Corbel S., Nowak M. A., Fender R. P., Tzioumis A. K., Markoff, S. 2003, A&A, 400, 1007
- Cornelisse et al. (2007) Cornelisse R., Casares J., Steeghs D., Barnes A. D., Charles P. A., Hynes R. I., O’Brien K., 2007, MNRAS, 375, 1463
- Costantini et al. (2005) Costantini E., Freyberg M. J., Predehl P., 2005, A&A, 444, 187
- Cowley & Schmidtke (2004) Cowley, A. P., Schmidtke, P. C. 2004, AJ, 128, 709
- Cowley et al. (1983) Cowley, A. P., Crampton, D., Hutchings, J. B., Remillard, R., Penfold, J. E. 1983, ApJ, 272, 118
- Cox (1972) Cox, D. P., 1972, ApJ, 178, 143
- Cox & Raymond (1985) Cox D. P., Raymond J. C., 1985, ApJ, 298, 651
- Crampton et al. (1990) Crampton D., Hutchings J. B., Cowley A. P. Schmidtke P. C., Thompson I. B., 1990, ApJ, 355, 496
- Cunningham (1976) Cunningham C., 1976, ApJ, 208, 534
- Dahlgren et al. (2006) Dahlgren H., Ivchenko N., Sullivan J., Lanchester B. S., Whiter D., Stromme A., 2006, American Geophysical Union, Fall Meeting 2006, SM31B-0316
- de Jong et al. (1996) de Jong J. A., van Paradijs J., Augusteijn T., 1996, A&A, 314, 484
- della Valle et al. (1998) della Valle, M., Masetti, N., Bianchini, A. 1998, A&A, 329, 606
- Deutsch et al. (1999) Deutsch E. W., Margon B. A., Scott F., Wachter S., Goss W. M., 1999, ApJ, 524, 406
- Dickey & Lockman (1990) Dickey, J. M., Lockman, F. J. 1990, ARA&A, 28, 215
- Di Salvo et al. (2001) Di Salvo T., Done C., Życki P. T., Burderi L., Robba N. R., 2001, ApJ, 547, 1024
- Dolan (1984) Dolan J. F., 1984, A&A, 138, 1
- Dolan & Tapia (1989) Dolan J. F., Tapia S., 1989, PASP, 101, 1135
- Dolan et al. (1997) Dolan J. F., et al., 1997, A&A, 327, 648
- Dopita et al. (1984) Dopita M. A., Binette L., Dodorico S., Benvenuti P., 1984, ApJ, 276, 653
- Dopita & Sutherland (1995) Dopita M., Sutherland R. S., 1995, ApJ, 455, 468
- Dopita & Sutherland (1996) Dopita M., Sutherland R. S., 1996, ApJS, 102, 161
- Done & Gierliúski (2005) Done C., Gierliúski M., 2005, MNRAS, 364, 208
- Drew et al. (2005) Drew J. E., et al., 2005, MNRAS, 362, 753
- Dubner et al. (1998) Dubner G. M., Holdaway M., Goss W. M., Mirabel I. F., 1998, AJ, 116, 1842
- Dubus & Chaty (2006) Dubus G., Chaty S., 2006, A&A, 458, 591
- Dunn et al. (2006) Dunn R. J. H., Fabian A. C., Celotti A., 2006, MNRAS, 372, 1741
- Eachus et al. (1976) Eachus L. J., Wright E. L., Liller W., 1976, ApJ, 203, L17
- Ebisawa et al. (1994) Ebisawa K., et al., 1994, PASJ, 46, 375
- Eckart et al. (2006) Eckart A., Schödel R., Meyer L., Trippe S., Ott T., Genzel R., 2006, A&A, 455, 1
- Edge (2001) Edge A. C., 2001, MNRAS, 328, 762
- Eikenberry et al. (1998) Eikenberry S. S., Matthews K., Morgan E. H., Remillard R. A., Nelson R. W., 1998, ApJ, 494, L61
- Eikenberry et al. (2007) Eikenberry S. S., Patel S. G., Rothstein D. M., Remillard R., Pooley G. G., Morgan E. H., 2007, ApJ, in press (arXiv:0709.1095)
- Erben et al. (2005) Erben T., et al., 2005, AN, 326, 432
- Esin et al. (1997) Esin A. A., McClintock J. E., Narayan R., 1997, ApJ, 489, 865
- Esin et al. (2000) Esin, A. A., Kuulkers, E., McClintock, J. E., Narayan, R. 2000, ApJ, 532, 1069
- Esin et al. (2001) Esin A. A., McClintock J. E., Drake J. J., Garcia M. R., Haswell C. A., Hynes R. I., Muno M. P., 2001, ApJ, 555, 483
- Fabian (1994) Fabian A. C., 1994, ARA&A, 32, 277
- Falanga et al. (2005) Falanga M., et al., 2005, A&A, 444, 15
- Falcke & Biermann (1995) Falcke H., Biermann P.L., 1995, A&A, 293, 665
- Falcke & Biermann (1996) Falcke H., Biermann P. L., 1996, A&A, 308, 321
- Falcke et al. (2004) Falcke H., Körding E., Markoff S., 2004, A&A, 414, 895
- Fender (2001) Fender R. P., 2001, MNRAS, 322, 31
- Fender (2006) Fender R. P., 2006, in Compact Stellar X-Ray Sources, eds. Lewin W. H. G., van der Klis M., Cambridge University Press, p. 381
- Fender & Pooley (2000) Fender R. P., Pooley G. G., 2000, MNRAS, 318, L1
- Fender et al. (1997) Fender R. P., Pooley G. G., Brocksopp C., Newell, S. J., 1997, MNRAS, 290, L65
- Fender et al. (1999a) Fender R. P., et al., 1999a, ApJL, 519, 165
- Fender et al. (1999b) Fender R. P., Garrington S. T., McKay D. J., Muxlow T. W. B., Pooley G. G., Spencer R. E., Stirling A. M., Waltman E. B., 1999b, MNRAS, 304, 865
- Fender et al. (2002) Fender R. P., Rayner D., Trushkin S. A., O’Brien K., Sault R. J., Pooley G. G., Norris R. P., 2002, MNRAS, 330, 212
- Fender et al. (2003) Fender R. P., Gallo E., Jonker P. G., 2003, MNRAS, 343, L99
- Fender et al. (2004) Fender, R. P., Belloni, T. M., Gallo, E. 2004, MNRAS, 355, 1105
- Fender et al. (2006) Fender R. P., Stirling A. M., Spencer R. E., Brown I., Pooley G. G., Muxlow T. W. B., Miller-Jones J. C. A., 2006, MNRAS, 369, 603
- Ferreira et al. (2006) Ferreira J., Petrucci P.-O., Henri G., Saugé L., Pelletier G., 2006, A&A, 447, 813
- Fomalont et al. (2001) Fomalont E. B., Geldzahler B. J., Bradshaw C. F., 2001, ApJ, 558, 283
- Forman et al. (2005) Forman W., et al., 2005, ApJ, 635, 894
- Fox (2005) Fox D. B., 2005, ATel, 526
- Frank et al. (2002) Frank J., King A., Raine D. J., 2002, Accretion Power in Astrophysics, 3rd edn. Cambridge Univ. Press, Cambridge
- Froning & Robinson (2001) Froning C. S., Robinson E. L., 2001, AJ, 121, 2212
- Frontera et al. (2001a) Frontera F., et al., 2001a, ApJ, 546, 1027
- Frontera et al. (2001b) Frontera F., et al., 2001b, ApJ, 561, 1006
- Frontera et al. (2003) Frontera F., Amati L., Zdziarski A. A., Belloni T., Del Sordo S., Masetti N., Orlandini M., Palazzi E., 2003, ApJ, 592, 1110
- Fukue et al. (1997) Fukue J., et al., 1997, PASJ, 49, 93
- Gaensler et al. (1999) Gaensler B. M., Stappers B. W., Getts T. J., 1999, ApJ, 522, L117
- Gallo (2007) Gallo E., 2007, AIP Conf. Proc. of ‘The Multicoloured Landscape of Compact Objects and their Explosive Origins’, 2006 June 11-24 (astro-ph/0702126)
- Gallo et al. (2003) Gallo, E., Fender, R. P., Pooley, G. G. 2003, MNRAS, 344, 60
- Gallo et al. (2004) Gallo E., Corbel S., Fender R. P., Maccarone T. J., Tzioumis A. K., 2004, MNRAS, 347, L52
- Gallo et al. (2005) Gallo E., Fender R. P., Kaiser C., Russell, D. M., Morganti R., Oosterloo T., Heinz S., 2005, Nature, 436, 819
- Gallo et al. (2006) Gallo E., et al., 2006, MNRAS, 370, 1351
- Gallo et al. (2007) Gallo E., Migliari S., Markoff S., Tomsick J., Bailyn C., Berta S., Fender R., Miller-Jones J., 2007, ApJ, 670, 600
- Galloway et al. (2002) Galloway D. K., Chakrabarty D., Morgan, E. H., Remillard R. A., 2002, ApJ, 576, L137
- Galloway et al. (2005a) Galloway, D. K., Markwardt, C. B., Morgan, E. H., Chakrabarty, D., Strohmayer, T., E. 2005a, ApJ, 622, L45
- Galloway et al. (2005b) Galloway D., Morgan E., Kaaret P., Chakrabarty D., Butler N., Suzuki M., 2005b, ATel, 657
- Garcia et al. (1996) Garcia M. R., Callanan P. J., McClintock J. E., Zhao P., 1996, ApJ, 460, 932
- Garcia et al. (1999) Garcia M. R., Callanan P. J., McCarthy J., Eriksen K., Hjellming R. M., 1999, ApJ, 518, 422
- Garcia et al. (2001) Garcia, M. R., McClintock, J. E., Narayan, R., Callanan, P., Barret, D., Murray, S. S. 2001, ApJ, 553, L47
- Gehrz et al. (1989) Gehrz R. D., Johnson J., Harrison T., 1989, IAUC, 4816
- Gelino et al. (2001) Gelino, D. M., Harrison, T. E., Orosz, J. A. 2001, AJ, 122, 2668
- Gelino & Harrison (2003) Gelino, D. M., Harrison, T. E. 2003, ApJ, 599, 1254
- Gezari et al. (2006) Gezari S., et al., 2006, ApJ, 653, L25
- Giles et al. (2005) Giles A. B., Greenhill J. G., Hill K. M., Sanders E., 2005, MNRAS, 361, 1180
- Gilfanov et al. (1998) Gilfanov M., Revnivtsev M., Sunyaev R., Churazov E., 1998, A&A, 338, L83
- Gladstone et al. (2007) Gladstone J., Done C., Gierliski M., 2007, MNRAS, 378, 13
- Glass (1978) Glass I. S., 1978, MNRAS, 183, 335
- Gliozzi et al. (1998) Gliozzi M., Bodo G., Ghisellini G., Scaltriti F., Trussoni E., 1998, A&A, 337, L39
- Goodger et al. (2007) Goodger J. L., Hardcastle M. J., Croston J. H., 2007, Extragalactic Jets: Theory and Observation from Radio to Gamma Ray, eds. Rector T. A., De Young D. S., ASP conference series (arXiv0707.1942)
- Goranskii et al. (1996) Goranskii V. P., Karitskaya E. A., Kurochkin N. E., Trunkovskii E. M., 1996, AstL, 22, 371
- Grebel et al. (1997) Grebel E. K., Brandner W., Dieball A., 1997, AGA, 13, 194
- Green (2004) Green D. A., 2004, Bull. Astr. Soc. India, 32, 335
- Greene et al. (2001) Greene, J., Bailyn, C. D., Orosz, J. A. 2001, ApJ, 554, 1290
- Greenhill et al. (2006) Greenhill J. G., Giles A. B., Coutures C., 2006, MNRAS, in press
- Grindlay & Liller (1978) Grindlay J. E., Liller W., 1978, ApJ, 220, L127
- Haggard et al. (2004) Haggard D., et al., 2004, ApJ, 613, 512
- Hameury et al. (1990) Hameury J-M., King A. R., Lasota J-P., 1990, ApJ, 353, 585
- Hameury et al. (2003) Hameury J.-M., et al., 2003, A&A, 399, 631
- Hamuy et al. (1992) Hamuy M., Walker A. R., Suntzeff N. B., Gigoux P., Heathcote S. R., Phillips M. M., 1992, PASP, 104, 533
- Hamuy et al. (1994) Hamuy M., Suntzeff N. B., Heathcote S. R., Walker A. R., Gigoux P., Phillips M. M., 1994, PASP, 106, 566
- Han & Hjellming (1992) Han, X., Hjellming, R. M. 1992, ApJ, 400, 304
- Hannikainen et al. (2000) Hannikainen D. C., Hunstead R. W., Campbell-Wilson D., Wu K., McKay D. J., Smits D. P., Sault R. J., 2000, ApJ, 540, 521
- Hartigan et al. (1987) Hartigan P., Raymond J., Hartmann L., 1987, ApJ, 316, 323
- Hartmann & Burton (1997) Hartmann D., Burton W. B., 1997, Atlas of Galactic Neutral Hydrogen, Cambridge Univ. Press, Cambridge
- Hasinger & van der Klis (1989) Hasinger G., van der Klis M., 1989, A&A, 225, 79
- Hasinger et al. (1990) Hasinger G., van der Klis M., Ebisawa K., Dotani T., Mitsuda K., 1990, A&A, 235, 131
- Hasinger et al. (2001) Hasinger G., et al., 2001, A&A, 365, L45
- Haswell et al. (2000) Haswell, C. A., Chaty, S., Cui, W., Casares, J. V., Hynes, R. I. 2000, ATel, 55
- Haswell et al. (2002) Haswell C. A., Hynes R. I., King A. R., Schenker K., 2002, MNRAS, 332, 928
- Hayes & Latham (1975) Hayes D. S., Latham D. W., 1975, ApJ, 197, 593
- Heemskerk & van Paradijs (1989) Heemskerk, M. H. M., van Paradijs, J. 1989, A&A, 223, 154
- Heinz (2002) Heinz S., 2002, A&A, 388, L40
- Heinz (2006) Heinz S., 2006, ApJ, 636, 316
- Heinz & Sunyaev (2003) Heinz S., Sunyaev R.A., 2003, MNRAS, 343L, 59
- Heinz & Grimm (2005) Heinz S., Grimm H. J., 2005, ApJ, 633, 384
- Heinz et al. (1998) Heinz S., Reynolds C. S., Begelman M. C., 1998, ApJ, 501, 126
- Hill et al. (2007) Hill A. B., Bird A. J., Dean A. J., McBride V. A., Sguera V., Clark D. J., Molina M., Scaringi S., Shaw S. E., 2007, MNRAS, 381, 1275
- Hjellming & Han (1995) Hjellming, R. M., Han, X. 1995, in Radio Properties of X-ray Binaries, eds, Lewin, W. H. G., van Paradijs, J., van den Heuvel, E. P. J. Cambridge Univ. Press, Cambridge, p. 308
- Hjellming & Rupen (1995) Hjellming R. M., Rupen M. P., 1995, Nat, 375, 464
- Hoard et al. (2007) Hoard D. W., Howell S. B., Brinkworth C. S., Ciardi D. R., Wachter S., 2007, ApJ, 671, 734
- Homan & Belloni (2005) Homan J., Belloni T., 2005, Ap&SS, 300, 107
- Homan et al. (2001) Homan J., Wijnands R., van der Klis M., Belloni T., van Paradijs J., Klein-Wolt M., Fender R., Mendez M., 2001, ApJS, 132, 377
- Homan et al. (2005a) Homan J., Buxton M., Markoff S., Bailyn C. D., Nespoli E., Belloni T., 2005a, ApJ, 624, 295
- Homan et al. (2005b) Homan J., Miller J. M., Wijnands R., Lewin W. H. G., 2005b, ATel, 607
- Homan et al. (2007a) Homan J., et al., 2007a, ApJ, 656, 420
- Homan et al. (2007b) Homan J., Wijnands R., Altamirano D., Belloni T., 2007b, ATel, 1165
- Homer et al. (2001) Homer, L., Charles, P. A., Chakrabarty, D., van Zyl, L. 2001, MNRAS, 325, 1471
- Hutchings et al. (2003) Hutchings, J. B., Winter, K., Cowley, A. P., Schmidtke, P. C., Crampton, D. 2003, AJ, 126, 2368
- Hynes (2005) Hynes R. I., 2005, ApJ, 623, 1026
- Hynes & Haswell (1999) Hynes R. I., Haswell C. A., 1999, MNRAS, 303, 101
- Hynes et al. (1998) Hynes R. I., et al., 1998, MNRAS, 300, 64
- Hynes et al. (2001) Hynes R. I., Charles P. A., Haswell C. A., Casares J., Zurita C., Serra-Ricart M., 2001, MNRAS, 324, 180
- Hynes et al. (2002a) Hynes, R. I., Haswell, C. A., Chaty, S., Shrader, C. R., Cui, W. 2002a, MNRAS, 331, 169
- Hynes et al. (2002b) Hynes et al. 2002b, A&A, 392, 991
- Hynes et al. (2002c) Hynes R. I., Zurita C., Haswell C. A., Casares J., Charles P. A., Pavlenko E. P., Shugarov S. Y., Lott D. A., 2002c, MNRAS, 330, 1009
- Hynes et al. (2003a) Hynes, R. I., Steeghs, D., Casares, J., Charles, P. A., O’Brien, K. 2003a, ApJ, 583, L95
- Hynes et al. (2003b) Hynes R. I., et al., 2003b, MNRAS, 345, 292
- Hynes et al. (2003c) Hynes R. I., Charles P. A., Casares J., Haswell C. A., Zurita C., Shahbaz, T., 2003c, MNRAS, 340, 447
- Hynes et al. (2004) Hynes R. I., et al., 2004, ApJ, 611, L125
- Hynes et al. (2005) Hynes, R. I., Gelino, D. M., Pearson, K. J., Robinson, E. L. 2005, ATel, 393
- Hynes et al. (2006a) Hynes R. I., Horne K., O’Brien K., Haswell C. A., Robinson E. L., King A. R., Charles P. A., Pearson K. J., 2006a, ApJ, 648, 1156
- Hynes et al. (2006b) Hynes R. I., et al., 2006b, ApJ, 651, 401
- in’t Zand et al. (2001) in’t Zand J. J. M., et al., 2001, A&A, 372, 916
- Iaria et al. (2004) Iaria R., Di Salvo T., Robba N. R., Burderi L., Stella L., Frontera F., van der Klis M., 2004, ApJ, 600, 358
- Israel et al. (2004) Israel G. L., et al., 2004, ATel, 243
- Jain (2001) Jain R.K., 2001, Ph.D. Thesis, Yale University
- Jain et al. (1999) Jain R., C. Bailyn, C., Garcia, M., Rines, K., Levine, A., Espinoza, J., Gonzalez, D. 1999, ATel, 41
- Jain et al. (2000) Jain R., et al., 2000, ATel, 59
- Jain et al. (2001a) Jain R. K., Bailyn C. D., Orosz J. A., McClintock J. E., Sobczak G. J., Remillard R. A., 2001a, ApJ, 546, 1086
- Jain et al. (2001b) Jain R. K., Bailyn C. D., Orosz J. A., McClintock J. E., Remillard R. A., 2001b, ApJ, 554, L181
- Johnson (1953) Johnson H. M., 1953, ApJ, 118, 370
- Johnston et al. (1979) Johnston M. D., Bradt H. V., Doxsey R. E., 1979, ApJ, 233, 514
- Johnston et al. (1999) Johnston H. M., Fender R., Wu K., 1999, MNRAS, 308, 415
- Jonker & Nelemans (2004) Jonker, P. G., Nelemans, G. 2004, MNRAS, 354, 355
- Jonker et al. (2007) Jonker P. G., Nelemans G., Bassa C. G., 2007, MNRAS, 374, 999
- Jorstad et al. (2007) Jorstad S. G., et al., 2007, AJ, 134, 799
- Juett et al. (2003) Juett A. M., Galloway D. K., Chakrabarty D., 2003, ApJ, 587, 754
- Kaaret et al. (2003) Kaaret P., Corbel S., Tomsick J. A., Fender R., Miller J. M., Orosz J. A., Tzioumis A. K., Wijnands R., 2003, ApJ, 582, 945
- Kaaret et al. (2006) Kaaret P., Morgan E. H., Vanderspek R., Tomsick J. A., 2006, ApJ, 638, 963
- Kaiser (2005) Kaiser C. R., 2005, MNRAS, 360, 176
- Kaiser & Alexander (1997) Kaiser C. R., Alexander P, 1997, MNRAS, 286, 215
- Kaiser et al. (2004) Kaiser C. R., Gunn K. F., Brocksopp C., Sokoloski J. L., 2004, ApJ, 612, 332
- Kalemci et al. (2005) Kalemci E., et al., 2005, ApJ, 622, 508
- Kaluzienski et al. (1980) Kaluzienski, L. J., Holt, S. S., Swank, J. H. 1980, ApJ, 241, 779
- Kanbach et al. (2001) Kanbach G., Straubmeier C., Spruit H. C., Belloni T., 2001, Nat, 414, 180
- Kaper et al. (1995) Kaper, L., Lamers, H. J. G. L. M., Ruymaekers, E., van den Heuvel, E. P. J., Zuidervijk, E. J. 1995, A&A, 300, 446
- Kato et al. (1995) Kato T., Mineshige S., Hirata R., 1995, PASJ, 47, 31
- Kato et al. (1999) Kato T., Uemura M., Stubbings R., Watanabe T., Monard B., 1999, IBFS, 4777
- Kawai & Suzuki (2005) Kawai N., Suzuki M., 2005, ATel, 534
- Kennea et al. (2006) Kennea J. A., et al., 2006, ATel, 704
- King (1985) King D. L., 1985, ING La Palma Technical Notes, 31
- King & Ritter (1998) King A. R., Ritter H., 1998, MNRAS, 293, L42
- King et al. (1996) King, N. L., Harrison, T. E., McNamara, B. J. 1996, AJ, 111, 1675
- Kitamoto et al. (1990) Kitamoto, S., Tsunemi, H., Pedersen, H., Ilovaisky, S. A., van der Klis, M. 1990, ApJ, 361, 590
- Kiziloglu et al. (2005) Kiziloglu, U., Balman, S., Baykal, A., Gogus, E., Alpar, A., Inam, C. 2005, ATel, 386
- Kleinmann et al. (1976) Kleinmann S. G., Brecher K., Ingham W. H., 1976, ApJ, 207, 532
- Koch-Miramond et al. (2002) Koch-Miramond, L., Ábrahám, P., Fuchs, Y., Bonnet-Bidaud, J.-M., Claret, A. 2002, A&A, 396, 877
- Kong et al. (2000) Kong A. K. H., Homer L., Kuulkers E., Charles P. A., Smale A. P., 2000, MNRAS, 311, 405
- Kong et al. (2002) Kong, A. K. H., McClintock, J. E., Garcia, M. R., Murray, S. S., Barret, D. 2002, ApJ, 570, 277
- Körding, Fender & Migliari (2006) Körding E., Fender R. P., Migliari S., 2006, MNRAS, 369, 1451
- Körding, Jester & Fender (2006) Körding E. G., Jester S., Fender R., 2006, MNRAS, 372, 1366
- Kovács (2000) Kovács, G. 2000, A&A, 363, L1
- Kraft et al. (2003) Kraft R. P., Vázquez S. E., Forman W. R., Jones C., Murray S. S., Hardcastle M. J., Worrall D. M., Churazov E., 2003, ApJ, 592, 129
- Krauss et al. (2005) Krauss M. I., et al., 2005, ApJ, 627, 910
- Krolik (1999) Krolik J. H., 1999, Active Galactic Nuclei: From the Central Black Hole to the Galactic Environment, Princeton Univ. Press, Princeton
- Kuulkers (1998) Kuulkers, E. 1998, NewAR, 42, 1
- Kuulkers et al. (2002) Kuulkers E., Homan J., van der Klis M., Lewin W. H. G., Méndez M., 2002, A&A, 382, 947
- Kuulkers et al. (2004) Kuulkers E., et al., 2004, ATel, 240
- Lahav et al. (1993) Lahav O., et al., 1993, Nat, 364, 693
- Landstreet & Angel (1972) Landstreet J. D., Angel J. R. P., 1972, ApJ, 172, 443
- Lawrence et al. (1983) Lawrence A., et al., 1983, ApJ, 271, 793
- Lequeux et al. (1992) Lequeux, J., Maurice, E., Prevot-Burnichon, M.-L., Prevot, L., Rocca-Volmerange, B. 1982, A&A, 113, L15
- Lestrade et al. (1999) Lestrade J.-F., Preston R. A., Jones D. L., Phillips R. B., Rogers A. E. E., Titus M. A., Rioja M. J., Gabuzda D. C., 1999, A&A, 344, 1014
- Levenson et al. (1995) Levenson N. A., Kirshner R. P., Blair W. P., Winkler P. F., 1995, AJ, 110, 739
- Levine et al. (1996) Levine A., Bradt H., Cui W., Jernigan J.G., Morgan E.H., Remillard R., Shirey R.E., Smith D.A., 1996, ApJL, 469, 33
- Lewin et al. (1995) Lewin W. H. G., van Paradijs J., van den Heuvel E. P. J., 1995, X-ray binaries, Cambridge Univ. Press, Cambridge
- Lewin & van der Klis (2006) Lewin W. H. G., van der Klis M., 2006, Compact stellar X-ray sources, Cambridge Astrophysics Series, No. 39. Cambridge, UK, Cambridge University Press
- Lewis et al. (2006) Lewis F., Russell D. M., Fender R. P., Roche P., 2006, Proceedings of the VI Microquasar Workshop: Microquasars and Beyond. September 18-22, 2006, Como, Italy., p.82
- Li & Paczyński (2000) Li L-X., Paczyński B., 2000, ApJ, 534, L197
- Linsky (1977) Linsky J. L., 1977, ‘The Solar Output and its Variation’, ed. O. R. White, Colorado Associated University Press, 477
- Liu et al. (2001) Liu, Q. Z., van Paradijs, J., van den Heuvel, E. P. J. 2001, A&A, 368, 1021
- Liu et al. (2006) Liu, Q. Z., van Paradijs, J., van den Heuvel, E. P. J. 2006, A&A, 455, 1165
- Liu et al. (2007) Liu, Q. Z., van Paradijs, J., van den Heuvel, E. P. J. 2007, A&A, 469, 807
- Maccarone & Coppi (2003) Maccarone T. J., Coppi P. S., 2003, MNRAS, 338, 189
- Maccarone et al. (2003) Maccarone T. J., Gallo E., Fender R. P., 2003, MNRAS, 345, L19
- Machin et al. (1990) Machin, G., et al. 1990, MNRAS, 247, 205
- Mahadevan (1997) Mahadevan R., 1997, ApJ, 477, 585
- Maitra & Bailyn (2004) Maitra, D., Bailyn, C. 2004, ApJ, 608, 444
- Maitra & Bailyn (2005) Maitra, D., Bailyn, C. 2005, ATel, 450
- Maitra & Bailyn (2006) Maitra D., Bailyn C., 2006, ATel, 712
- Maitra & Bailyn (2007) Maitra D., Bailyn C., 2007, ATel, 1080
- Maitra et al. (2003) Maitra, D., Buxton, M., Tourtellotte, S., Bailyn, C. 2003, ATel, 125
- Maitra et al. (2004a) Maitra, D., Bailyn, C., Winnick, R., Espinoza, J., Gonzalez, D. 2004a, ATel, 279
- Maitra et al. (2004b) Maitra, D., Bailyn, C., Winnick, R., Espinoza, J., Gonzalez, D. 2004b, ATel, 288
- Maitra et al. (2007) Maitra D., Russell D. M., Lewis F., Bailyn C., Fender R. P., Roche P., 2007, ATel, 1218
- Malzac et al. (2004) Malzac J., Merloni A., Fabian A. C., 2004, MNRAS, 351, 253
- Margon (1984) Margon B., 1984, ARA&A, 22, 507
- Markoff et al. (2001) Markoff, S., Falcke, H., Fender, R. 2001, A&A, 372, L25
- Markoff et al. (2003) Markoff, S., Nowak, M., Corbel, S., Fender, R., Falcke, H. 2003, A&A, 397, 645
- Markoff et al. (2005) Markoff S., Nowak M.A., Wilms J., 2005, ApJ, 635, 1203
- Markwardt et al. (2005) Markwardt, C. B., Smith, E., Swank, J. H. 2005, ATel, 415
- Marsh et al. (1994) Marsh T. R., Robinson E. L., Wood J. H., 1994, MNRAS, 266, 137
- Martí et al. (1996) Martí J., Rodriguez L. F., Mirabel I. F., Paredes J. M., 1996, A&A, 306, 449
- Masetti et al. (1996) Masetti N., Bianchini A., Bonibaker J., della Valle M., Vio R., 1996, A&A, 314, 123
- Massey et al. (1995) Massey P., Johnson K. E., Degioia-Eastwood K., 1995, ApJ, 454, 151
- Massi (2006) Massi M., 2006, Proceedings of the 363 WE-Heraeus Seminar on: Neutron Stars and Pulsars, Physikzentrum Bad Honnef, Germany, May 14-19 2006, eds. Becker W., Huang H. H., MPE Report 291, 185 (astro-ph/0612780)
- Mavromatakis et al. (2001) Mavromatakis F., Ventura J., Paleologou E. V., Papamastorakis J., 2001, A&A, 371, 300
- McClintock & Remillard (2006) McClintock J. E., Remillard R. A., 2006, in Compact Stellar X-Ray Sources, eds. Lewin W. H. G., van der Klis M., Cambridge University Press, p. 157
- McClintock et al. (1979) McClintock, J. E., Canizares, C. R., Cominsky, L., Li, F. K., Lewin, W. H. G., van Paradijs, J., Grindlay, J. E. 1979, Nature, 279, 47
- McClintock et al. (1983) McClintock J. E., Petro L. D., Remillard R. A., Ricker G. R., 1983, ApJ, 266, L27
- McClintock et al. (1984) McClintock J. E., Remillard R. A., Petro L. D., Hammerschlag-Hensberge G., Proffitt C. R., 1984, ApJ, 283, 794
- McClintock et al. (1995) McClintock, J. E., Horne, K., Remillard, R. A. 1995, ApJ, 442, 358
- McClintock et al. (2003) McClintock J. E., Narayan R., Garcia M. R., Orosz J. A., Remillard R. A., Murray S. S., 2003, ApJ, 593, 435
- McConnell et al. (2000) McConnell M. L. et al., 2000, ApJ, 543, 928
- McGowan et al. (2003) McGowan K. E., Charles P. A., O’Donoghue D., Smale A. P., 2003, MNRAS, 345, 1039
- McHardy et al. (2006a) McHardy I. M., Körding E., Knigge C., Uttley P., Fender R. P., 2006a, Nat, 444, 730
- McHardy et al. (2006b) McHardy I., Uttley P., Taylor R., Papadakis I., 2006b, in AGN Variability from X-Rays to Radio Waves ASP Conference Series, 360, 85
- McKee & Hollenbach (1980) McKee C. F., Hollenbach D. J., 1980, ARA&A, 18, 219
- McNamara et al. (2003) McNamara, B. J., et al. 2003, AJ, 125, 1437
- Meier (2001) Meier D.L., 2001, ApJ, 548, L9
- Merloni et al. (2000) Merloni A., Di Matteo T., Fabian A. C., 2000, MNRAS, 318, L15
- Merloni et al. (2003) Merloni A., Heinz S., di Matteo T., 2003, MNRAS, 345, 1057
- Meyer et al. (2006) Meyer L., Eckart A., Schödel R., Duschl W. J., Muz̆ić K., Dovc̆iak M., Karas V., 2006, A&A, 460, 15
- Meyer-Hofmeister et al. (2005) Meyer-Hofmeister E., Liu B.F., Meyer F., 2005, A&A, 432, 181
- Michael et al. (2000) Michael E., et al., 2000, ApJ, 542, L53
- Migliari & Fender (2006) Migliari S., Fender R. P., 2006, MNRAS, 366, 79
- Migliari et al. (2002) Migliari S., Fender R., Méndez, M., 2002, Sci, 297, 1673
- Migliari et al. (2006) Migliari S., Tomsick J. A., Maccarone T. J., Gallo E., Fender R. P., Nelemans G., Russell D. M., 2006, ApJ, 643, L41
- Migliari et al. (2007) Migliari S., et al., 2007, ApJ, 670, 610
- Mikołajewska et al. (2005) Mikołajewska J., Rutkowski A., Gonçalves D. R., Szostek A., 2005, MNRAS, 362, L13
- Miller et al. (2001) Miller J. M., et al., 2001, ApJ, 563, 928
- Miller et al. (2003) Miller J. M., et al., 2003, MNRAS, 338, 7
- Miller et al. (2006) Miller J. M., Homan J., Steeghs D., Rupen M., Hunstead R. W., Wijnands R., Charles P. A., Fabian A. C., 2006, ApJ, 653, 525
- Mineshige & Wheeler (1989) Mineshige S., Wheeler J. C., 1989, ApJ, 343, 241
- Miniutti & Fabian (2004) Miniutti G., Fabian A. C., 2004, MNRAS, 349, 1435
- Mioduszewski & Rupen (2004) Mioduszewski & Rupen 2004, ApJ, 2004, 615, 432
- Mirabel et al. (1992) Mirabel I. F., Rodríguez L. F., Cordier B., Paul J., Lebrun F., 1992, Nat, 358, 215
- Mirabel & Rodriguez (1998) Mirabel I. F., Rodriguez L. F., 1998, Nature, 392, 673
- Mirabel & Rodrigues (2003) Mirabel I. F., Rodrigues I., 2003, Sci, 300, 1119
- Miyamoto et al. (1995) Miyamoto S., Kitamoto S., Hayashida K., Egoshi W., 1995, ApJ, 442, L13
- Monet et al. (2003) Monet D. G., et al., 2003, AJ, 125, 984
- Moneti (1992) Moneti A., 1992, A&A, 260, L7
- Motch et al. (1982) Motch C., Ilovaisky S. A., Chevalier C., 1982, A&A, 109, L1
- Mukherjee & Paul (2004) Mukherjee, U., Paul, B. 2004, A&A, 427, 567
- Muno & Mauerhan (2006) Muno M. P., Mauerhan J., 2006, ApJ, 648, L135
- Mushotzky & Ferland (1984) Mushotzky R., Ferland G. J., 1984, ApJ, 278, 558
- Nagata et al. (2003) Nagata T., et al., 2003, PASJ, 55, L73
- Naik & Paul (2003) Naik, S., Paul, B. 2003, A&A, 401, 265
- Narayan (1996) Narayan R., 1996, ApJ, 462, 136
- Narayan & Yi (1995) Narayan R., Yi I., 1995, ApJ, 452, 710
- Narayan et al. (1997) Narayan R., Kato S., Honma F., 1997, ApJ, 476, 49
- Narayan et al. (1998) Narayan R., Mahadevan R., Quataert, E., 1998, in Abramowicz M. A., Björnsson G., Pringle J. E., eds, Theory of Black Hole Accretion Disks, Cambridge Univ. Press, Cambridge, p. 148
- Negueruela et al. (2003) Negueruela, I., Israel, G. L., Marco, A., Norton, A. J., Speziali, R. 2003, A&A, 397, 739
- Nelemans et al. (2004) Nelemans, G., Jonker, P. G., Marsh, T. R., van der Klis, M. 2004, MNRAS, 348, L7
- North et al. (2006) North M., Knigge C., Goad M., 2006, MNRAS, 365, 1057
- Nowak (1995) Nowak M.A., 1995, PASP, 107, 1207
- Nowak et al. (2002) Nowak M. A., Wilms J., Dove J. B., 2002, MNRAS, 332, 856
- Nowak et al. (2005) Nowak M. A., Wilms J., Heinz S., Pooley G., Pottschmidt K., Corbel S, 2005, ApJ, 626, 1006
- Nulsen et al. (2005) Nulsen P. E. J., McNamara B. R., Wise M. W., David L. P., 2005, ApJ, 628, 629
- O’Brien et al. (2002) O’Brien K., Horne K., Hynes R. I., Chen W., Haswell C. A., Still M. D., 2002, MNRAS, 334, 426
- Ogley et al. (2000) Ogley R. N., Bell Burnell S. J., Fender R. P., Pooley G. G., Waltman E. B., 2000, MNRAS, 317, 158
- Oke (1977) Oke J. B., 1977, ApJ, 217, 181
- Oke & Greenstein (1977) Oke J. B., Greenstein J. L., 1977, ApJ, 211, 872
- Orlandini et al. (2000) Orlandini M., et al., 2000, A&A, 356, 163
- Orlandini et al. (2004) Orlandini M., et al., 2004, NuPhS, 132, 476
- Orosz & Bailyn (1995) Orosz J. A., Bailyn C. D., 1995, ApJ, 446, L59
- Orosz et al. (1996) Orosz, J. A., Bailyn, C. D., McClintock, J. E., Remillard, R. A. 1996, ApJ, 468, 380
- Orosz et al. (1998) Orosz, J. A., Jain, R. K., Bailyn, C. D., McClintock, J. E., Remillard, R. A. 1998, ApJ, 499, 375
- Orosz et al. (2002) Orosz J. A., et al., 2002, ApJ, 568, 845
- Osterbrock (1989) Osterbrock D. E., 1989, Astrophysics of Gaseous Nebulae and Active Galactic Nuclei. University Science Books, Sausalito CA
- Page et al. (2006) Page M. J., Loaring N. S., Dwelly T., Mason K. O., McHardy I., Gunn K., Moss D., Sasseen T., Cordova F., Kennea J., Seymour N., 2006, MNRAS, 369, 156
- Paizis et al. (2006) Paizis A., et al., 2006, A&A, 459, 187
- Pakull & Angebault (1986) Pakull M. W., Angebault L. P., 1986, Nat, 322, 511
- Papadakis & Lawrence (1993) Papadakis I. E., Lawrence A., 1993, Nat, 361, 233
- Patterson & Raymond (1985) Patterson J., Raymond J. C., 1985, ApJ, 292, 535
- Perlman et al. (2006) Perlman E. S., et al., 2006, ApJ, 651, 735
- Perryman et al. (1997) Perryman M. A. C., et al., 1997, A&A, 323, L49
- Petrucci et al. (2006) Petrucci P-O., Ferreira J., Cabanac C., Henri G., Pelletier G., 2006, Proceedings of the VI Microquasar Workshop: Microquasars and Beyond. September 18-22, 2006, Como, Italy., p.36
- Pope et al. (2006) Pope E. C. D., Pavlovski G., Kaiser C. R., Fangohr H., 2006, MNRAS, 367, 1121
- Poutanen (1998) Poutanen, J. 1998, in Theory of Black Hole Accretion Discs, Cambridge Contemporary Astrophysics, eds. Abramowicz, M. A., Björnsson, G., Pringle, J. E. Cambridge Univ. Press, Cambridge, p. 100
- Predehl & Schmitt (1995) Predehl, P., Schmitt, J. H. M. M. 1995, A&A, 293, 889
- Press et al. (1992) Press W. H., Teukolsky S. A., Vetterling W. T., Flannery B. P., 1992, Numerical Recipes, 2nd edn. Cambridge Univ. Press, Cambridge
- Pretorius et al. (2006) Pretorius M. L., Warner B., Woudt P. A., 2006, MNRAS, 368, 361
- Produit et al. (2006) Produit N., et al., 2006, ATel, 708
- Pun et al. (2002) Pun C. S. J., et al., 2002, ApJ, 572, 906
- Raymond (1979) Raymond J. C., 1979, ApJS, 39, 1
- Rees (1984) Rees M. J., 1984, ARA&A, 22, 471
- Remillard et al. (2006) Remillard R. A., Lin D., the ASM Team at MIT, NASA/GSFC, 2006, ATel, 696
- Reynolds et al. (2007) Reynolds M. T., Callanan P. J., Filippenko A. V., 2007, MNRAS, 374, 657
- Ritter & Kolb (2003) Ritter, H., Kolb, U. 2003, A&A, 404, 301
- Robertson et al. (1976) Robertson B. S. C., Warren P. R., Bywater R. A., 1976, IBVS, 1173, 1
- Roche et al. (2003) Roche P. F., et al., 2003, in Iye M., Moorwood A. F., eds, Proc. SPIE Vol. 4841, Instrument Design and Performance for Optical/Infrared Ground-based Telescopes. SPIE, Bellingham WA, p. 901
- Rodríguez et al. (1992) Rodríguez L. F., Mirabel I. F., Martí J., 1992, ApJ, 401, L15
- Rodriguez et al. (2007) Rodriguez J., Cadolle Bel M., Tomsick J. A., Corbel S., Brocksopp C., Paizis A., Shaw S. E., Bodaghe, A., 2007, ApJ, 655, L97
- Rogers et al. (2006) Rogers K., Jamil O., Kaiser C., Collins R., 2006, Proceedings of the VI Microquasar Workshop: Microquasars and Beyond. September 18-22, 2006, Como, Italy., p.91
- (399) Russell D. M., Fender R. P., Hynes R. I., Brocksopp C., Homan J., Jonker P. G., Buxton M. M., 2006, MNRAS, 371, 1334 (PAPER I)
- (400) Russell D. M., Fender R. P., Gallo E., Miller-Jones J. C. A., Kaiser C. R., 2006, Proceedings of the VI Microquasar Workshop: Microquasars and Beyond. September 18-22, 2006, Como, Italy., p.59 (PAPER II)
- (401) Russell D. M., Fender R. P., Gallo E., Kaiser C. R., 2007, MNRAS, 376, 1341 (PAPER III)
- (402) Russell D. M., Fender R. P., Jonker P. G., 2007, MNRAS, 379, 1108 (PAPER IV)
- (403) Russell D. M., Maccarone T. J., Körding E. G., Homan J., 2007, MNRAS, 379, 1401 (PAPER V)
- (404) Russell D. M., Fender R. P., 2007, MNRAS, submitted (PAPER VI)
- Rutledge et al. (2001) Rutledge, R. E., Bildsten, L., Brown, E. F., Pavlov, G. G., Zavlin, V. E. 2001, ApJ, 551, 921
- Rutledge et al. (2002) Rutledge, R. E., Bildsten, L., Brown, E. F., Pavlov, G. G., Zavlin, V. E. 2002, ApJ, 578, 405
- Rybicki & Lightman (1979) Rybicki G. B., Lightman A. P., 1979, Radiative Processes in Astrophysics. Wiley, New York
- Rykoff et al. (2007) Rykoff E. S., Miller J. M., Steeghs D., Torres M. A. P., ApJ, 666, 1129
- Saikia & Salter (1988) Saikia D. J., Salter C. J., 1988, ARA&A, 26, 93
- Sams et al. (1996) Sams B. J., Eckart A., Sunyaev R., 1996, Nature, 382, 47
- Schulz (1999) Schulz, N. S. 1999, ApJ, 511, 304
- Schulz et al. (2002) Schulz, N. S., Cui, W., Canizares, C. R., Marshall, H. L., Lee, J. C., Miller, J. M., Lewin, W. H. G. 2002, ApJ, 565, 1141
- Schultz et al. (2004) Schultz J., Hakala P., Huovelin J., 2004, BaltA, 13, 581
- Schurch et al. (2007) Schurch M. P. E., Coe M. J., McGowan K. E., McBride V. A., Buckley D. A., Galache J. L., Corbet R. H. D., 2007, MNRAS, 381, 1561
- Schwartz (1983) Schwartz R. D., 1983, ARA&A, 21, 209
- Sekiguchi & van Wyk (1993) Sekiguchi K., van Wyk F., 1993, IAUC, 5769
- Serkowski et al. (1975) Serkowski K., Mathewson D. L., Ford V. L., 1975, ApJ, 196, 261
- Shahbaz et al. (1993) Shahbaz, T., Naylor, T., Charles, P. A. 1993, MNRAS, 265, 655
- Shahbaz et al. (1999) Shahbaz T., Bandyopadhyay R. M., Charles P. A., 1999, A&A, 346, 82
- Shahbaz et al. (2001) Shahbaz, T., Fender, R., Charles, P. A. 2001, A&A, 376, L17
- Shahbaz et al. (2003a) Shahbaz T., et al., 2003a, MNRAS, 346, 1116
- Shahbaz et al. (2003b) Shahbaz T., Zurita C., Casares J., Dubus G., Charles P. A., Wagner R. M., Ryan E., 2003b, ApJ, 585, 443
- Shahbaz et al. (2004) Shahbaz T., et al., 2004, MNRAS, 354, 31
- Shahbaz et al. (2007) Shahbaz T., Fender R. P., Watson C. A., O’Brien K., 2007, ApJ, submitted
- Shakhovskoi & Efimov (1975) Shakhovskoi N. M., Efimov I. S., 1975, IAUS, 67, 487
- Shakura & Sunyaev (1973) Shakura N. I., Sunyaev R. A., 1973, A&A, 24, 337
- Shaposhnikov et al. (2007) Shaposhnikov N., Swank J., Shrader C. R., Rupen M., Beckmann V., Markwardt C. B., Smith D. A., 2007, ApJ, 655, 434
- Shaw et al. (2005) Shaw S. E., et al., 2005, A&A, 432, L13
- Shirey (1998) Shirey R. E., 1998, PhD Thesis, MIT
- Shklovsky (1967) Shklovsky I. S., 1967, ApJ, 148, L1
- Shrader et al. (1994) Shrader C. R., Wagner R. M., Hjellming R. M.., Han X. H., Starrfield S. G., 1994, ApJ, 434, 698
- Shrader et al. (1997) Shrader, C. R., Wagner, R. M., Charles, P. A., Harlaftis, E. T., Naylor, T. 1997, ApJ, 487, 858
- Shull & McKee (1979) Shull J. M., McKee C. F., 1979, ApJ, 227, 131
- Simpson et al. (2006) Simpson E. K., Baliunas S., Henry G., 2006, AAS, 209, 152, 1105
- Smith et al. (2002) Smith D. M., Heindl W. A., Swank J. H., 2002, ApJ, 569, 362
- Soria & Wu (1999) Soria R., Wu K., 1999, IAUC, 7184
- Soria et al. (1999) Soria R., Wu K., Johnston H. M., 1999, MNRAS, 310, 71
- Soria et al. (2001) Soria, R., Wu, K., Page, M. J., Sakelliou, I. 2001, A&A, 365, L273
- Spencer (1979) Spencer R. E., 1979, Nat, 282, 483
- Spitzer (1978) Spitzer L., 1978, Physical processes in the interstellar medium, New York Wiley-Interscience, 333
- Stanek & Garnavich (1998) Stanek K. Z., Garnavich P. M., 1998, ApJ, 503, L131
- Stark & Saia (2003) Stark, M. J., Saia, M. 2003, ApJ, 587, L101
- Steeghs & Casares (2002) Steeghs, D., Casares, J. 2002, ApJ, 568, 273
- Steeghs et al. (2004) Steeghs D., Blake C., Bloom J. S., Torres M. A. P., Jonker P. G., Starr D., 2004, ATel, 363
- Steeghs et al. (2005a) Steeghs D., Torres M. A. P., Blake C., Bloom J. S., 2005a, ATel, 533
- Steeghs et al. (2005b) Steeghs D., et al., 2005b, ATel, 543
- Steele et al. (1998) Steele I. A., Negueruela I., Coe M. J., Roche P., 1998, MNRAS, 297, L5
- Stewart et al. (1993) Stewart R. T., Caswell J. L., Haynes R. F., Nelson G. J., 1993, MNRAS, 261, 593
- Stirling et al. (2001) Stirling A. M., Spencer R. E., de la Force C. J., Garrett M. A., Fender R. P., Ogley R. N., 2001, MNRAS, 327, 1273
- Strohmayer et al. (2003) Strohmayer T. E., Markwardt C. B., Swank J. H., in’t Zand J., 2003, ApJ, 596, L67
- Summons et al. (2007) Summons D. P., Arévalo P., McHardy I. M., Uttley P., Bhaskar A., 2007, MNRAS, 378, 649
- Sutaria et al. (2002) Sutaria F. K., et al., 2002, A&A, 391, 993
- Szkody et al. (1989) Szkody P. et al., 1989, IAUC, 4794
- Tanaka (1993) Tanaka, Y. 1993, IAUC, 5877
- Tananbaum et al. (1972) Tananbaum H., Gursky H., Kellogg E., Giacconi R., Jones C., 1972, ApJ, 177, L5
- Thompson et al. (1979) Thompson R. I., Rieke G. H., Tokunaga A. T., Lebofsky M. J., 1979, ApJ, 234, L135
- Thorne (1974) Thorne K. S., 1974, ApJ, 191, 507
- Thorstensen et al. (1978) Thorstensen J., Charles P., Bowyer S., 1978, ApJ, 220, L131
- Tomsick et al. (2001) Tomsick J. A., Corbel S., Kaaret P., 2001, ApJ, 563, 229
- Tomsick et al. (2003a) Tomsick J. A., et al., 2003a, ApJ, 597, L133
- Tomsick et al. (2003b) Tomsick J. A., Corbel S., Fender R., Miller J. M., Orosz J. A., Tzioumis T., Wijnands R., Kaaret P., 2003b, ApJ, 582, 933
- Tomsick et al. (2004) Tomsick J. A., Gelino D. M., Halpern J. P., Kaaret P., 2004, ApJ, 610, 933
- Torres et al. (2002) Torres, M. A. P., Casares, J., Martnez-Pais, I. G., Charles, P. A. 2002, MNRAS, 334, 233
- Torres et al. (2004) Torres, M. A. P., Callanan, P. J., Garcia, M. R., Zhao, P., Laycock, S., Kong, A. K. H. 2004, ApJ, 612, 1026
- Torres et al. (2005) Torres, M. A. P., Steeghs, D., Jonker, P., Martini, P. 2005, ATel, 417
- Torres et al. (2007) Torres M. A. P., et al., 2007, ApJ, submitted (astro-ph/0701095)
- Treves et al. (1980) Treves A., et al., 1980, ApJ, 242, 1114
- Treves et al. (1987) Treves A., Maraschi L., Tanzi E. G., Falomo R., Bouchet P., 1987, IAUC, 4309, 3
- Treves et al. (1988) Treves A., Belloni T., Bouchet P., Chiappetti L., Falomo R., Maraschi L., Tanzi E. G., 1988, ApJ, 335, 142
- Tudose et al. (2006) Tudose V., Fender R. P., Kaiser C. R., Tzioumis A. K., van der Klis M., Spencer R., 2006, MNRAS, 372, 417
- Ueda et al. (2002) Ueda Y., et al., 2002, ApJ, 571, 918
- Uemura et al. (2000) Uemura M., et al., 2000, PASJ, 52, L15
- Uemura et al. (2004) Uemura M., et al., 2004, PASJ, 56, 61
- Vancura et al. (1992) Vancura O., Blair W. P., Long K. S., Raymond J. C., 1992, ApJ, 394, 158
- van den Heuvel & Heise (1972) van den Heuvel, E. P. J., Heise, J. 1972, Nature, 239, 67
- van den Heuvel (1992) van den Heuvel E. P. J., 1992, in Environment Observation and Climate Modelling through International Space Projects, Vol. 3, ed. T. Guyenne & J. Hunt (Noordwijk: ESA/ESTEC), 77
- van der Klis (2006) van der Klis M., 2006, in Compact Stellar X-Ray Sources, eds. Lewin W. H. G., van der Klis M., Cambridge University Press, p. 39
- van Kerkwijk et al. (1996) van Kerkwijk, M. H., Geballe, T. R., King, D. L., van der Klis, M., van Paradijs, J. 1996, A&A, 314, 521
- van Paradijs et al. (1980) van Paradijs J., Verbunt F., van der Linden T., Pedersen H., Wamsteker W., 1980, ApJ, 241, L161
- van Paradijs et al. (1990) van Paradijs J., et al., 1990, A&A, 235, 156
- van Paradijs & McClintock (1994) van Paradijs J., McClintock J. E., 1994, A&A, 290, 133
- van Paradijs & McClintock (1995) van Paradijs J., McClintock J. E., 1995, in Optical and Ultraviolet Observations of X-ray Binaries, eds, Lewin, W. H. G., van Paradijs, J., van den Heuvel, E. P. J. Cambridge Univ. Press, Cambridge, p. 58
- van Straaten et al. (2000) van Straaten, S., Ford, E. C., van der Klis, M., Mndez, M., Kaaret, P. 2000, ApJ, 540, 1049
- Vrtilek et al. (1990) Vrtilek S. D., Raymond J. C., Garcia M. R., Verbunt F., Hasinger G., Kurster M., 1990, A&A, 235, 162
- Vrtilek et al. (1991a) Vrtilek S. D., McClintock J. E., Seward F. D., Kahn S. M., Wargelin B. J., 1991a, ApJS, 76, 1127
- Vrtilek et al. (1991b) Vrtilek S. D., Penninx W., Raymond J. C., Verbunt F., Hertz P., Wood K., Lewin W. H. G., Mitsuda K., 1991b, ApJ, 376, 278
- Wachter (1997) Wachter S., 1997, ApJ, 485, 839
- Wachter & Margon (1996) Wachter S, Margon, B., 1996, AJ, 112, 2684
- Wachter et al. (2002) Wachter, S., Hoard, D. W., Bailyn, C. D., Corbel, S., Kaaret, P. 2002, ApJ, 568, 901
- Wagner et al. (1991) Wagner R. M., et al., 1991, ApJ, 378, 293
- Wang et al. (2001) Wang Z., et al., 2001, ApJ, 563, L61
- Wang et al. (2005) Wang Q. D., et al., 2005, ApJ, 635, 386
- Welsh et al. (2000) Welsh, W. F., Robinson, E. L., Young, P. 2000, AJ, 120, 943
- Westfold (1959) Westfold K. C., 1959, ApJ, 130, 241
- White et al. (1995) White N. E., Nagase F., Parmar A. N., 1995, in The properties of X-ray binaries, eds, Lewin, W. H. G., van Paradijs, J., van den Heuvel, E. P. J. Cambridge Univ. Press, Cambridge, p. 1
- Whitelock et al. (2004) Whitelock P. A., Feast M. W., Marang F., Breedt E., 2004, MNRAS, 352, 447
- Wijnands & van der Klis (2000) Wijnands R., van der Klis M., 2000, ApJ, 528, L93
- Williams et al. (2004) Williams B. F., Garcia M. R., Kong A. K. H., Primini F. A., King A. R., Di Stefano R., Murray S. S., 2004, ApJ, 609, 735
- Williams et al. (2005) Williams, B. F., Garcia, M. R., McClintock, J. E., Kong, A. K. H., Primini, F. A., Murray, S. S. 2005, ApJ, 628, 382
- Willis et al. (2005) Willis D. R., Barlow E. J., Bird A. J., Clark D. J., Dean A. J., McConnell M. L., Moran L., Shaw S. E., Sguera V., 2005, A&A, 439, 245
- Wilms et al. (2001) Wilms, J., Nowak, M. A., Pottschmidt, K., Heindl, W. A., Dove, J. B., Begelman, M. C. 2001, MNRAS, 320, 327
- Wilson et al. (2006) Wilson A. S., Smith D. A., Young A. J., 2006, ApJ, 644, L9
- Witham et al. (2006) Witham A. R., et al., 2006, MNRAS, 369, 581
- Wolinski et al. (1996) Wolinski K. G., Dolan J. F., Boyd P. T., Biggs J. D., Nelson M. J., Percival J. W., Taylor M., van Citters G. W., 1996, ApJ, 457, 859
- Wu et al. (1982) Wu, C.-C., Holm, A. V., Eaton, J. A., Milgrom, M., Hammerschlag-Hensberge, G. 1982, PASP, 94, 149
- Xu et al. (2005a) Xu J-W., Zhang X-Z., Han J-L., 2005a, ChJAA, 5, 165
- Xu et al. (2005b) Xu J-W., Zhang X-Z., Han J-L., 2005b, ChJAA, 5, 442
- Yu et al. (2003) Yu W., Klein-Wolt M., Fender R., van der Klis M., 2003, ApJ, 589, L33
- Yu et al. (2004) Yu W., van der Klis M., Fender R., 2004, ApJ, 611, L121
- Yuan et al. (2004) Yuan F., Quataert E., Narayan R., 2004, ApJ, 606, 894
- Yuan et al. (2005) Yuan F., Cui W., Narayan R., 2005, ApJ, 620, 905
- Yuan et al. (2007) Yuan F., Zdziarski A. A., Xue Y., Wu X.-B., 2007, ApJ, 659, 541
- Zacharias et al. (2004) Zacharias N., Monet D. G., Levine S. E., Urban S. E., Gaume R., Wycoff G. L., 2004, AAS, 205, 4815
- Zdziarski (1998) Zdziarski A.A., 1998, MNRAS, 296L, 51
- Zdziarski et al. (1998) Zdziarski, A. A., Poutanen, J., Mikołajewska, J., Gierliski, M., Ebisawa, K., Johnson, W. N. 1998, MNRAS, 301, 435
- Zdziarski et al. (2004) Zdziarski, A. A., Gierliski, M., Mikołajewska, J., Wardziski, G., Smith, D. M., Alan Harmon, B., Kitamoto, S. 2004, MNRAS, 351, 791
- Zhang et al. (1997) Zhang S. N., Cui W., Harmon B. A., Paciesas W. S., Remillard R. E., van Paradijs J., 1997, ApJ, 477, L95
- Zhang et al. (2007) Zhang C. M., Yin H. X., Zhao Y. H., 2007, PASP, 119, 393
- Zorec & Briot (1991) Zorec J., Briot D., 1991, A&A, 245, 150
- Zurita et al. (2002) Zurita C., et al., 2002, MNRAS, 334, 999
- Zurita et al. (2003) Zurita C., Casares J., Shahbaz T., 2003, ApJ, 582, 369
- Zurita et al. (2004) Zurita C., Casares J., Hynes R. I., Shahbaz T., Charles P. A., Pavlenko E. P., 2004, MNRAS, 352, 877
- Życki et al. (1999) Życki, P. T., Done, C., Smith, D. A. 1999, MNRAS, 309, 561