A downward revision to the distance of the 1806–20 cluster and associated magnetar from Gemini near-Infrared spectroscopy
Abstract
We present - and -band spectroscopy of OB and Wolf-Rayet (WR) members of the Milky Way cluster 1806–20 (G10.0–0.3), to obtain a revised cluster distance of relevance to the 2004 giant flare from the SGR 1806–20 magnetar. From GNIRS spectroscopy obtained with Gemini South, four candidate OB stars are confirmed as late O/early B supergiants, while we support previous mid WN and late WC classifications for two WR stars. Based upon an absolute -band magnitude calibration for B supergiants and WR stars, and near-IR photometry from NIRI at Gemini North plus archival VLT/ISAAC datasets, we obtain a cluster distance modulus of 14.70.35 mag. The known stellar content of the 1806–20 cluster suggests an age of 3–5 Myr, from which theoretical isochrone fits infer a distance modulus of 14.70.7 mag. Together, our results favour a distance modulus of 14.70.4 mag (8.7 kpc) to the 1806–20 cluster, which is significantly lower than the nominal 15 kpc distance to the magnetar. For our preferred distance, the peak luminosity of the December 2004 giant flare is reduced by a factor of three to 7 1046 ergs-1, such that the contamination of BATSE short gamma ray bursts (GRB’s) from giant flares of extragalactic magnetars is reduced to a few percent. We infer a magnetar progenitor mass of M⊙, in close agreement with that obtained recently for the magnetar in Westerlund 1.
keywords:
stars: Wolf-Rayet - stars: early-type - Open clusters and associations: individual: 1806–20 - pulsars: individual: SGR 1806–20 - Galaxy: kinematics and dynamics1 Introduction
Magnetars are highly magnetized neutron stars, representing a small subset of slowly rotating pulsars undergoing rapid spin down, and are observationally associated with Anomalous X-ray Pulsars (AXP’s) and Soft Gamma Repeaters (SGR’s). To date only four examples of SGR’s are known, characterised by multiple, soft gamma-ray bursts, typically 1041 erg s-1 in peak luminosity, plus rare giant flares of 1045 erg s-1 peak luminosity. One such giant flare, from SGR 1806–20 (Kouveliotou et al., 1998), was detected on 27 December 2004 by many satellites including the Burst Alert Telescope (BAT) on Swift (Palmer et al., 2005), and in January 2005 the radio afterglow was detected by Cameron et al. (2005) through VLA observations.
It is believed that massive stars are the progenitors of magnetars, on the basis that several magnetars are associated with young massive clusters, including SGR 1806–20 which is apparently within a cluster at G10.0-0.3, forming part of the W31 complex. However, a distance of 12–15 kpc has been proposed for the 1806–20 cluster (Eikenberry et al., 2004; Figer et al., 2004), yet direct H I measurements for the magnetar suggest 6–10 kpc (Cameron et al., 2005), though the latter has been questioned by McClure-Griffiths & Gaensler (2005).
Adopting a distance of 15 kpc suggests SGR 1806–20 had a peak luminosity of 2 erg s-1 during the December 2004 giant flare, meaning magnetars at distances of up to 30 Mpc could be mistaken for short gamma-ray bursts (GRB’s). For this distance, as much as 40% of all short GRB’s identified by the Burst And Transient Source Experiment (BATSE) might be giant flares(Hurley et al., 2005), falling to just 3% if a distance of 6 kpc were adopted for SGR 1806–20.


The cluster contains young massive stars including OB stars, WR stars and a Luminous Blue Variable (LBV) (van Kerkwijk et al., 1995; Figer et al., 2004; Eikenberry et al., 2004). If the magnetar is physically associated with this cluster and lies at 15 kpc then a high mass for the LBV, and hence the magnetar progenitor, of 133 M⊙ is indicated (Eikenberry et al., 2004). However this is much larger than the 40–55 M⊙ progenitor of the AXP found in Westerlund 1, whose stellar content is reminiscent of the SGR 1806–20 cluster (Muno et al., 2006; Clark et al., 2008).
In this letter, spectra of several massive stars within the cluster are presented in Section 2. In Section 3, spectral types are determined together with estimates of absolute magnitude for each star. This allows the cluster distance and age to be obtained in Section 4 and compared to that of the magnetar. Conclusions are drawn in Section 5.
2 Observations
Spectroscopic data of 1806–20 cluster members were obtained from the Gemini Near-Infrared Spectrograph (GNIRS) instrument at Gemini South. New near-IR photometry was provided by the NIRI instrument at Gemini North111Following severe damage to GNIRS in April 2007, spectroscopy of additional 1806–20 cluster members were obtained with NIRI at Gemini North, but these did not improve on previously published work due to a misaligned slit and low spectral resolution.., supplemented by Very Large Telescope (VLT) Infrared Spectrometer And Array Camera (ISAAC) and New Technology Telescope (NTT) Son of ISAAC (SofI) archival observations.
2.1 Photometry
NIRI - band acquisition images of the 1806–20 cluster were obtained on July 13-14 2007 during conditions with an image quality of 0.35 arcsec (3 pix) FWHM. 2MASS - band photometry of isolated, bright sources 2, 6, 11, and 12 from Figer et al. (2004) provided a zero point, from which errors of 0.03 mag were obtained. In addition - band archival VLT ISAAC images from March 17 2005 (program 274.D.5048) obtained with an image quality of 0.4 arcsec (2.4 pixel FWHM), plus 2MASS - band photometry of the same bright sources as used with NIRI provided zero points and errors of 0.02 mag. In the case of star B from Eikenberry et al. (2004) the ISAAC images were saturated. For this star we resorted to archival NTT SofI band images from July 31 2003 (program 271.D.5041) for which an image quality of FWHM 1.1 arsec (8 pix) was measured, again with zero points from 2MASS and errors of 0.1 mag.
2.2 Spectroscopy
We used the GNIRS instrument on the 8 m Gemini South telescope at Cerro Pachon, Chile on April 8–9 2007 to observe a number of massive stars associated with cluster 1806–20 during -band seeing conditions of FWHM 0.5 arcsec. Spectroscopic data were obtained in the - band over a wavelength range 1.625–1.775 m and in the - band for 2.025–2.225 m. The slit width was 3 pixels (0.45 arcseconds), providing a resolution R 3700. Individual exposures of 270s (- band) and 80s (- band) were combined producing total exposures of 640–960 seconds (- band) and 2160–3240 seconds (- band).
The telescope was nodded along three slit positions of differing position angle, allowing observations of star C from Eikenberry et al. (2004) plus stars 1, 2, 4, 7, and 11 from Figer et al. (2005), which allowed pairs of images for sky subtraction. Internal Argon lamp images were obtained immediately before or after each slit position, providing an accurate wavelength calibration. Further spectra were obtained for the telluric standard star HIP89384 (B6 V) with an identical setup, except reduced exposure times of 30 seconds in both the - and - band, for which sky lines were used to provide a wavelength calibration. Calibration flat fields and dark frames were also obtained.
Initial data reduction (sky subtraction, flat fielding and wavelength calibration) was done using the Image Reduction and Analysis Facility (IRAF)222IRAF is distributed by the National Optical Astronomy Observatories, which are operated by the Association of Universities for Research in Astronomy, Inc., under cooperative agreement with the National Science Foundation. then spectra for each object observed were extracted. STARLINK packages were then used to telluric correct and normalise the spectra. Stellar Brackett lines from the telluric standard star were fit using empirical profiles from high spectral resolution observations of late B/early A dwarfs of Hanson et al. (2005).
3 Spectroscopy of 1806–20 Cluster Members
We supplemented GNIRS observations of stars 1, 2, 4, 7, and 11 from Figer et al. (2005) with their observations of star 3 plus GNIRS spectroscopy of Star C from Eikenberry et al. (2004) with their observations of stars B and D. After reduction and calibration, the observed spectra were compared to template stars from the spectral atlases of Hanson et al. (2005) for OB stars and Crowther & Smith (1996) for WR stars.
3.1 OB Stars
In Figure 1, GNIRS spectra of cluster OB stars are compared to template supergiants from Hanson et al. (2005). In the - band, stars C and 7 clearly shows He I 1.700m absorption but the He II 1.692m line is not present, indicating that they are early B stars. Star C shows strong Br 10 absorption supporting a classification of B1–3 I. Similarly, star 7 shows a relatively weak Br 10 line, indicating B0–1 I. - band observations support these classifications since the presence of the N III 2.115m emission in star 7 is common to B0–1 supergiants, where N III 2.115m absorption in star C is shared with B1–3 supergiants. Later subtypes are excluded from the observed strength of He I features, and again no evidence for He II 2.189m is seen.
| Sp Type | ()0 | ()0 | |||
|---|---|---|---|---|---|
| O9.5 I | –6.4 0.5 | –0.71 | –0.08 | –5.7 0.5 | –3.4 |
| B0 I | –6.6 0.5 | –0.75 | –0.08 | –5.85 0.5 | –3.3 |
| B1 I | –6.9 0.5 | –0.62 | –0.08 | –6.3 0.5 | –2.65 |
| B2 I | –7.1 0.5 | –0.53 | –0.08 | –6.6 0.5 | –2.1 |
| B3 I | –7.1 0.5 | –0.36 | –0.05 | –6.7 0.5 | –1.7 |
Star 11 shows relatively weak Br 11 1.681m and Br 10 1.736m absorption in the - band, indicating an B0 I spectral type, whilst its - band spectra is ambiguous due to the lack of Br , as noted by Figer et al. (2005). Weak He II 2.189m absorption is present in star 4, supporting an O9.5 I spectral classification.
In all these cases OB supergiant classifications proposed by Eikenberry et al. (2004) and Figer et al. (2005) are supported for which we are able to provide more refined subtypes, albeit unable to distinguish between Ia and Ib luminosity classes.
| Star | Spect. | |||||||
|---|---|---|---|---|---|---|---|---|
| Type | mag | mag | mag | mag | mag | mag | mag | |
| #1 | WC9d | 11.60 | 2.16 | +1.10 | 1.06 | |||
| #2 | WN6b | 12.16 | 1.89 | +0.27 | 1.62 | 2.95 0.5 | –4.77 0.7 | 13.98 0.86 |
| #3 | WN7 | 12.58 | 1.67 | +0.11 | 1.56 | 2.84 0.48 | –5.92 0.8 | 15.93 0.93 |
| #4 | O9.5 I | 11.92 | 1.55 | –0.09 | 1.64 | 2.98 0.5 | –5.7 0.5 | 14.64 0.71 |
| #7 | B0–B1 I | 11.87 | 1.55 | –0.08 | 1.63 | 2.97 0.49 | –6.0 0.8 | 14.90 0.94 |
| #11 | B0 I | 11.90 | 1.63 | –0.08 | 1.71 | 3.11 0.52 | –5.85 0.5 | 14.64 0.72 |
| B | WC9d | 10.40 | 3.03 | +1.10 | 1.93 | |||
| C | B1–B3 I | 10.96 | 1.81 | –0.08 | 1.89 | 3.43 0.57 | –6.50 0.8 | 13.88 0.98 |
| D | OB I | 11.06 | 1.69 | –0.09 | 1.78 | |||
| Average | 3.00 0.3 | 14.69 0.35 |
3.2 WR Stars
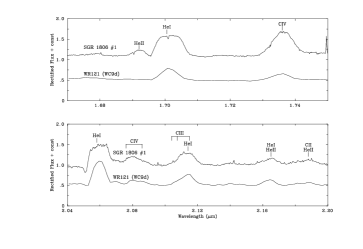
Star 1 from Figer et al. (2005) has previously been identified as a WC8 star. However inspection of GNIRS spectroscopy in Figure 2 reveals that the relative strength of the C IV 1.736m to the He I 1.700m emission is too low for a WC8 star and is more typical of dusty WC9 stars such as WR121. Moreover, the C IV 2.076m/C III 2.110m ratio is consistent with other observations of dusty WC9 stars by Crowther et al. (2006a). Warm circumstellar dust contributes to their near IR flux, resulting in emission lines appearing relatively weak with respect to non-dusty WC9 stars, for example WR88 from Eenens et al. (1991), from which a WC9d spectral type results for star 1.
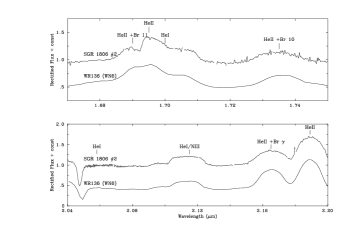
The GNIRS spectra for star 2 presented in Figure 3 produces a classification of a broad-lined WN6 star (WN6b), in agreement with Figer et al. (2005). This is evident from the strong He II 2.189m emission compared to the weaker He I/N III 2.115m and Br emission. A later WN classification would require a higher Br to He II 2.189m ratio (Crowther et al. 2006a).
4 Distance to 1806–20 cluster
We are now in a position to determine the distance to the 1806–20 cluster from both spectroscopic methods, using absolute magnitude versus spectral type calibrations for OB and WR stars and from fitting isochrones to the position of OB supergiants in the Hertzsprung-Russell (HR) diagram.
4.1 Absolute Magnitude Calibration
The near IR absolute magnitude calibration for O stars (Martins & Plez, 2006) does not extend to early B supergiants. Consequently absolute visual magnitude calibration of B supergiants from Conti et al. (2008) are used together with synthetic near-infrared intrinsic colours of early B supergiants from Crowther, Lennon & Walborn (2006b) to obtain a -band absolute magnitude calibration, as shown in Table 1. The empirical spread in our OB supergiant calibration is estimated to be 0.5 mag. For comparison, at O9.5 I, which is common to both calibrations, Martins & Plez (2006) obtain MK = –5.52 mag, = –0.10 mag and BCK = –3.66 mag.
For WR stars, absolute magnitudes from Crowther et al. (2006a) were used for calibration, with a typical spread of 0.7 mag. Intrinsic colours are drawn from the same sources with typical uncertainties of 0.05 mag. Dusty WC stars span a much wider range in both absolute magnitude (MK = –8.51.5 mag) and intrinsic colour [()o = 1.10.6] at near IR wavelengths than normal WC stars, preventing their use as reliable distance indicators (Crowther et al. 2006a).
4.2 Spectroscopic Distance
Observed colours of OB and WR stars in the 1806–20 cluster provide a direct measurement of interstellar extinction from (Indebetouw et al., 2005). These are presented in Table 2, from which a mean 3.00.3 mag is obtained, together with distance moduli for each star, based upon absolute magnitude calibrations, from which dusty WC stars were excluded, as explained above. A mean distance modulus of 14.690.35 mag results from this spectroscopic study, corresponding to 8.7 kpc.
4.3 Distance from Isochrone Fitting
Alternatively, theoretical isochrones may be used to estimate the distance to the 1806–20 cluster if limits upon the cluster age are available. As noted above, this cluster hosts OB stars, an LBV, together with helium burning WN and WC stars, a stellar content in common with other massive star clusters within the inner Milky Way. These include Westerlund 1 and the Quintuplet cluster, for which ages of 4-5 Myr and 41 Myr have been inferred by Crowther et al. (2006a) and Figer et al. (1999), respectively.
OB supergiants #4 (O9.5 I) and 11 (B0 I) have the best determined spectral types, from which stellar temperatures (29kK and 27.5kK) and luminosities can be derived (Crowther et al. 2006b), the latter obtained from -band bolometric corrections (BC, see Table 1). For a variety of different adopted distances, these two stars provide cluster ages using isochrones from Lejeune & Schaerer (2001), which are based upon high mass-loss rate, solar metallicity evolutionary models from Meynet et al. (1994). Table 3 presents ages, OB supergiant and (minimum) magnetar initial masses for distance moduli in the range 14.0 (6.3 kpc) to 15.9 (15 kpc). Large distances would require these stars to be hypergiants, characterised by an emission line spectrum, for which there is no spectroscopic evidence. From above a distance modulus of 14.70.7 mag (6.3–12 kpc) is obtained, together with a magnetar progenitor mass of 35–100 M⊙.
4.4 Comparison with Previous Work
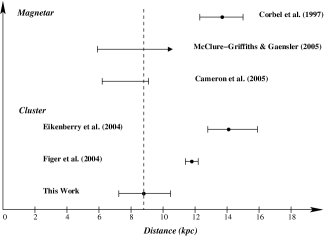
Together these two methods of estimating the distance to the 1806–20 cluster suggest a distance modulus of 14.70.4 mag (8.7 kpc). This is substantially lower the nominal 15 kpc kinematic distance to the magnetar obtained by Corbel et al. (1997) from CO observations which was supported by Eikenberry et al. (2004) from the nebular Br emission (Local Standard of Rest) velocity for LBV 1806–20. In Figure 4 the cluster distance from this work is compared to Eikenberry et al. (2004) and Figer et al. (2004), adapted to a Galactic Centre distance of 8 kpc (Reid, 1993) and the Brand & Blitz (1993) rotation model. In addition, magnetar distances from Corbel et al. (1997), Cameron et al. (2005) and McClure-Griffiths & Gaensler (2005) are included, also updated for a Galactic Centre distance of 8 kpc.
Our distance reconciles the previously inconsistent cluster and magnetar distances. In addition, OB supergiant stellar He I 1.700m and Br line profiles from GNIRS reveal V 130 km s-1, indicating kinematic distances of either 6.8 kpc or 8.9 kpc, in good agreement with both the spectroscopic parallax and isochrone fitting methods (previous studies implied VLSR=10–35 km s-1, from Corbel et al. (1997) and Figer et al. (2004))
| Star | Log | Age | ||||||
|---|---|---|---|---|---|---|---|---|
| (mag) | (kpc) | (mag) | (mag) | (K) | (Myr) | (M⊙) | (M⊙) | |
| 14.0 | 6.3 | #4 | –5.1 | –8.5 | 4.46 | 5 | 30 | 35 |
| #11 | –5.2 | –8.5 | 4.44 | 30 | 35 | |||
| 14.3 | 7.2 | #4 | –5.4 | –8.8 | 4.46 | 4.6 | 33 | 40 |
| #11 | –5.5 | –8.8 | 4.44 | 33 | 40 | |||
| 14.7 | 8.7 | #4 | –5.8 | –9.2 | 4.46 | 4 | 40 | 48 |
| #11 | –5.9 | –9.2 | 4.44 | 40 | 48 | |||
| 15.1 | 10.5 | #4 | –6.2 | –9.6 | 4.46 | 3.4 | 49 | 69 |
| #11 | –6.2 | –9.6 | 4.44 | 49 | 69 | |||
| 15.4 | 12 | #4 | –6.5 | –9.9 | 4.46 | 3 | 55 | 100 |
| #11 | –6.6 | –9.9 | 4.44 | 55 | 100 | |||
| 15.9 | 15 | #4 | –7.0 | –10.4 | 4.46 | 2.8 | 80 | 120 |
| #11 | –7.1 | –10.4 | 4.44 | 80 | 120 |
5 Discussion and Conclusions
A revised distance of 8.7 kpc to the 1806–20 cluster is obtained from this work, reconciling previous cluster and magnetar distances, from which a magnetar progenitor mass of M⊙ is inferred, consistent with estimates for the Westerlund 1 magnetar (AXP) from Muno et al. (2006) and Clark et al. (2008). Similar conclusions were reached by Figer et al. (2005). The observed association between magnetars and supernova remnants suggests that magnetars are young neutron stars ( yr, Gaensler et al. (2001)), so the actual progenitor mass ought to be close to the values listed in Table 3. Following the approach of Figer et al. (2004), we estimate a mass of 36 M⊙ for LBV 1806–20 based on our revised distance, assuming it is a binary with equal mass components.
This distance represents a major downward revision to the current adopted magnetar distance of 15 kpc, suggesting a peak luminosity of 71046 ergs-1 for the December 2004 giant flare. Hurley et al. (2005) argue that up to 40 of all BATSE short GRB’s could be giant flares from magnetars, if one was to adopt a 15 kpc distance to SGR 1806–20 and a frequency of giant flares of one per 30 yr per Milky Way galaxy. For the revised distance, perhaps only 8 of BATSE short GRB’s have an origin in magnetar giant flares.
Our preferred distance of 8.7 kpc to the 1806–20 cluster suggests active star formation at a distance of 1.6 kpc from the centre of the Milky Way. It is well known that the amount of molecular hydrogen is greatly reduced interior to the bar at 4 kpc (Benjamin et al., 2005) causing a deficiency in HII regions (Russeil, 2003) in the inner Milky Way, apart from the Galactic Centre region itself. Apparently relatively massive clusters can form within this region. From the current massive star census, a cluster mass in excess of 3103 M⊙ is estimated from comparison with the Quintuplet cluster, albeit based upon highly incomplete statistics. Further spectroscopic studies of the 1806–20 cluster are recommended to further refine the distance and detailed stellar content.
Acknowledgements
Based on observations obtained at the Gemini Observatory, which is operated by AURA Inc., under a cooperative agreement with the NSF on behalf of the Gemini partnership: the NSF (United States), the STFC (United Kingdom), the NRC (Canada), CONICYT (Chile), the ARC (Australia), CNPq (Brazil) and SECYT (Argentina). This publication makes use of data products from 2MASS, which is a joint project of the University of Massachusetts and the IPAC/CalTech, funded by the NASA and the NSF, and is based in part on archival observations from the ESO Science Archive Facility collected at the La Silla Paranal Observatory. JLB and JPF acknowledge financial support from STFC.
References
- Benjamin et al. (2005) Benjamin R. A. et al. 2005, ApJ, 630, L149
- Brand & Blitz (1993) Brand J., Blitz L., 1993, A&A, 275, 67
- Cameron et al. (2005) Cameron P. B. et al. 2005, Nat, 434, 1112
- Clark et al. (2008) Clark J. S., Muno M. P., Negueruela I., Dougherty S. M., Crowther P. A., Goodwin S. P., de Grijs R., 2008, A&A, 477, 147
- Corbel et al. (1997) Corbel S., Wallyn P., Dame T. M., Durouchoux P., Mahoney W. A., Vilhu O., Grindlay J.E., 1997, ApJ, 478, 624
- Conti P.S. et al (2008) Conti P.S. Crowther P.A. Leitherer. C., 2008, From Hot Luminous Stars to Starburst Galaxies, Cambridge Astrophysics Series 45, Cambridge: CUP, in press
- Crowther & Smith (1996) Crowther P. A., Smith L. J., 1996, A&A, 305, 541
- Crowther et al. (2006) Crowther P. A., Hadfield L. J., Clark J. S., Negueruela I., Vacca W. D., 2006a, MNRAS, 372, 1407
- Crowther et al. (2006) Crowther P. A., Lennon D. J., Walborn N. R., 2006b, A&A, 446, 279
- Eenens et al. (1991) Eenens P. R. J., Williams P. M., Wade R., 1991, MNRAS, 252, 300
- Eikenberry et al. (2004) Eikenberry S. S. et al. 2004, ApJ, 616, 506
- Figer et al. (1999) Figer D. F., McLean I. S., Morris M., 1999, ApJ, 514, 202
- Figer et al. (2004) Figer D. F., Najarro F., Kudritzki R. P., 2004, ApJ, 610, L109
- Figer et al. (2005) Figer D. F., Najarro F., Geballe T. R., Blum R. D., Kudritzki R. P., 2005, ApJ, 622, L49
- Gaensler et al. (2001) Gaensler B. M., Slane P. O., Gotthelf E. V., Vasisht G., 2001, ApJ, 559, 963
- Hanson et al. (2005) Hanson M. M., Kudritzki R.-P., Kenworthy M. A., Puls J., Tokunaga A. T., 2005, ApJS, 161, 154
- Hurley et al. (2005) Hurley K. et al. 2005, Nat, 434, 1098
- Indebetouw et al. (2005) Indebetouw R. et al. 2005, ApJ, 619, 931
- Kouveliotou et al. (1998) Kouveliotou C. et al. 1998, Nat, 393, 235
- Lejeune & Schaerer (2001) Lejeune T., Schaerer D., 2001, A&A, 366, 538
- Martins & Plez (2006) Martins F., Plez B., 2006, A&A, 457, 637
- McClure-Griffiths & Gaensler (2005) McClure-Griffiths N. M., Gaensler B. M., 2005, ApJ, 630, L161
- Meynet et al. (1994) Meynet G., Maeder A., Schaller G., Schaerer D., Charbonnel C., 1994, A&AS, 103, 97
- Muno et al. (2006) Muno M. P. et al. 2006, ApJ, 636, L41
- Palmer et al. (2005) Palmer D. M. et al. 2005, Nat, 434, 1107
- Reid (1993) Reid M. J., 1993, ARA&A, 31, 345
- Russeil (2003) Russeil D., 2003, A&A, 397, 133
- van Kerkwijk et al. (1995) van Kerkwijk M. H., Kulkarni S. R., Matthews K., Neugebauer G., 1995, ApJ, 444, L33