The Parsec-scale Accretion Disk in NGC 3393
Abstract
We present a Very Long Baseline Interferometry image of the water maser emission in the nuclear region of NGC 3393. The maser emission has a linear distribution oriented at a position angle of , perpendicular to both the kpc-scale radio jet and the axis of the narrow line region. The position-velocity diagram displays a red-blue asymmetry about the systemic velocity and the estimated dynamical center, and is thus consistent with rotation. Assuming Keplerian rotation in an edge-on disk, we obtain an enclosed mass of within pc ( mas), which corresponds to a mean mass density of pc-3. We also report the measurement with the Green Bank Telescope of a velocity drift, a manifestation of centripetal acceleration within the disk, of km s -1 yr-1 in the km s-1 maser feature, which is most likely located along the line of sight to the dynamical center of the system. From the acceleration of this feature, we estimate a disk radius of pc, which is smaller than the inner disk radius ( pc) of emission that occurs along the midline (i.e., the line of nodes). The emission along the line of sight to the dynamical center evidently occurs much closer to the center than the emission from the disk midline, contrary to the situation in the archetypal maser systems NGC 4258 and NGC1068. The outer radius of the disk as traced by the masers along the midline is about 1.5 pc.
1 Introduction
NGC 3393 is a face-on early spiral (Sa) galaxy classified optically as a Seyfert 2 (Véron-Cetty & Véron, 2003). It displays a prominent ring and interacts weakly with a companion kpc away (Schmitt et al., 2001a). There is compelling evidence that the galaxy contains an active galactic nucleus (AGN). Its X-ray spectrum exhibits a keV Fe K line — is an unambiguous indicator of nuclear activity (Maiolino et al., 1998; Guainazzi et al., 2005; Levenson et al., 2006). Levenson et al. (2006) estimate the AGN’s keV intrinsic luminosity to be based on modelling of the Fe line in the Chandra X-ray Observatory data. A Compton-thick, cold reflection model applied to the BeppoSax X-ray data yields an observed keV flux of erg cm-2 s-1 absorbed by a column density of cm-2 (Maiolino et al., 1998). If we assume, following Comastri (2004), that the observed keV flux is of the unabsorbed keV flux due to reflection and scattering, then the intrinsic keV luminosity is , which is consistent with the luminosity determined from the Fe K line. Based on XMM and BeppoSax data, Guainazzi et al. (2005) report an absorbing column density of cm-2, a spectral or photon of index , and an observed flux of erg cm-2 s-1, which corresponds to an intrinsic keV luminosity of (as computed by the Portable Interactive Multi-Mission Simulator111http://heasarc.gsfc.nasa.gov/Tools/w3pimms.html). In the context of the AGN unified model, such a high column density is indicative of an almost edge-on obscuring structure along the line of sight to the nucleus (Lawrence & Elvis, 1982; Antonucci, 1993). Furthermore, images of the inner-kpc region reveal outflows from the nucleus, consistent with the presence of an AGN. The Narrow Line Region (NLR) as traced by [O III] emission has an S-shaped morphology with an opening angle of and extends pc on either side of the nucleus along position angle (P.A.) of (Schmitt & Kinney, 1996; Cooke et al., 2000). Very Large Array (VLA) and Australia Telescope Compact Array (ATCA) observations reveal a double-sided jet with a total extent of pc along P.A. (Schmitt et al., 2001b) or P.A. (Morganti et al., 1999). The existence of an AGN in the nucleus of NGC 3393 is thus well established based on the available data.
NGC 3393 does not show evidence of significant nuclear star formation. The IRAS fluxes measured on an kpc scale (assuming IRAS beam of ; Moshir et al., 1990) are consistent with a total infrared luminosity of , a dust mass of , and two relatively cool dust components at and K (Diaz et al., 1988). Under the assumption that star formation alone is responsible for the infrared flux, the IRAS luminosity yields a star formation rate of yr-1 on kpc scales (Veilleux et al., 1994), which is not consistent with a high level of star-forming activity. Detailed stellar population synthesis work by Cid Fernandes et al. (2004) confirms that the blue optical spectrum of the central pc is dominated by an old stellar population ( yrs) with a small contribution () to the featureless continuum from an AGN. Hence, starburst activity probably does not play a significant role in the nucleus of NGC 3393.
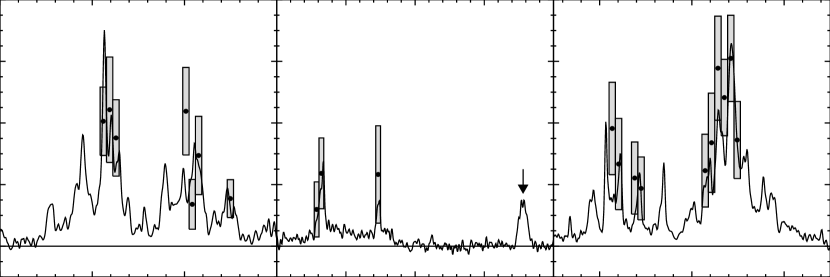
The NGC 3393 nucleus is also a source of water maser emission, which is currently the only resolvable tracer of warm dense molecular gas in the inner parsec of any AGN beyond Mpc. The maser spectrum of NGC 3393 shows a characteristic spectral signature of rotation in an edge-on disk: two complexes ( mJy) symmetrically offset by km s-1 from the systemic velocity (henceforth, high-velocity emission) and a single spectral complex ( mJy) within km s-1 of the systemic velocity (henceforth, low-velocity emission; Kondratko et al., 2006). Very Long Baseline Interferometry (VLBI) maps of seven water maser sources that show similar spectral signatures have been interpreted in a context of a model in which the maser emission traces a nearly edge-on disk of molecular material to pc from a supermassive black hole: NGC 4258 (Miyoshi et al., 1995; Herrnstein et al., 2005; Humphreys et al., 2008), NGC 1386 (Braatz et al., 1997), NGC 4945 (Greenhill et al., 1997), NGC 1068 (Greenhill & Gwinn, 1997), NGC 3079 (Trotter et al., 1998; Yamauchi et al., 2004; Kondratko et al., 2005), IC 2560 (Ishihara et al., 2001), Circinus (Greenhill et al., 2003). The maser spectrum of NGC 3393 thus provides indirect evidence for an edge-on pc-scale molecular disk orbiting a supermassive black hole.
VLBI maps of nuclear water maser emission have been used to accurately estimate black hole masses and pc-scale accretion disk geometries. In three water maser systems mapped with the VLBI — NGC 4258 (Miyoshi et al., 1995), NGC 1068 (Greenhill & Gwinn, 1997), and the Circinus Galaxy (Greenhill et al., 2003) — position and line-of-sight velocity data provided evidence for differential rotation and enabled accurate estimation of black hole mass and pc-scale molecular disk structure. In another system, NGC 3079, the rotation curve traced by the maser emission appears flat and was interpreted in the context of a pc-scale, thick, edge-on, self-gravitating, and possibly star forming molecular disk (Kondratko et al., 2005). In addition to mapping pc-scale molecular disk structure and accurately determining the mass of supermassive black holes, nuclear water maser emission has also been used as a distance indicator. Distance determination is possible for systems where a detailed knowledge of the structure of the disk from VLBI is combined with a measurement of either maser proper motions or drifts in line-of-sight velocity of spectral features (i.e., centripetal acceleration). The distance to NGC 4258 obtained in this manner is the most accurate extragalactic distance thus far, is independent of standard candle calibrators such as Cepheids (Herrnstein et al., 1999), and has contributed to the analysis of the Cepheid period-luminosity relation (Freedman et al. 2001; Newman et al., 2001; Macri et al., 2007).
In this work, we present a VLBI map of the pc-scale accretion disk as traced by water maser emission and estimate the mass of the black hole in NGC 3393. Data calibration and reduction techniques are discussed in Section 2. Spectral-line images of the inner-pc region are presented in Section 3. In Section 4, we interpret the observed kinematics of the maser distribution in terms of a nearly edge-on pc-scale molecular accretion disk that orbits a central mass. In this work, we adopt systemic velocity for NGC 3393 based on cm line measurements of km s-1 (Theureau et al., 1998), which yields a distance of Mpc for a Hubble constant of km s-1 Mpc-1. With this adopted distance, mas corresponds to pc.
2 Observations and Calibration
NGC 3393 was observed in spectral-line mode with the Very Long Baseline Array (VLBA) of the NRAO222The National Radio Astronomy Observatory is operated by Associated Universities, Inc., under cooperative agreement with the National Science Foundation, augmented by the phased VLA and the Green Bank Telescope (GBT), for approximately 5 hours on 2004 April 26/27. The source was observed with MHz intermediate-frequency (IF) bands that covered an uninterrupted velocity range of to km s-1. Limits on the VLBA correlator data rate necessitated two processing passes through the correlator (with channels per IF) and resulted in two separate data sets that do not overlap in velocity: one in left-circular polarization covering the velocity range from to km s-1, the other in right-circular polarization extending from to km s-1. The data were reduced using the Astronomical Image Processing System. The amplitude calibration included corrections for atmospheric opacity. Antenna gain curves and measurements of system temperature were used to calibrate the amplitude data for each of the VLBA stations. Amplitude calibration for the VLA was based on the measurements with the VLA of flux densities for VLBI calibrators with respect to 3C 286, for which we adopted a -GHz flux density of Jy. To minimize systematic errors due to atmospheric opacity effects, we used in this calibration only VLA scans of VLBI calibrators with elevations close to the elevation of 3C 286 (, , , , for 3C 286, 1055-248, 4C 39.25, 0727-115, 0748+126, respectively).
The data in each polarization were corrected for the effect of the parallactic angle of the source on fringe phase. The zenith path delay over each antenna was estimated via observations of strong ( Jy) calibrators with sub-mas positions for hour before and hour after the main imaging experiment. The residual multiband delays after applying this calibration were ns, which corresponds to a phase error of less than for a MHz IF band (see Table 1). Time variation in delays and fringe rates due to the troposphere and clock uncertainties as well as electronic phase difference among bands were removed via min observations of strong ( Jy) calibrators (0727-115, 0748+126, 4C 39.25) made approximately every hour. We estimate that this calibration is accurate to within ns and mHz for delays and rates, respectively; we note that a residual rate of mHz results in a phase error of (if not corrected) over a hour time span, the approximate time separation between the calibrator scans (Table 1). The complex bandpass shapes of each antenna were corrected using the data on 0727-115, 0748+126, and 4C 39.25. Phase and amplitude fluctuations due to the troposphere and clock uncertainties were removed via observations every s of 1055-248, located away from NGC 3393, self-calibrating the data on 1055-248, and applying the resulting phase and amplitude solutions to the target source. As a result of this process, the position of the maser on the sky was determined relative to 1055-248. Based on VLA data obtained at two epochs in B and BnA configuration, we estimate the GHz flux of 1055-248 to be Jy. This measurement as well as the photometric data from the NASA extragalactic database (NED) and from NRAO VLA Sky Survey ( Jy at GHz; Condon et al., 1998) suggests that 1055-248 is a flat spectrum source and is therefore expected to be unresolved on mas scales. In fact, using the source model obtained from self-calibration, we estimate that of 1055-248 flux originates from a point source. The calibrator appears nearly point-like also in a narrow bandwidth (250 kHz km s-1), which confirms the quality of bandpass calibration. Based on the consideration of the tropospheric structure function as predicted by the Kolmogorov turbulence theory (Carilli & Holdaway, 1999), we estimate that the interferometer phase towards 1055-248 reproduces that towards NGC 3393 to within , (assuming a water vapor scale height of km, a representative antenna elevation angle of , and a tropospheric pattern speed of m s-1; Table 1) which corresponds to a loss of signal on the target source of at most . The uncertainty in phase due to calibrator-target angular separation is the most significant source of error in this experiment and depends sensitively on the assumed pattern speed, which is not well constrained for this experiment (Table 1).
After calibrating and imaging the spectral-line data set, the positions and the integrated fluxes of the maser features were obtained by fitting two-dimensional elliptical Gaussians to the distribution of the maser emission on the sky in each spectral channel. The resulting uncertainties in maser spot positions, based on formal error analysis, are consistent with the theoretical expectations based on signal-to-noise ratio (SNR) and beam size. The synthesized beam dimensions were mas at P.A. and the resulting noise level was mJy in the km s-1 spectral channels, a spectral breadth comparable to the linewidths of the maser features. To estimate the fraction of the power imaged by the interferometer and to monitor the maser with the intent of measuring velocity drifts, we acquired single-dish spectra of NGC 3393 with the GBT using the configuration and calibration described in Kondratko et al. (2008). All velocities have been computed in accordance with the optical definition of Doppler shift and are in the heliocentric reference frame.
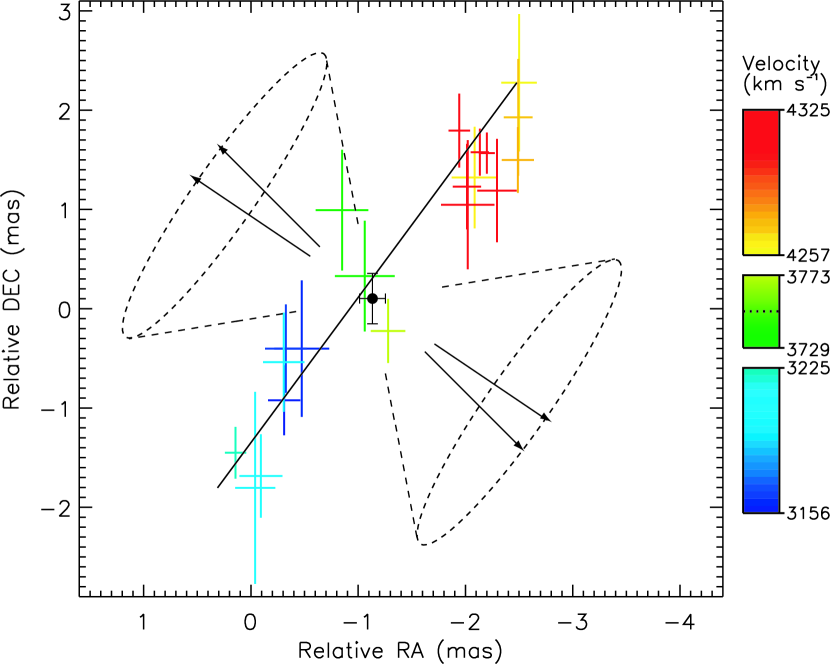
3 Results
The spectrum of imaged power agrees to within with the total power spectrum obtained with the GBT about months after the VLBI observation (Fig. 1 and Table 2). The difference between the two spectra may be due to source variability, since single-dish monitoring of water maser sources has revealed substantial flux variability on timescales of months to years (this work for NGC 3393 and Baan & Haschick (1996) for other sources). The maser emission is distributed on the sky in a linear arrangement at P.A. (Fig. 2 and Table 2), perpendicular to both the kpc-scale radio jet (P.A., Morganti et al. 1999; Schmitt et al. 2001b) and the axis of the NLR (P.A.; Schmitt & Kinney, 1996; Cooke et al., 2000). The maser emission on the sky is clearly systematically distributed according to velocity: emission red- and blue-shifted with respect to the systemic velocity are located in the north-western and south-eastern parts of the image, respectively. Although the two VLBA correlator passes did not overlap in velocity, we can nevertheless place a limit on their registration by aligning the common low velocity maser spots in the two data sets. If we assume that the mapped low-velocity features arise at the same location on the sky, then the two correlator passes are registered to within mas and mas in RA and DEC, respectively. The systematic offset between the results of the two correlator passes was also estimated by applying the calibration of one data set to the other. The transfer of phase and amplitude solutions from self-calibration on 1055-248 from one correlator pass to the other resulted in an offset of 1055-248 from map center of mas and mas in RA and DEC, respectively, which is consistent with the offsets based on the location of the low-velocity maser features. These offsets provide an estimate of the systematic uncertainty in the registration of the two velocity sections of the maps. Note that if we were to apply these offsets, the high velocity masers would better fit a straight line distribution, and the low velocity features would be more tightly clustered (see Figure 2). However, this shift has an insignificant effect on the disk parameters derived in the next section. Radio maps of the inner-kpc are suggestive of a jet perpendicular to the distribution of maser emission on the sky. However, we find no evidence in our data at a mJy level for the GHz continuum on pc scale.
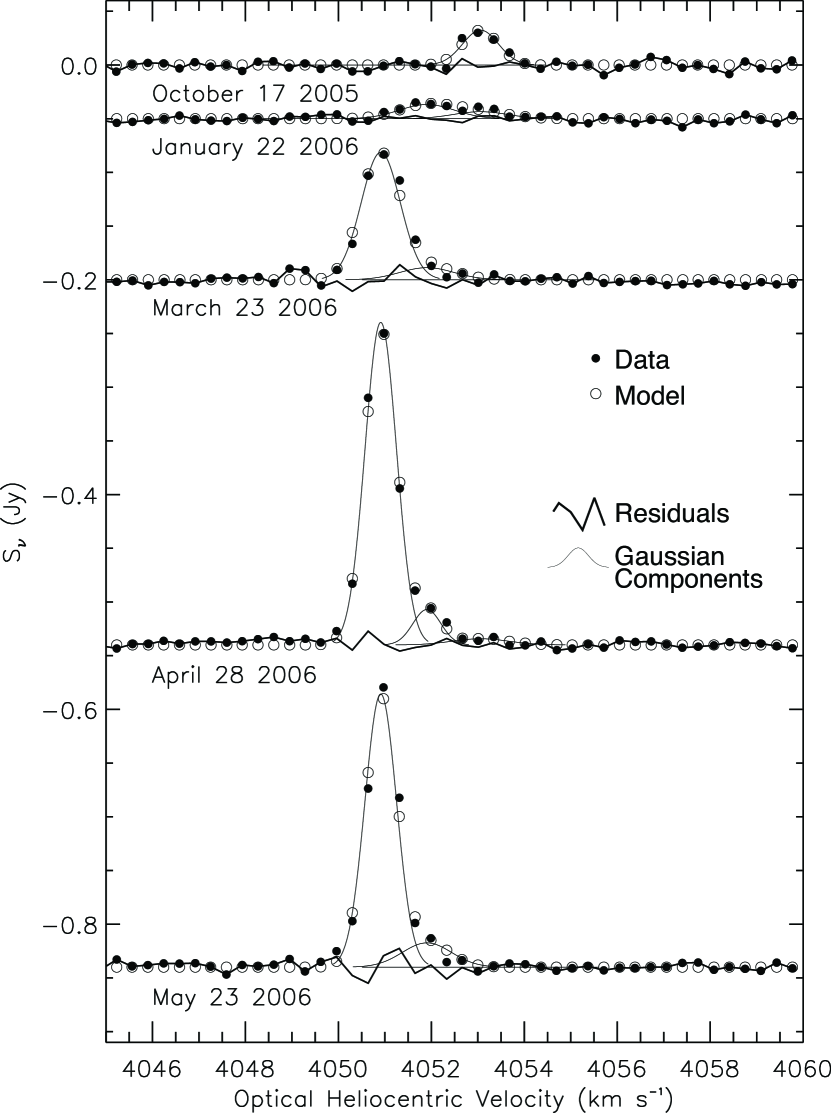
The low-velocity spectral features are expected to drift in velocity since they are presumably moving across the line of sight where the centripetal acceleration vector is along the line of sight, and therefore at a maximum. To determine these velocity drifts, we monitored NGC 3393 with the GBT and report the measurement of the centripetal acceleration in the low-velocity complex at km s-1 (Fig. 3 and Table 3). Using the code described in Humphreys et al. (2008), we decomposed the spectra for the six epochs into three Gaussian components and used an iterative least squares technique to solve simultaneously for velocity drifts, amplitudes, peak centroids, and widths of all Gaussian components at all epochs. We obtain a reduced of and velocity drifts of , , and km s-1 yr-1 for components at , , and km s -1, respectively, where the reference epoch for component velocities is 2005 January 15. In addition, spectra obtained since 2004 October 17 reveal a strong ( Jy) feature at km s-1 that was present neither in earlier spectra of the source nor in the VLBI map (Fig. 3 and Table 3). The first three epochs on this feature showed a negative centripetal acceleration of about km s-1 yr-1, as would be expected for low-velocity emission that arises from behind the dynamical center; however, the line stopped drifting in the more recent spectra. We note that such behavior can be reproduced by a variation in strength of multiple components that do not drift in velocity (i.e., stationary components). In fact, from a Gaussian decomposition of the five available epochs, we infer that the data on this complex are consistent (reduced of ) with three time variable but stationary ( km s-1 yr-1) Gaussian components at , , and km s-1. High-velocity emission is not expected to drift in velocity since it is located along the disk midline where the centripetal acceleration vector is perpendicular to the line of sight. We thus suggest that the newly detected complex at km s-1 may be a high-velocity emission component. We note that low-velocity emission that arises from behind the dynamical center has not been detected to date from any known nuclear water maser sources. This non-detection can be explained if free-free absorption by an intervening ionized gas is considerable (e.g., Herrnstein et al., 1996) or the presence of a background nuclear continuum source is necessary to generate, via amplification, low-velocity emission luminous enough for us to detect (e.g., Herrnstein et al., 1997).
4 Discussion
We interpret the linear distribution of the maser emission, perpendicular to the radio jet and to the axis of the NLR, as well as the segregation of the blue- and the red-shifted emission on the sky in the context of a pc-scale molecular disk. We assume that the disk is nearly edge-on and, based on the measured positive centripetal acceleration, we infer that the low-velocity emission lies in front of and along the line of sight to the dynamical center. The distribution of maser emission on the sky is consistent with a relatively straight (i.e., nonwarped) disk. We note that a 4th degree polynomial fit to the maser distribution yields a marginal (i.e., %) improvement in over a straight line fit. Thus, the evidence for a warp is at most tentative with our SNR.
We use the mean position of the low-velocity maser features to estimate the location of the dynamical center (Fig. 2), RABH and DECBH. The absolute position of the dynamical center is
The errors are dominated by the uncertainty in the position of 1055-248 of about 1 mas (Beasley et al., 2002).
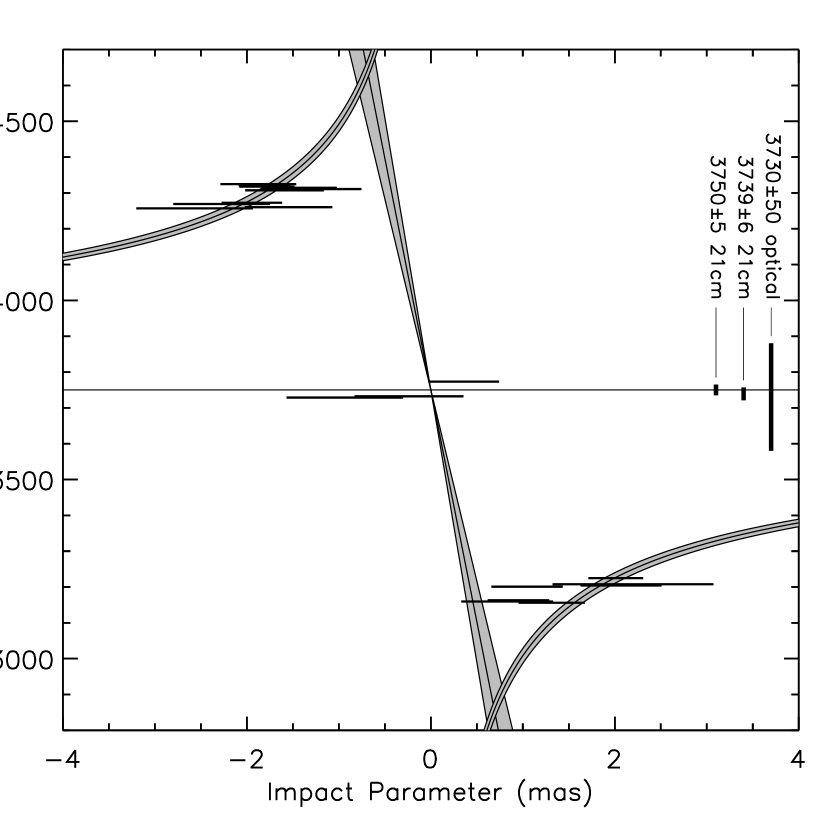
The impact parameter of each maser feature was calculated as
. The resulting position-velocity diagram displays a red-blue antisymmetry about the adopted and estimated dynamical center and is thus consistent with
rotation (Fig. 4). From a fit of the Keplerian rotation to the
high-velocity features (), we obtain a mass of enclosed within pc ( mas; to
estimate the minimum impact parameter from high-velocity data, we used the
probability distribution function for a minimum of random variables following the Rice distribution). The fit to the blue- or the red-shifted emission alone yields or ,
respectively. If one correlator pass is shifted mas so that its single
low-velocity maser feature overlaps the two low-velocity features in the other
data set, then the mass becomes enclosed
within pc ( mas), which reflects the sensitivity of
our results to systematic errors. We note that, in addition to the Keplerian
rotation, the data are also consistent (in the sense that )
with for . In particular, we obtain a
minimum of at , which suggests that the disk might have significant mass with respect to that of the black hole. The central mass would be enclosed within pc (if we assume spherical symmetry). The mass of the disk traced by the high-velocity maser emission ( pc) is , which can be compared to disk masses (computed on similar scales) of and for NGC 3079 (Kondratko et al., 2005) and NGC 1068 (Lodato & Bertin, 2003), respectively. A
flat rotation curve model, which gives enclosed
within pc, is excluded by the data (), unless
velocity dispersion on the order of km s-1 is included. Such a large
velocity dispersion would most likely be indicative of macroscopic random motions among the molecular clumps responsible for the maser emission rather than turbulence within the clumps.
The mean mass density corresponding to enclosed within pc is pc-3. The relatively high mean mass density for NGC 3393 is suggestive of a massive central black hole, which is consistent with the X-ray observations of the nucleus. The estimated enclosed mass of is in agreement with the empirical relation between bulge velocity dispersion and black hole mass (Gebhardt et al. 2000a, 2000b; Ferrarese & Merritt, 2000; Ferrarese et al., 2001). If we adopt (Gebhardt et al. 2000a, 2000b), then the velocity dispersion of the bulge, km s-1 from the central kpc (Terlevich et al., 1990) or km s-1 from the central pc (Cid Fernandes et al., 2004), predicts black hole masses of or , respectively, roughly a factor of two higher than our measurement.
The most reliable estimate of the AGN’s keV intrinsic luminosity is determined from Fe K line luminosity (Levenson et al., 2006). Based on an average quasar spectral energy distribution (Fabian & Iwasawa, 1999; Elvis et al., 2002), the keV luminosity is of the AGN bolometric luminosity and we obtain a bolometric luminosity for NGC 3393 of . We note that this estimate for the AGN bolometric luminosity is consistent with the total IRAS luminosity of the source of (measured on kpc scale; Moshir et al., 1990). The Eddington luminosity of a object is . Assuming that all of the enclosed mass is concentrated in a supermassive black hole, the bolometric luminosity of the central engine yields an Eddington ratio of , which is consistent with the range obtained for Seyfert 1 galaxies, representative supermassive black hole systems (e.g., Padovani, 1989; Wandel et al., 1999), but larger than for advection dominated accretion flow systems (e.g., ; Herrnstein et al., 1998; Yuan et al., 2002). Assuming a standard accretion efficiency of (Frank, King, & Raine 2002; see also Marconi et al. 2004), we estimate a mass accretion rate of year-1.
For a central mass of and the measured centripetal acceleration of km s-1 yr-1, we estimate disk radius of the systemic maser feature at km s-1 of pc, which is significantly smaller than the inner disk radius of the high-velocity emission ( pc). Evidently, the systemic emission in NGC 3393 arises much closer to the dynamical center than the high-velocity emission, which is in contrast to the situation in NGC 4258 (Herrnstein et al., 2005) and NGC 1068 (Greenhill et al., 1997), where disk radii of low-velocity features is about equal to the inner radius of the high velocity masers. It has been suggested that the systemic emission in NGC 4258 resides in a bowl that is a consequence of an inclination-warped disk (Herrnstein et al., 2005). Such a warp in the accretion disk structure might also determine the preferred radial location of the low-velocity features in NGC 3393. The resulting orbital velocity of the km s-1 maser feature is km s-1 (which might be as high as km s-1 due to systematic errors). We note that the km s-1 offset of this feature from the adopted systemic velocity might be due its location within the disk at a non-zero azimuthal angle from the line of sight to the central engine. Using this velocity offset, we estimate and the resulting corrections to the derived radius and orbital velocity are much smaller than the corresponding uncertainties. The newly detected feature at km s-1 that we postulate to be high-velocity emission was not detected in the VLBI experiment but would appear at a large disk radius which from the computed enclosed mass and Keplerian formula, , is mas or pc (see Figure 4). Hence, we estimate that the accretion disk extends from pc to pc.
5 Conclusion
We have mapped for the first time the maser emission in the nuclear region of NGC 3393. We interpret the linear distribution of the maser emission and the segregation of the blue- and the red-shifted emission on the sky in the context of a pc-scale nearly edge-on molecular disk that orbits a central mass of enclosed within pc ( mas). We also report the measurement of centripetal acceleration, km s-1 yr-1, in the low-velocity maser feature at km s-1, which yields disk radius of pc for the derived central mass. The low-velocity emission in NGC 3393 occurs much closer to the dynamical center than the high-velocity emission, in contrast to the situation in NGC 4258 and NGC 1068, two archetypal maser systems. An independent estimate for the disk radius of the low-velocity features would be provided by the measurement of their proper motions. For a distance , a central mass , and a radius pc, we expect motions of as yr-1, which would be challenging to measure because of the typical lifetimes of the maser s features and their weakness. Alternatively, a measurement of the position-velocity gradient in the low-velocity maser features would provide an independent estimate for their radial location within the disk ( pc, where is the distance and is the velocity gradient). The limited SNR in our VLBI data precluded measurement of the gradient (as evident from Figure 4). It is unclear what improvement in SNR would be necessary to yield a useful measurement, as there is a dearth of low-velocity features even in the sensitive single-dish spectra of the source. Nonetheless, the maser is time variable, and new spectral features may emerge with time. An independent estimate for the disk radius of the low-velocity features either from proper motions or position-velocity gradient could be used to determine a distance to NGC 3393, a result of considerable value since the galaxy is within the Hubble flow ( km s-1) and thus might be used to establish a Hubble relation independent of standard candle calibrators such as Cepheids (e.g., Greenhill, 2004). Over and above eventual modeling errors for VLBI data, the peculiar motion of NGC3393 (or the barycenter of the parent Hydra cluster) would probably limit the accuracy of inference for the Hubble constant from NGC3393 alone to . Within this, uncertainty over the flow field in the vicinity of the Great Attractor would probably dominate (Masters et al., 2006).
References
- Antonucci (1993) Antonucci, R. 1993, ARA&A, 31, 473
- Baan & Haschick (1996) Baan, W. A., & Haschick, A. 1996, ApJ, 473, 269
- Beasley et al. (2002) Beasley, A. J., Gordon, D., Peck, A. B., Petrov, L., MacMillan, D. S., Fomalont, E. B., & Ma, C. 2002, ApJS, 141, 13
- Braatz et al. (1997) Braatz, J., Greenhill, L., Moran, J., Wilson, A., & Herrnstein, J. 1997, BAAS, 29, 1374
- Carilli & Holdaway (1999) Carilli, C. L., & Holdaway, M. A. 1999, Radio Science, 34, 817
- Cid Fernandes et al. (2004) Cid Fernandes, R., Gu, Q., Melnick, J., Terlevich, E., Terlevich, R., Kunth, D., Rodrigues Lacerda, R., & Joguet, B. 2004, MNRAS, 355, 273
- Comastri (2004) Comastri, A. 2004, Compton-Thick AGN: The Dark Side of the X-Ray Background (ASSL Vol. 308: Supermassive Black Holes in the Distant Universe), 245
- Condon et al. (1998) Condon, J. J., Cotton, W. D., Greisen, E. W., Yin, Q. F., Perley, R. A., Taylor, G. B., & Broderick, J. J. 1998, AJ, 115, 1693
- Cooke et al. (2000) Cooke, A. J., Baldwin, J. A., Ferland, G. J., Netzer, H., & Wilson, A. S. 2000, ApJS, 129, 517
- Diaz et al. (1988) Diaz, A. I., Prieto, M. A., & Wamsteker, W. 1988, A&A, 195, 53
- Elvis et al. (2002) Elvis, M., Risaliti, G., & Zamorani, G. 2002, ApJ, 565, L75
- Fabian & Iwasawa (1999) Fabian, A. C., & Iwasawa, K. 1999, MNRAS, 303, L34
- Ferrarese & Merritt (2000) Ferrarese, L., & Merritt, D. 2000, ApJ, 539, L9
- Ferrarese et al. (2001) Ferrarese, L., Pogge, R. W., Peterson, B. M., Merritt, D., Wandel, A., & Joseph, C. L. 2001, ApJ, 555, L79
- Frank et al. (2002) Frank, J., King, A., & Raine, D. J. 2002, Accretion Power in Astrophysics: Third Edition (Accretion Power in Astrophysics: Third Edition, by Juhan Frank, Andrew King, and Derek J. Raine, pp. 398. Cambridge, UK: Cambridge University Press.)
- Freedman et al. (2001) Freedman, W. L., et al. 2001, ApJ, 553, 47
- Gebhardt, K., et al. (2000a) Gebhardt, K., et al. 2000a, ApJ, 539, L13
- Gebhardt, K., et al. (2000b) —. 2000b, ApJ, 543, L5
- Greenhill & Gwinn (1997) Greenhill, L. J., & Gwinn, C. R. 1997, Ap&SS, 248, 261
- Greenhill et al. (1997) Greenhill, L. J., Moran, J. M., & Herrnstein, J. R. 1997, ApJ, 481, L23
- Greenhill et al. (2003) Greenhill, L. J., Booth, R. S., Ellingsen, S. P., et al. 2003, ApJ, 590, 262
- Greenhill (2004) Greenhill, L. J. 2004, New Astronomy Review, 48, 1079
- Guainazzi et al. (2005) Guainazzi, M., Fabian, A. C., Iwasawa, K., Matt, G., & Fiore, F. 2005, MNRAS, 356, 295
- Herrnstein et al. (1996) Herrnstein, J. R., Greenhill, L. J., & Moran, J. M. 1996, ApJ, 468, L17
- Herrnstein (1997) Herrnstein, J. R. 1997, Ph.D. Thesis, Harvard University
- Herrnstein et al. (1997) Herrnstein, J. R., Moran, J. M., Greenhill, L. J., Diamond, P. J., Miyoshi, M., Nakai, N., & Inoue, M. 1997, ApJ, 475, L17
- Herrnstein et al. (1998) Herrnstein, J. R., Greenhill, L. J., Moran, J. M., Diamond, P. J., Inoue, M., Nakai, N., & Miyoshi, M. 1998, ApJ, 497, L69
- Herrnstein et al. (1999) Herrnstein, J. R., Moran, J. M., Greenhill, L. J., et al. 1999, Nature, 400, 539
- Herrnstein et al. (2005) Herrnstein, J. R., Moran, J. M., Greenhill, L. J., & Trotter, A. S. 2005, ApJ, 629, 719
- Humphreys et al. (2008) Humphreys, E. M. L., Reid, M. J. Greenhill, L. J., Moran, J. M., & Argon, A. 2008, ApJ, 672, 800
- Ishihara et al. (2001) Ishihara, Y., Nakai, N., Iyomoto, N., Makishima, K., Diamond, P., & Hall, P. 2001, PASJ, 53, 215
- Kondratko et al. (2005) Kondratko, P. T., Greenhill, L. J., & Moran, J. M. 2005, ApJ, 618, 618
- Kondratko et al. (2006) Kondratko, P. T., Greenhill, L. J., Moran, J. M., et al. 2006, ApJ, 638, 100
- Kondratko et al. (2008) Kondratko, P. T., Greenhill, L. J., Moran, J. M., & Reid, M. J. 2008, in preparation
- Lawrence & Elvis (1982) Lawrence, A., & Elvis, M. 1982, ApJ, 256, 410
- Levenson et al. (2006) Levenson, N. A., Heckman, T. M., Krolik, J. H., Weaver, K. A., & Życki, P. T. 2006, ApJ, 648, 111
- Lodato & Bertin (2003) Lodato, G., & Bertin, G. 2003, A&A, 398, 517
- Ma et al. (1998) Ma, C., Arias, E. F., Eubanks, T. M., et al. 1998, ApJ, 116, 516
- Macri et al. (2007) Macri, L. M., Stanek, K. Z., Bersier, D., Greenhill, L. J., & Reid, M. 2007, ApJ, 652, 1133
- Maiolino et al. (1998) Maiolino, R., Salvati, M., Bassani, L., Dadina, M., della Ceca, R., Matt, G., Risaliti, G., & Zamorani, G. 1998, A&A, 338, 781
- Marconi et al. (2004) Marconi, A., Risaliti, G., Gilli, R., Hunt, L. K., Maiolino, R., & Salvati, M. 2004, MNRAS, 351, 169
- Masters et al. (2006) Masters, K. L., Springob, C. M., Haynes, M. P., & Giovanelli, R. 2006, ApJ, 653, 861
- Miyoshi et al. (1995) Miyoshi, M., Moran, J., Herrnstein, J., Greenhill, L., Nakai, N., Diamond, P., & Inoue, M. 1995, Nature, 373, 127
- Morganti et al. (1999) Morganti, R., Tsvetanov, Z. I., Gallimore, J., & Allen, M. G. 1999, A&AS, 137, 457
- Moshir et al. (1990) Moshir, M., et al. 1990, in IRAS Faint Source Catalogue, version 2.0 (1990)
- Newman et al. (2001) Newman, J. A., Ferrarese, L., Stetson, P. B., Maoz, E., Zepf, S. E., Davis, M., Freedman, W. L., & Madore, B. F. 2001, ApJ, 553, 562
- Padovani (1989) Padovani, P. 1989, A&A, 209, 27
- Schmitt & Kinney (1996) Schmitt, H. R., & Kinney, A. L. 1996, ApJ, 463, 498
- Schmitt et al. (2001a) Schmitt, H. R., Antonucci, R. R. J., Ulvestad, J. S., Kinney, A. L., Clarke, C. J., & Pringle, J. E. 2001a, ApJ, 555, 663
- Schmitt et al. (2001b) Schmitt, H. R., Ulvestad, J. S., Antonucci, R. R. J., & Kinney, A. L. 2001b, ApJS, 132, 199
- Terlevich et al. (1990) Terlevich, E., Diaz, A. I., & Terlevich, R. 1990, MNRAS, 242, 271
- Theureau et al. (1998) Theureau, G., Bottinelli, L., Coudreau-Durand, N., Gouguenheim, L., Hallet, N., Loulergue, M., Paturel, G., & Teerikorpi, P. 1998, A&AS, 130, 333
- Trotter et al. (1998) Trotter, A. S., Greenhill, L. J., Moran, J. M., Reid, M. J., Irwin, J. A., & Lo, K. 1998, ApJ, 495, 740
- Véron-Cetty & Véron (2003) Véron-Cetty, M.-P., & Véron, P. 2003, A&A, 412, 399
- Veilleux et al. (1994) Veilleux, S., Cecil, G., Bland-Hawthorn, J., Tully, R. B., Filippenko, A. V., & Sargent, W. L. W. 1994, ApJ, 433, 48
- Wandel et al. (1999) Wandel, A., Peterson, B. M., & Malkan, M. A. 1999, ApJ, 526, 579
- Yamauchi et al. (2004) Yamauchi, A., Nakai, N., Sato, N., & Diamond, P. 2004, PASJ, 56, 605
- Yuan et al. (2002) Yuan, F., Markoff, S., Falcke, H., & Biermann, P. L. 2002, A&A, 391, 139
| Name | Equation(a)(a)Adopted from Herrnstein (1997) except for the last entry which is based on Carilli & Holdaway (1999). MHz is the video bandwidth (i.e., the bandwidth across which various calibrations are applied and over which the resulting errors are propagated), Jy is a representative system equivalent flux density of VLBA antennas, Jy is the flux density of delay/rate calibrators (i.e., 0727-115, 0748+126, 4C 39.25), min is the delay/rate calibrator scan duration, mas is the uncertainty in the delay/rate calibrator position (Ma et al., 1998), km is an approximate baseline length, nsec is the residual multiband delay after correcting for the zenith path delay over each antenna, mHz is the residual rate after correcting for time variation in delays and fringe rates due to the troposphere and clock uncertainties, hrs is an approximate time separation between the delay/rate calibrator scans, GHz is the observing frequency, cm is a representative uncertainty in baseline length, is the speed of light, mas is the uncertainty in the phase calibrator (1055-248) position (Beasley et al., 2002), is an effective baseline length in km, is a constant that depends on weather conditions (values assumed here are for the VLA site), m s-1 is the tropospheric pattern speed, km is the water vapor scale height, is a representative antenna elevation, is the angular separation between the phase calibrator and the target source, s is the time between successive phase calibrator observations, and is the observing wavelength in mm. | (b)(b)Phase error. On a 5000 km baseline, a phase error of 1 rad corresponds to a position error of mas. |
|---|---|---|
| (degrees) | ||
| Uncertainty in group delay estimate | ||
| Residual delay error due to calibrator position error | ||
| Residuals in atmospheric delay | ||
| Uncertainty in fringe rate estimate | ||
| Residual fringe rate from imperfect astrometry | ||
| Errors in baseline length | ||
| Errors due to imperfect calibrator astrometry | ||
| Phase calibrator-target angular separation | ||
| where for |
| Velocity(a)(a)Range of mapped optical heliocentric velocities. | RA(b)(b)Right ascension and declination relative to and , which lies mas from the estimated dynamical center (Section 4). The a priori position for the maser was and with uncertainty of from Kondratko et al. (2006). | DEC(b)(b)Right ascension and declination relative to and , which lies mas from the estimated dynamical center (Section 4). The a priori position for the maser was and with uncertainty of from Kondratko et al. (2006). | Flux(c)(c)Integrated flux from a fit of a two-dimensional elliptical Gaussian model to the distribution of the maser emission on the sky in each spectral channel. |
|---|---|---|---|
| (km s-1) | (mas) | (mas) | (Jy) |
| — | |||
| — | |||
| — | |||
| — | |||
| — | |||
| — | |||
| — | |||
| — | |||
| — | |||
| — | |||
| — | |||
| — | |||
| — | |||
| — | |||
| — | |||
| — | |||
| — | |||
| — | |||
| — | |||
| — |
| (a)(a)Reduced chi-squared for a least squares solution that determines velocity drifts, amplitudes, peak centroids, and widths of all Gaussian components at all epochs simultaneously. | Velocity(b)(b)Velocity of a Gaussian component at the reference epoch (2005 January 15 and 2005 October 17 for km s-1 and km s-1 features, respectively). | Drift(c)(c)Velocity drift of a Gaussian component. | Amplitude(d)(d)Amplitudes of a Gaussian component at the listed epochs. | FWHM(e)(e)Full widths at half maximum of Gaussian components at the listed epochs. | Date |
|---|---|---|---|---|---|
| (km s-1) | (km s-1 yr-1) | (mJy) | (km s-1) | ||
| 1.2 | … | … | 2005 Jan 15 | ||
| 2005 Oct 17 | |||||
| 2006 Jan 22 | |||||
| 2006 Mar 23 | |||||
| 2006 Apr 28 | |||||
| 2006 May 23 | |||||
| 2005 Jan 15 | |||||
| 2005 Oct 17 | |||||
| 2006 Jan 22 | |||||
| 2006 Mar 23 | |||||
| 2006 Apr 28 | |||||
| 2006 May 23 | |||||
| 2005 Jan 15 | |||||
| 2005 Oct 17 | |||||
| 2006 Jan 22 | |||||
| 2006 Mar 23 | |||||
| 2006 Apr 28 | |||||
| … | … | 2006 May 23 | |||
| 2.0 | … | … | 2005 Oct 17 | ||
| … | … | 2006 Jan 22 | |||
| 2006 Mar 23 | |||||
| 2006 Apr 28 | |||||
| 2006 May 23 | |||||
| … | … | 2005 Oct 17 | |||
| 2006 Jan 22 | |||||
| 2006 Mar 23 | |||||
| 2006 Apr 28 | |||||
| 2006 May 23 | |||||
| 2005 Oct 17 | |||||
| 2006 Jan 22 | |||||
| … | … | 2006 Mar 23 | |||
| 2006 Apr 28 | |||||
| … | … | 2006 May 23 |