Comment to “Recent Climate Observations Compared to Projections” by Rahmstorf et al.
With great interest I read this article of Rahmstorf et
al. [1]. It is surprising to me that the authors only
consider a period from the beginning of the seventies to recent
years. I think that this is, clearly, a source of
misinterpretation.
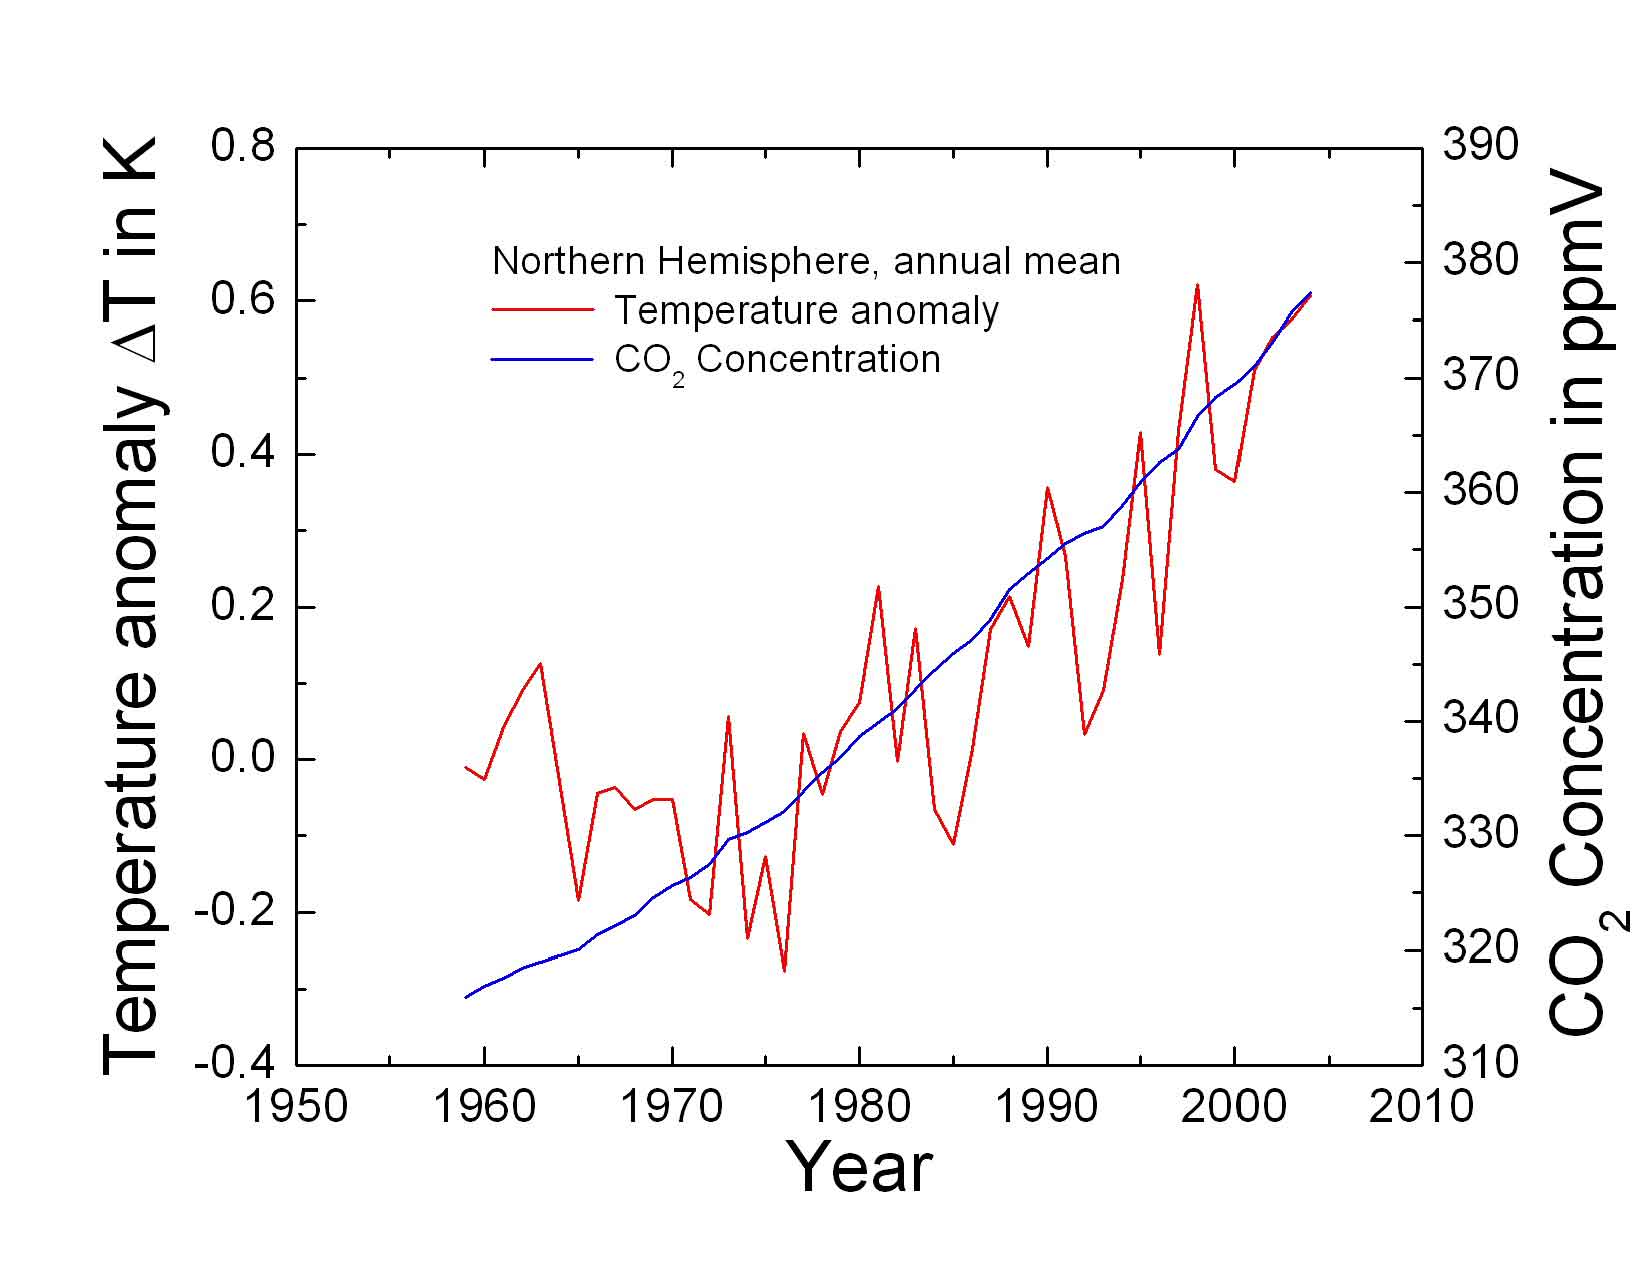
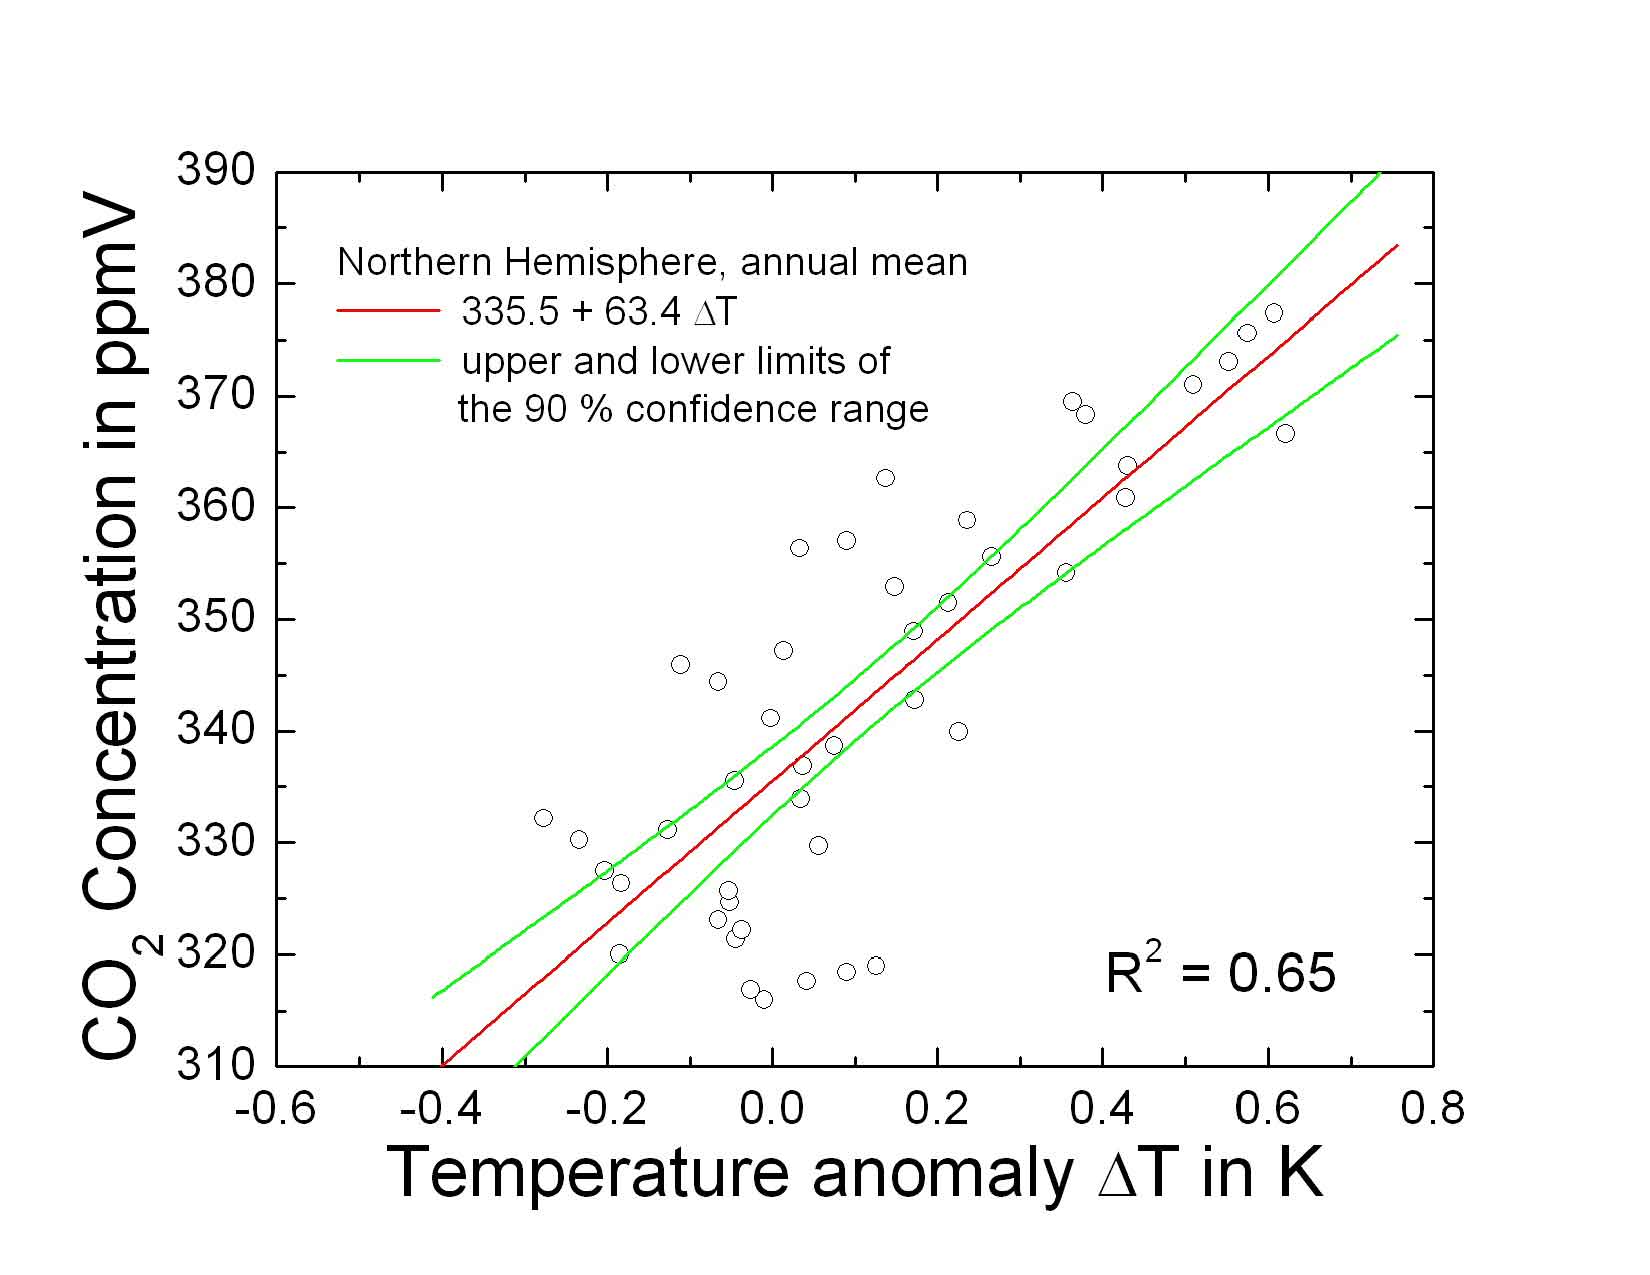
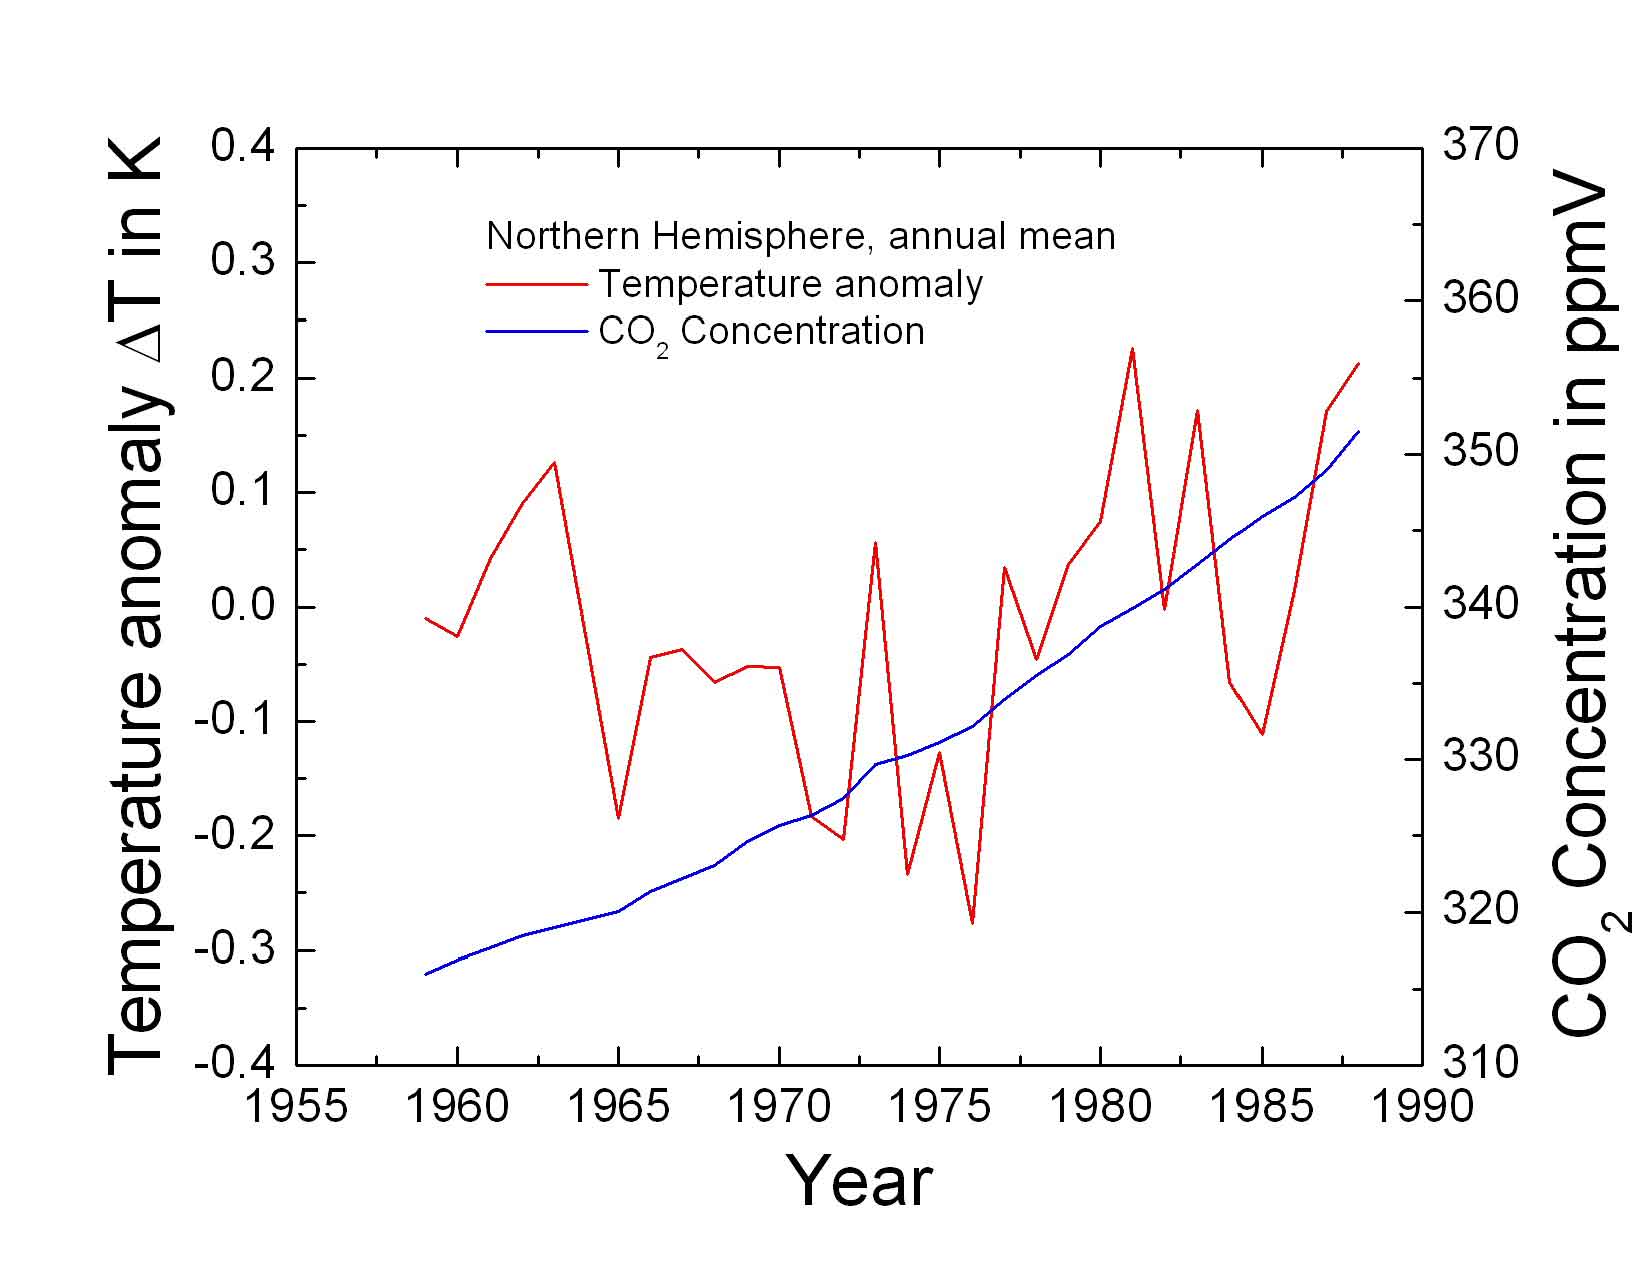
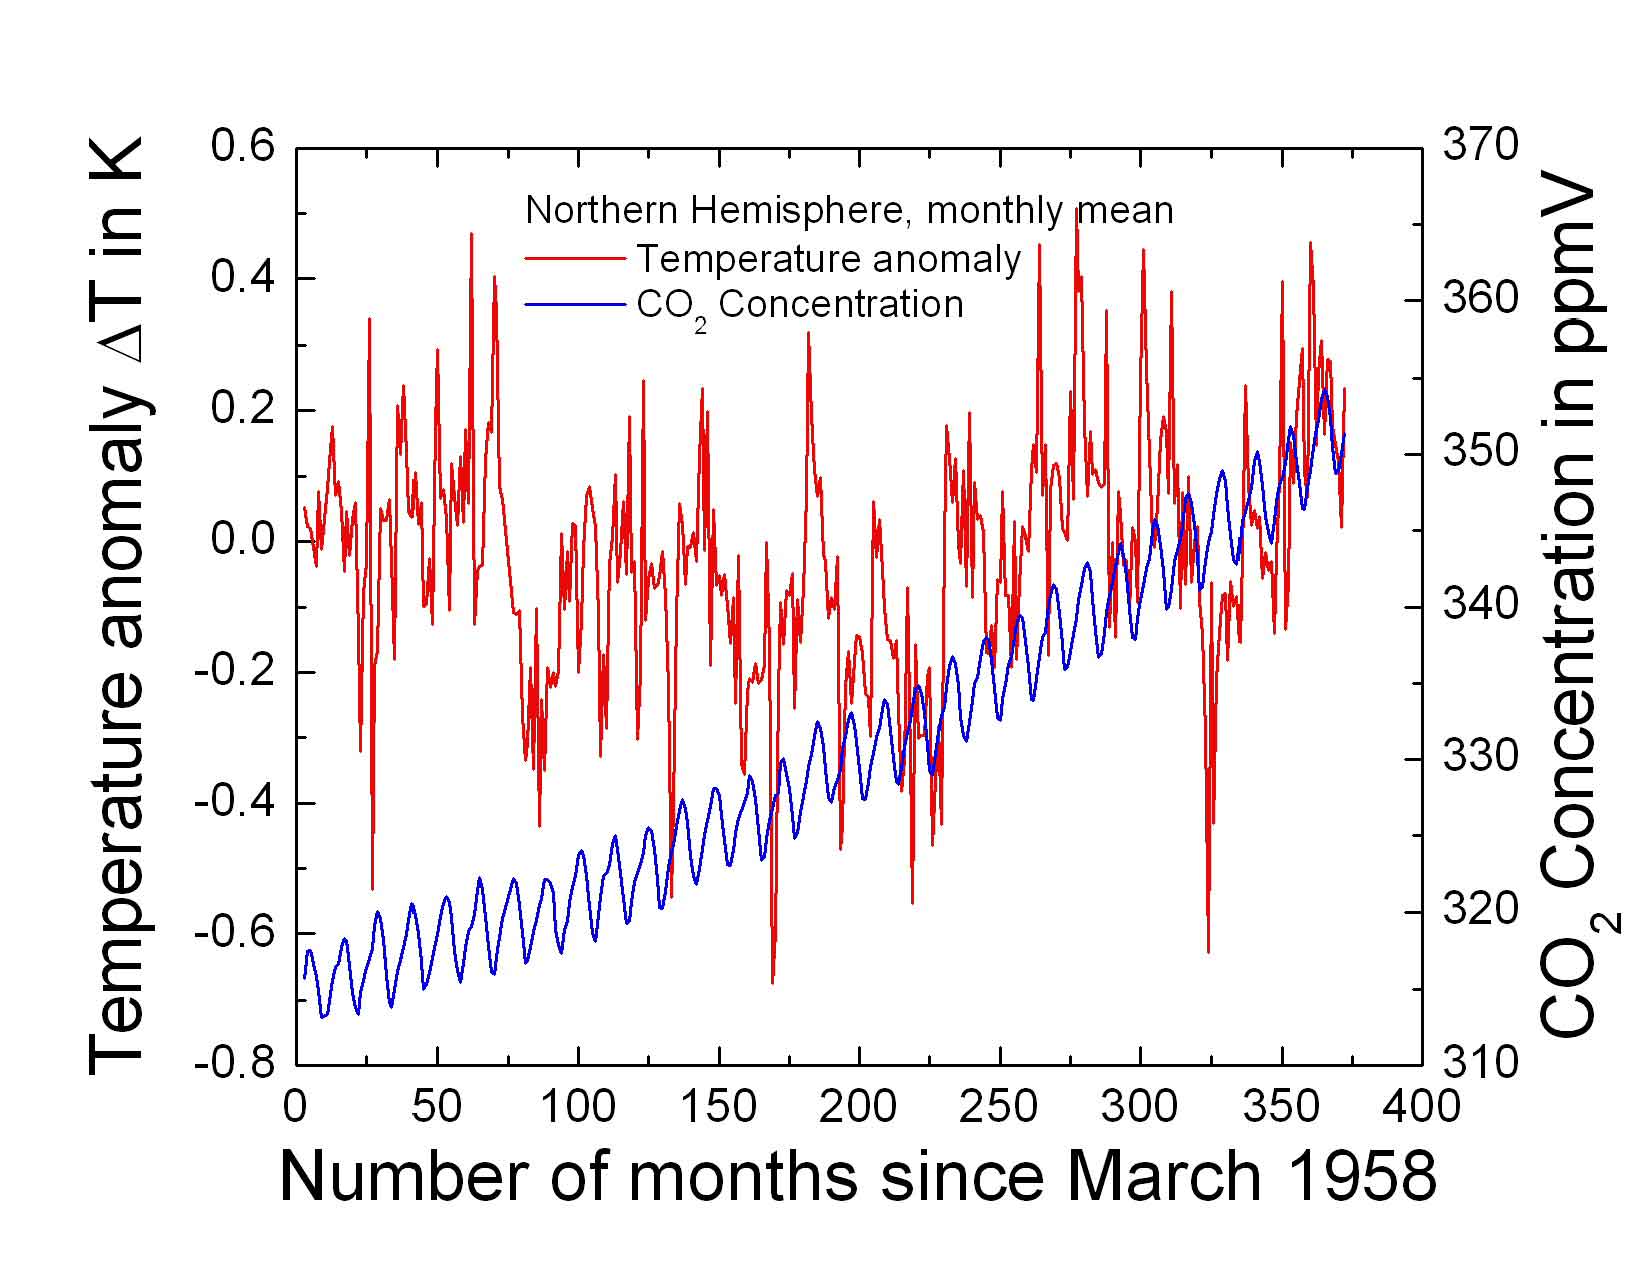
The Mauna Loa observation of the
atmospheric carbon dioxide () concentration (probably the best
data we have) started in 1958. Therefore, one should consider
the whole period of these observations. As illustrated in Figures
1 and 2, the correlations for the period
1958 to 2004 show a somewhat different picture as presented by
Rahmstorf et al. [1] in their Figure 1. The results of my
figures are based on the Mauna Loa data (monthly and annual
averages) and the mean near surface temperature anomalies of the
Hadley Centre for Climate Prediction and Research, MetOffice, UK,
for the northern hemisphere (also monthly and annual averages),
too.
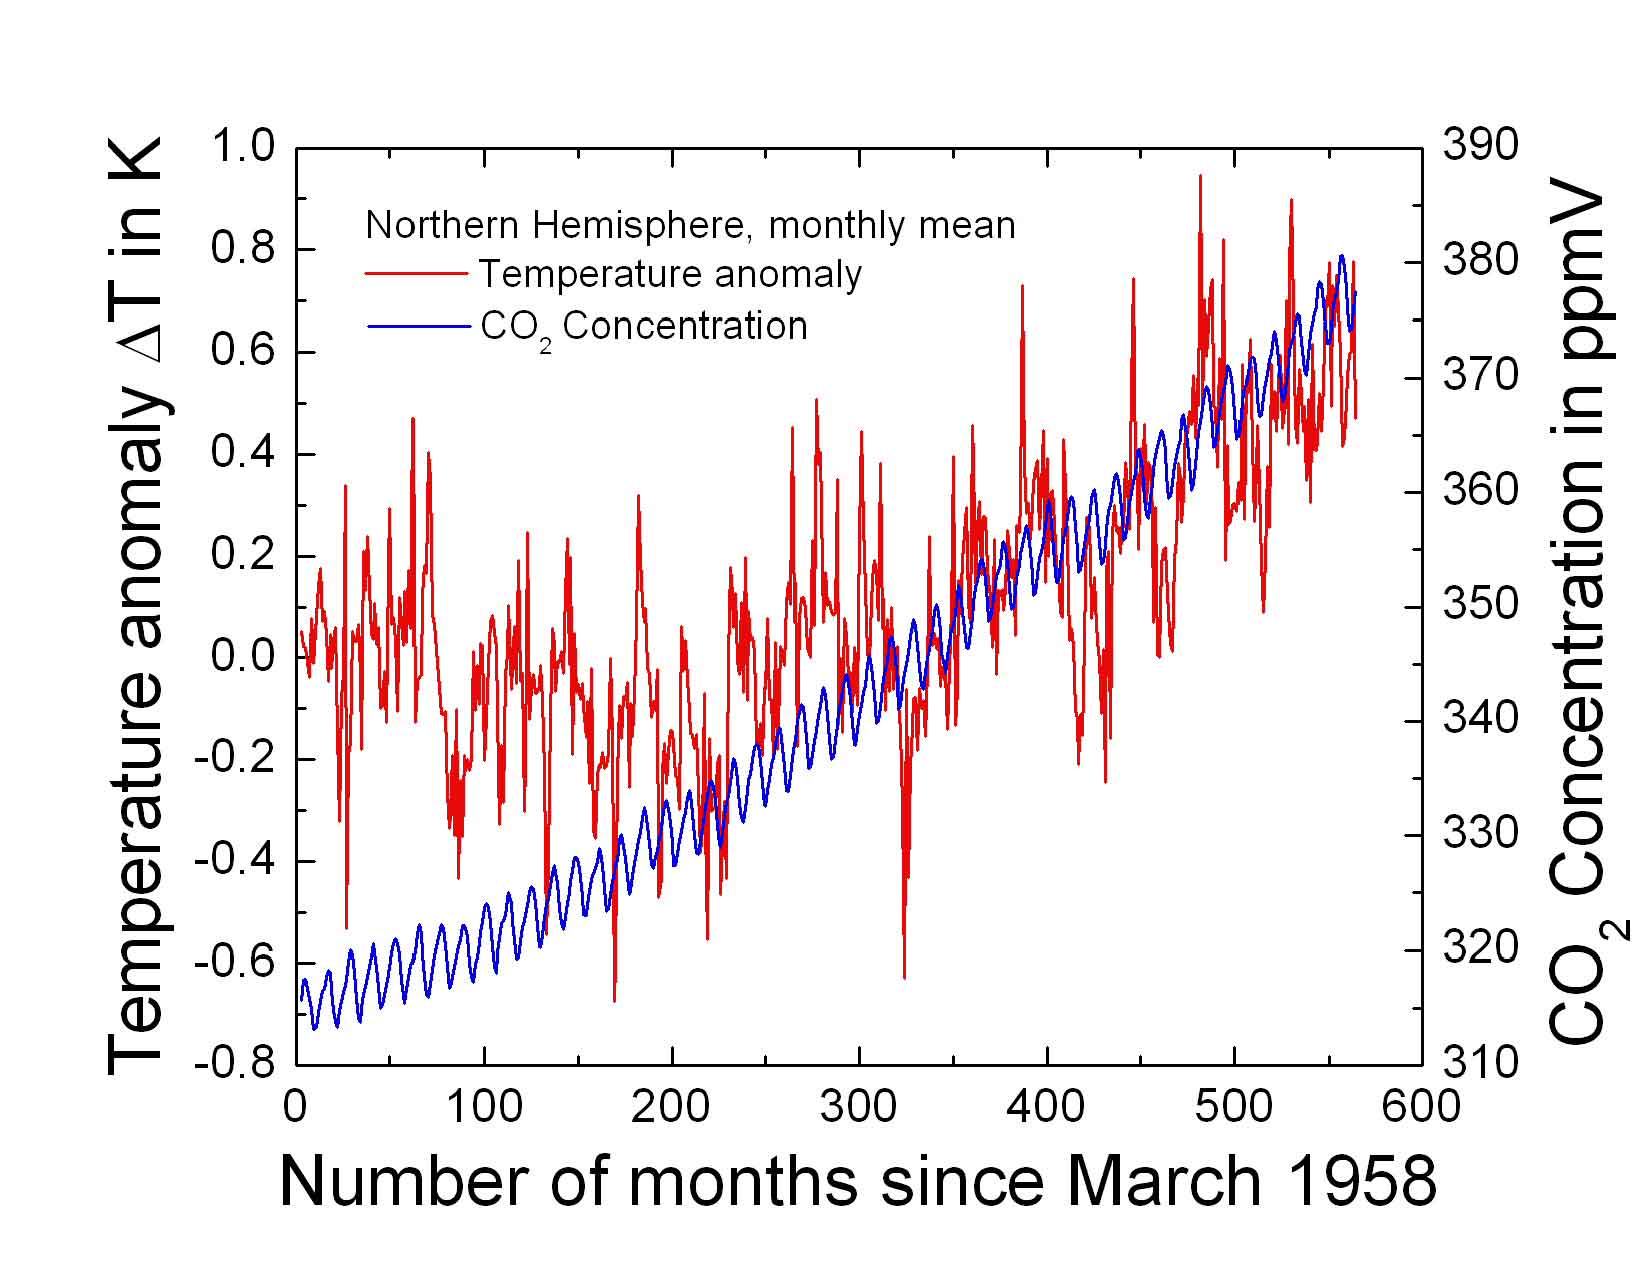
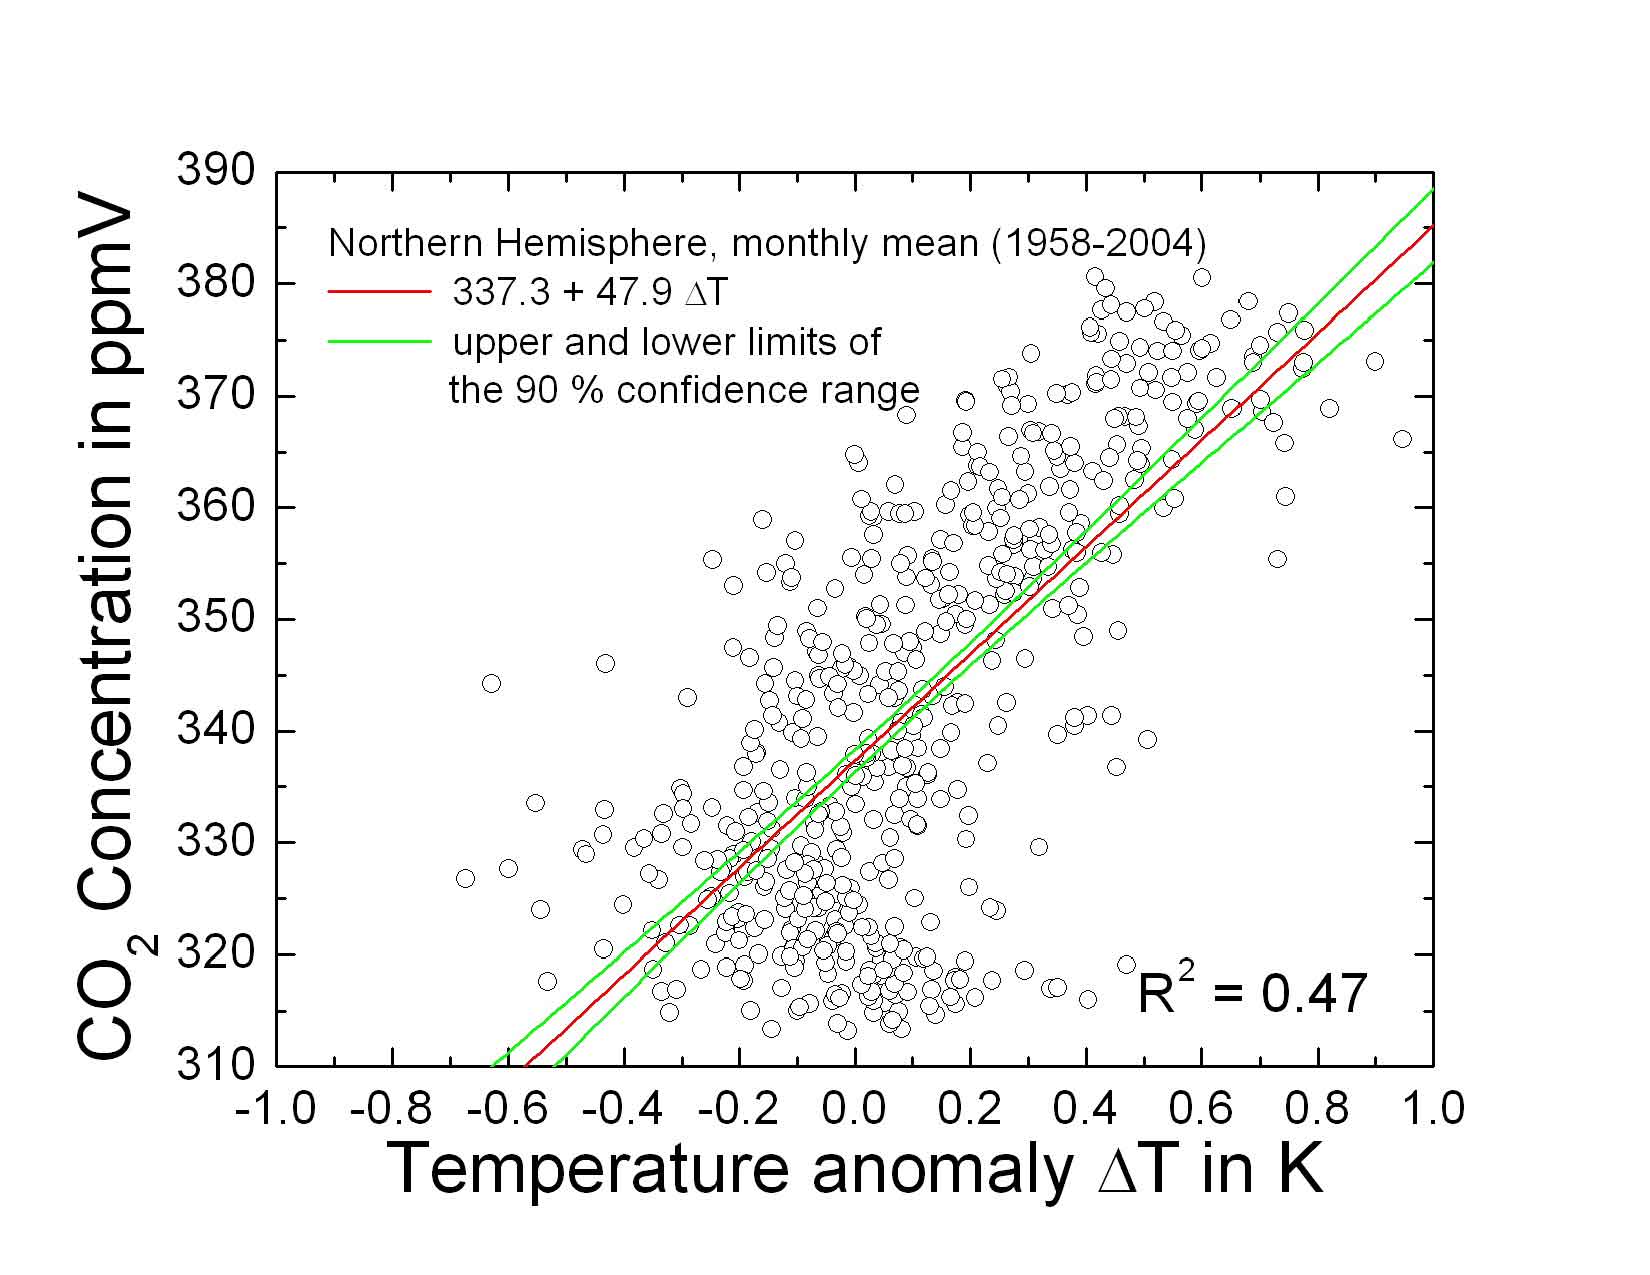
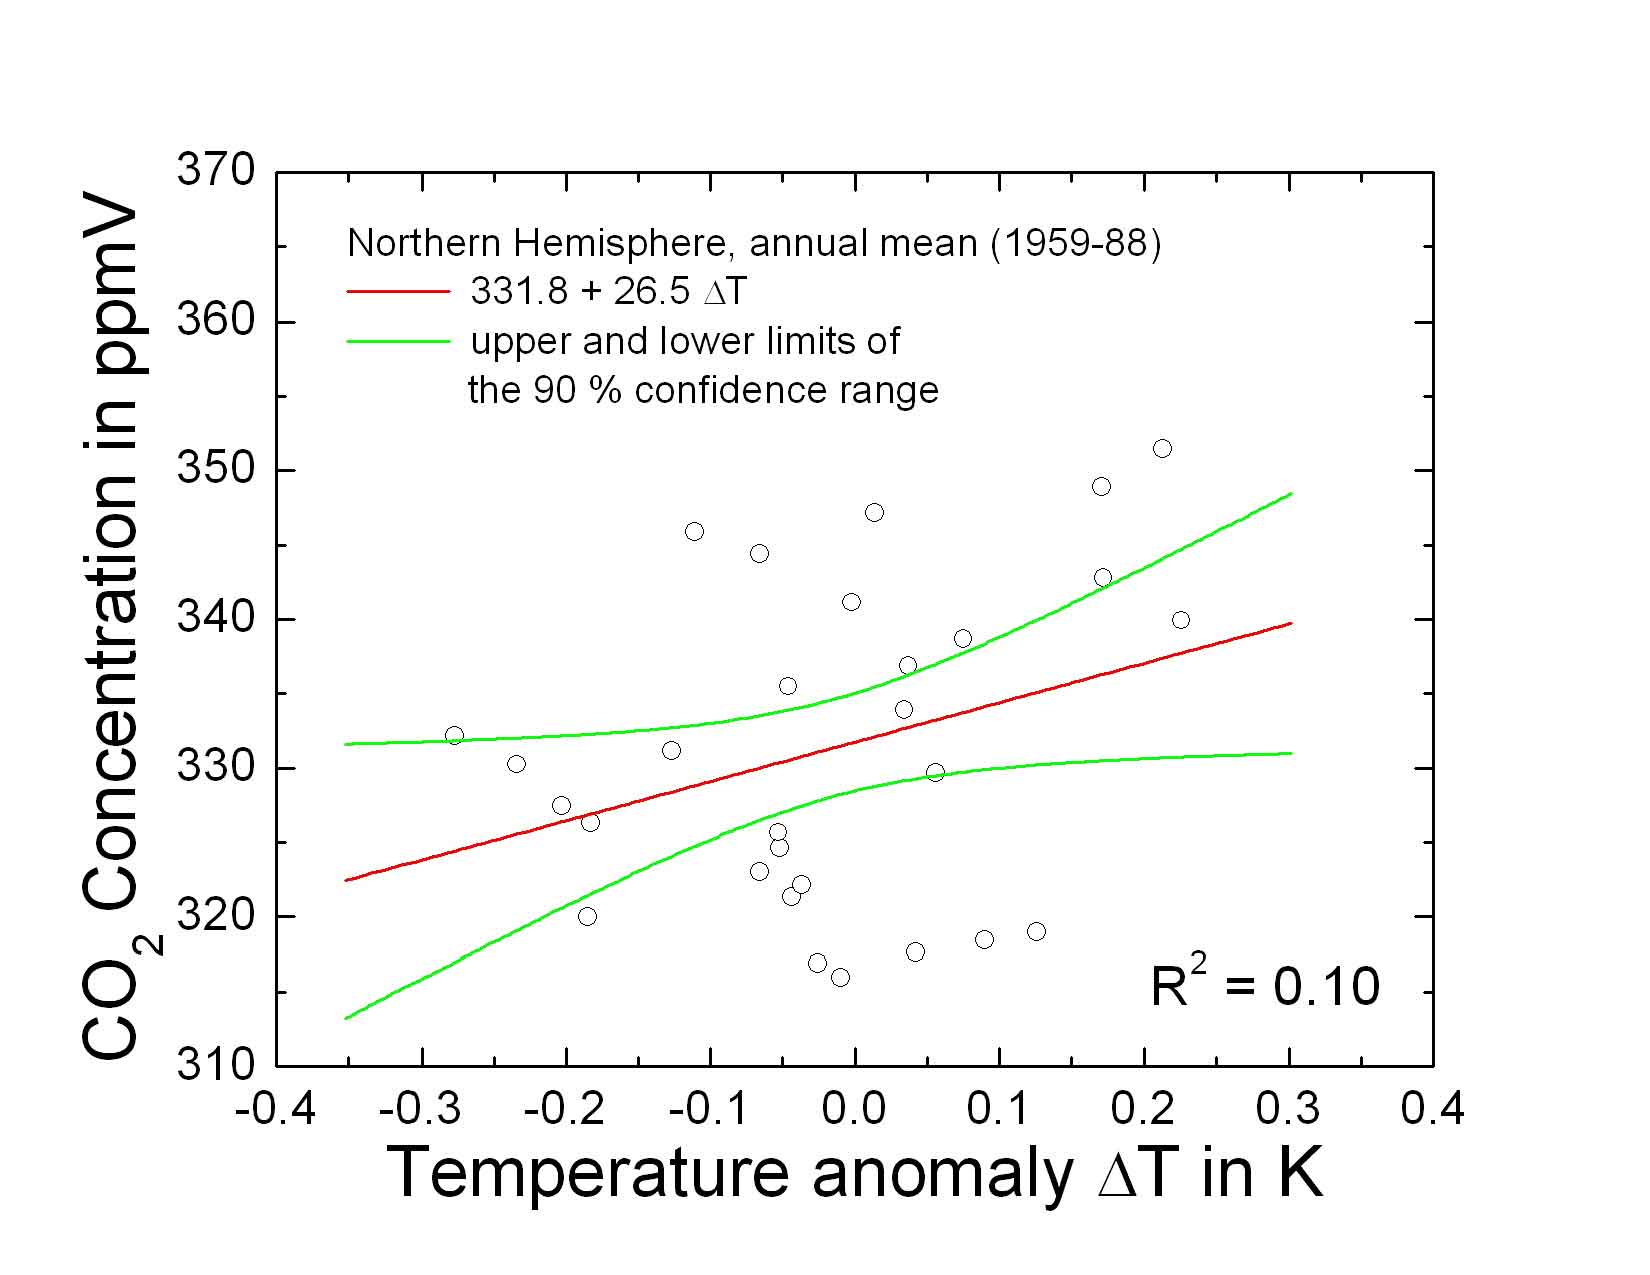
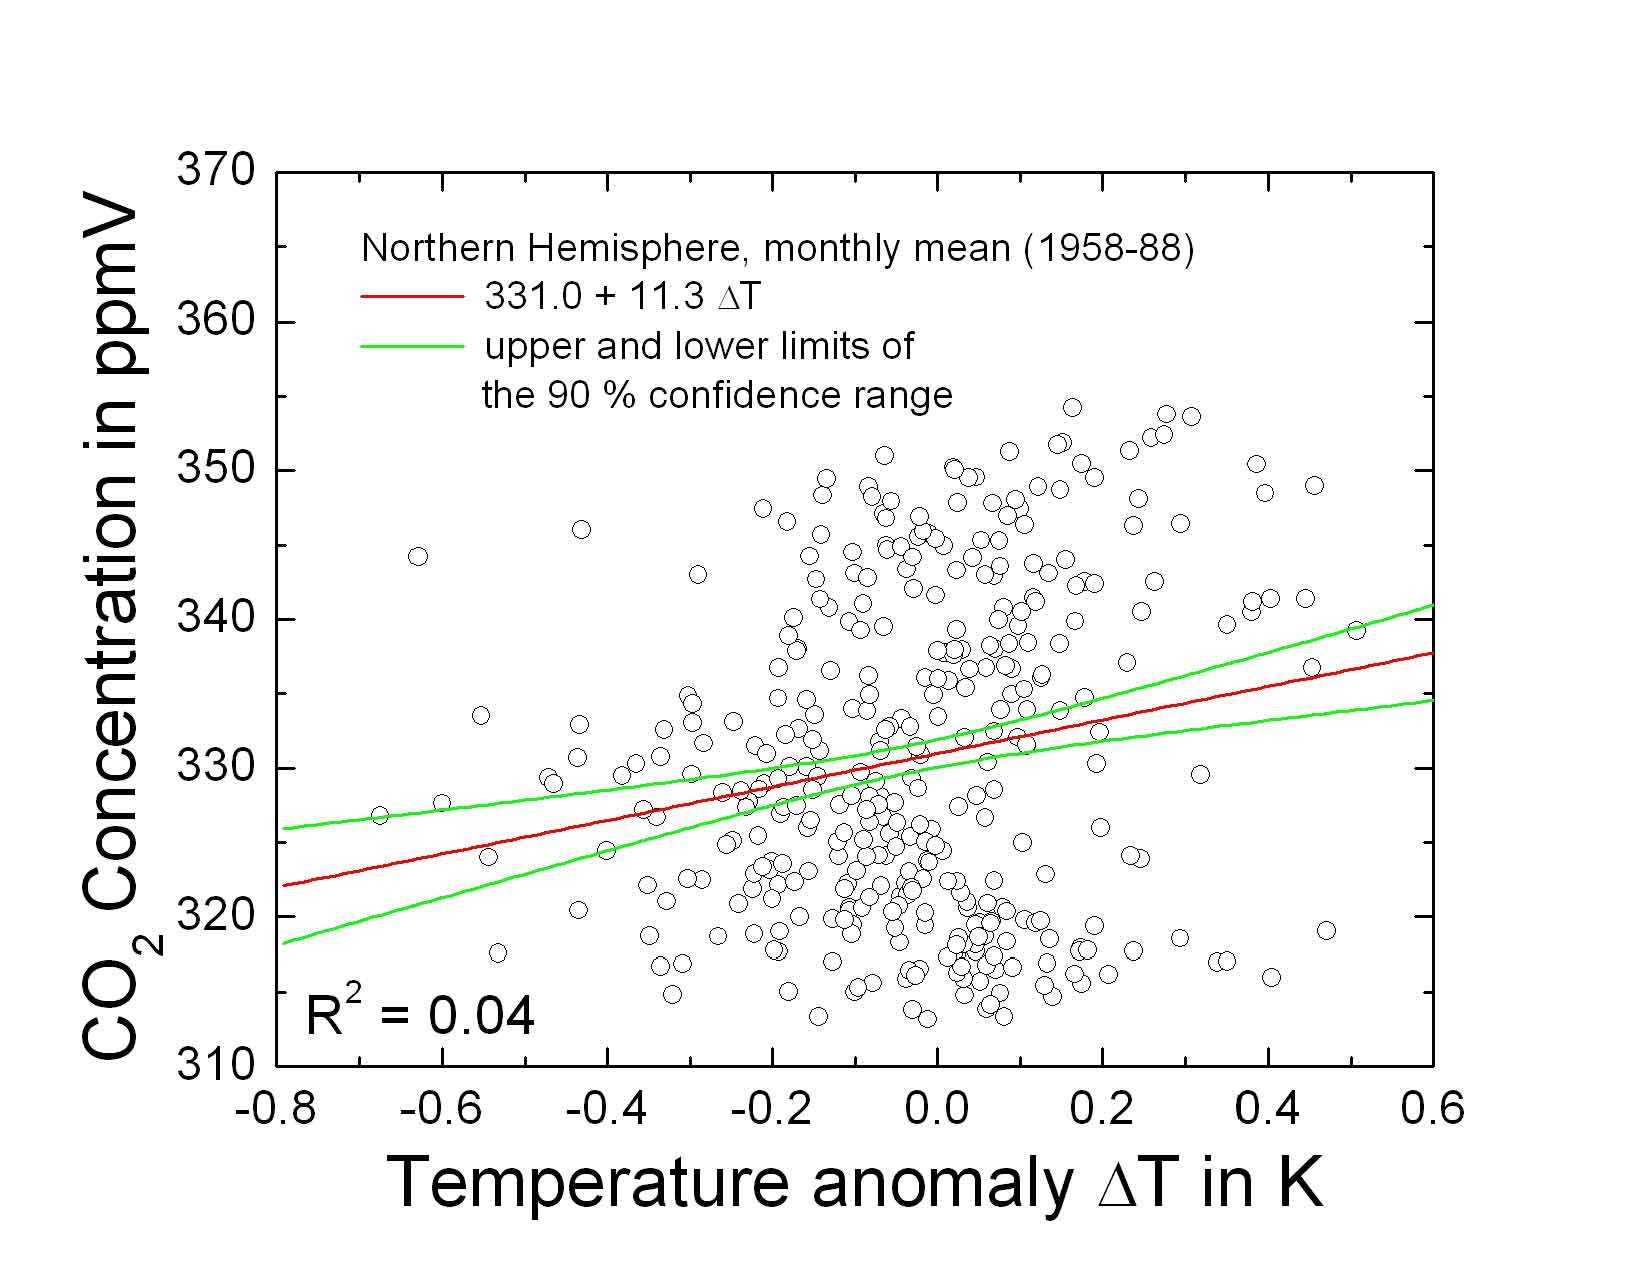
If we do not consider the whole period of available
data, then we might run in the wrong direction. Figures
3 and 4, for instance, illustrate results
from correlation calculations for the period ranging from 1958 to
1988. Remember that in 1988 the Intergovernmental Panel of Climate
Change (IPCC) of the United Nations and the World Meteorological
Organization (WMO) was established. As shown in the figures
attached, during 1988 there was certainly no correlation between
and the temperature anomalies, neither on the annual time
scale (Figure 3) nor on the monthly time scale (Figure
4). Consequently, I wonder why the IPCC was established
during that time.
References
- [1] S. Rahmstorf, A. Cazenave, J.A. Church, J.E. Hansen, R.F. Keeling, D.E. Parker, R.C.J. Somerville. Recent climate observations compared to projections. Science 316 (4 May 2007), p. 709.