Max-Planck-Institute für Astrophysik, Karl-Schwarzschild-Strasse 1, 85749, Garching, Germany
22email: n.werner@sron.nl 33institutetext: F. Durret 44institutetext: Institut d’Atrophysique de Paris, CNRS, UMR 7095, Université Pierre et Marie Curie, 98bis Bd Arago, F-75014 Paris, France 55institutetext: T. Ohashi 66institutetext: Institute of Space and Astronautical Science, JAXA, 3-1-1 Yoshinodai, Sagamihara, Kanagawa 229-8510, Japan 77institutetext: S. Schindler 88institutetext: Institut für Astro- und Teilchenphysik, Universität Innsbruck, Technikerstr. 25, A-6020 Innsbruck, Austria 99institutetext: R.P.C. Wiersma 1010institutetext: Leiden Observatory, Leiden University, P.O. Box 9513, 2300 RA Leiden, The Netherlands
Observations of metals in the intra-cluster medium
Abstract
Because of their deep gravitational potential wells, clusters of galaxies retain all the metals produced by the stellar populations of the member galaxies. Most of these metals reside in the hot plasma which dominates the baryon content of clusters. This makes them excellent laboratories for the study of the nucleosynthesis and chemical enrichment history of the Universe. Here we review the history, current possibilities and limitations of the abundance studies, and the present observational status of X-ray measurements of the chemical composition of the intra-cluster medium. We summarise the latest progress in using the abundance patterns in clusters to put constraints on theoretical models of supernovae and we show how cluster abundances provide new insights into the star-formation history of the Universe.
Keywords:
Galaxies: clusters Galaxies: abundances X-rays: galaxies: clusters1 Introduction
Clusters of galaxies are excellent astrophysical laboratories, which allow us to study the chemical enrichment history of the Universe. They have the deepest known gravitational potential wells which keep the metals produced in the stellar populations of the member galaxies within the clusters. About 70–90 % of the baryonic mass content of clusters of galaxies is in the form of hot ( K) X-ray emitting gas (Ettori & Fabian 1999). In this hot intra-cluster medium (ICM) the dominant fraction of cluster metals resides. To the extent that the stellar populations where the cluster metals were synthesised can be considered representative, the metal abundances in the ICM provide constraints on nucleosynthesis and on the star formation history of the Universe.
It is remarkable that all the abundant elements, that were synthesised in stars after the primordial nucleosynthesis, have the energies of their K- and L-shell transitions in the spectral band accessible to modern X-ray telescopes. Most of the observed emission lines in the ICM arise from the well understood hydrogen and helium like ions and their equivalent widths can be, under the reasonable assumption of collisional equilibrium, directly converted into the elemental abundance of the corresponding element. Complications arising from optical depth effects, depletion into dust grains, extinction, non-equilibrium ionisation are minimal or absent. Therefore, abundance determinations of the hot ICM are more robust than those of stellar systems, H ii regions or planetary nebulae. This relatively uncomplicated physical environment makes the ICM an attractive tool for studies of the chemical enrichment (for the theoretical progress in metal enrichment processes see Schindler & Diaferio 2008 - Chapter 17, this volume).
2 Sources of metals
Most of the metals from O up to the Fe-group are produced by supernovae. The supernovae can be roughly divided into two groups: Type Ia supernovae (SN Ia) and core collapse supernovae (SNCC).
| Element | W7 | W70 | WDD1 | WDD2 | WDD3 | CDD1 | CDD2 | |||||||
|---|---|---|---|---|---|---|---|---|---|---|---|---|---|---|
| O | 0. | 0314 | 0. | 0280 | 0. | 0214 | 0. | 0136 | 0. | 0105 | 0. | 0235 | 0. | 0114 |
| Ne | 0. | 00443 | 0. | 00215 | 0. | 00157 | 0. | 000960 | 0. | 00107 | 0. | 00180 | 0. | 000714 |
| Mg | 0. | 0221 | 0. | 0390 | 0. | 0219 | 0. | 0109 | 0. | 00584 | 0. | 0231 | 0. | 00976 |
| Si | 0. | 356 | 0. | 317 | 0. | 706 | 0. | 453 | 0. | 316 | 0. | 746 | 0. | 413 |
| S | 0. | 405 | 0. | 410 | 0. | 843 | 0. | 544 | 0. | 380 | 0. | 890 | 0. | 496 |
| Ar | 0. | 378 | 0. | 433 | 0. | 846 | 0. | 555 | 0. | 384 | 0. | 896 | 0. | 506 |
| Ca | 0. | 326 | 0. | 460 | 0. | 908 | 0. | 604 | 0. | 427 | 0. | 972 | 0. | 566 |
| Fe | 1. | 0 | 1. | 0 | 1. | 0 | 1. | 0 | 1. | 0 | 1. | 0 | 1. | 0 |
| Ni | 3. | 22 | 2. | 18 | 0. | 957 | 1. | 25 | 1. | 41 | 0. | 914 | 1. | 26 |
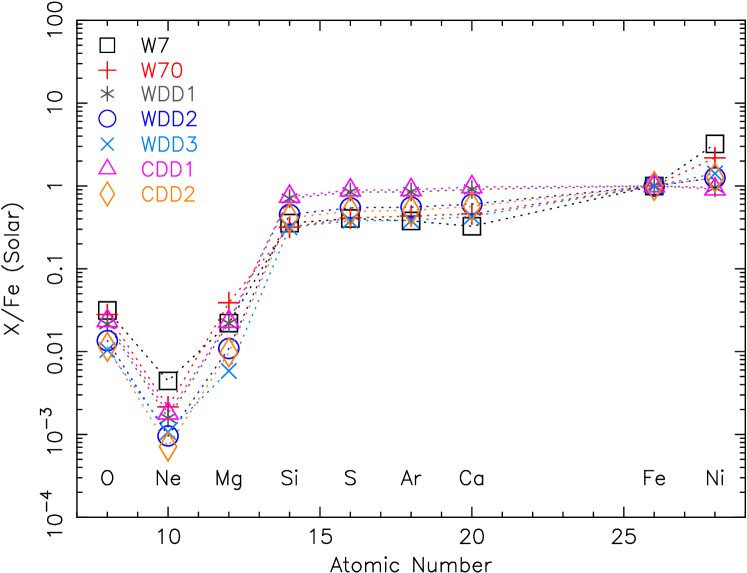
SN Ia are most likely thermonuclear explosions of accreting white dwarfs. When the white dwarf reaches the Chandrasekhar limit, carbon ignition in the central region leads to a thermonuclear runaway. A flame front then propagates through the star at a subsonic speed as a deflagration wave. In the delayed-detonation models, the deflagration wave is assumed to be transformed into a detonation at a specific density. SN Ia produce a large amount of Fe, Ni, and Si-group elements (Si, S, Ar, and Ca). Contrary to SNCC, they produce only very small amounts of O, Ne, and Mg. In Fig. 1 and Table 1 we show the theoretically calculated yields for different SN Ia models (Iwamoto et al. 1999). We show the yields of elements relative to the yield of Fe in the Solar units of Grevesse & Sauval (1998). Convective deflagration models are represented by the W7 and W70 models. The WDD1, WDD2, WDD3, CDD1, and CDD2 models refer to delayed-detonation explosion scenarios and the last digit indicates the deflagration to detonation density in units of g cm-3. The “C” and “W” refer to two different central densities ( and g cm-3, respectively) in the model at the onset of the thermonuclear runaway. The relative yield of the Si-group elements can be a good indicator of the incompleteness of the Si-group burning into Fe-group elements. Delayed detonation models have typically higher yields of Si-group elements relative to Fe than the deflagration models. The Ni/Fe abundance ratio in the SN Ia ejecta is an indicator of neutron-rich isotope production, which depends on the electron capture efficiency in the core of the exploding white dwarf. The deflagration models produce larger Ni/Fe ratios than the delayed detonation models.
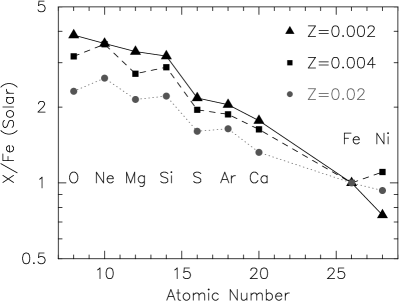
In the left panel of Fig. 2 and Table 2 we show the theoretical yields for three SNCC models integrated over Salpeter and top-heavy initial mass functions (IMFs) between 10 and 50 M⊙ (Woosley & Weaver 1995; Chieffi & Limongi 2004; Nomoto et al. 2006). See also Borgani et al. 2008 - Chapter 18, this volume for more details on stellar population models. In the right panel of Fig. 2 we show the SNCC yields for the Salpeter IMF for different progenitor metallicities (where refers to Solar metallicity; Nomoto et al. 2006). The Fe yield of the model by Woosley & Weaver (1995) is about an order of magnitude lower than that in the models by Chieffi & Limongi (2004) and Nomoto et al. (2006). The plots also show that abundance ratios of O/Mg and Ne/Mg can be used to discriminate between different IMFs. The SNCC yields for progenitors of different metallicities differ mainly in O/Ne/Mg ratio. Because the progenitor metallicities and perhaps also the IMF evolve, the applicability of comparing the observed data with a single average set of yields may be limited. However, the abundances of these elements in the ICM may still be used to infer to what extent was the dominant fraction of the SNCC progenitors preenriched, and what was its IMF.
We note, that while the abundances in Fig. 1 and 2 are shown with respect to the Solar values of Grevesse & Sauval (1998), in literature and also in several figures of this review the abundances are often shown with respect to the outdated Solar abundances by Anders & Grevesse (1989) or with respect to newer sets of Solar and proto-solar abundances by Lodders (2003). The more recent Solar abundance determinations of O, Ne, and Fe by Lodders (2003) are 30 % lower than those given by Anders & Grevesse (1989). The Solar abundances of O and Ne reported by Grevesse & Sauval (1998) are higher and the abundance of Fe is slightly lower than those reported by Lodders (2003). A comparison of different Solar abundance values is shown in Table 3.

| Element | Nomoto et al. (2006) | Chieffi & Limongi (2004) | Woosley & Weaver (1995) | |||||||||
| Salpeter | top-heavy | Salpeter | top-heavy | Salpeter | top-heavy | |||||||
| O | 3. | 18 | 10. | 8 | 2. | 13 | 6. | 67 | 33. | 0 | 79. | 6 |
| Ne | 3. | 55 | 10. | 7 | 2. | 53 | 7. | 59 | 15. | 4 | 31. | 8 |
| Mg | 2. | 71 | 6. | 63 | 1. | 80 | 3. | 94 | 13. | 8 | 28. | 5 |
| Si | 2. | 88 | 6. | 50 | 1. | 82 | 3. | 55 | 29. | 9 | 50. | 9 |
| S | 1. | 95 | 4. | 49 | 1. | 33 | 2. | 72 | 23. | 9 | 42. | 7 |
| Ar | 1. | 87 | 4. | 24 | 1. | 49 | 3. | 08 | 30. | 5 | 57. | 1 |
| Ca | 1. | 63 | 3. | 70 | 1. | 37 | 2. | 80 | 22. | 2 | 31. | 1 |
| Fe | 1. | 0 | 1. | 0 | 1. | 0 | 1. | 0 | 1. | 0 | 1. | 0 |
| Ni | 1. | 10 | 0. | 475 | 1. | 11 | 0. | 501 | 497. | 208. | ||
| element | AG | GS | Lodders |
|---|---|---|---|
| H | 12.00 | 12.00 | 12.00 |
| He | 10.99 | 10.93 | 10.98 |
| C | 8.56 | 8.52 | 8.46 |
| N | 8.05 | 7.92 | 7.90 |
| O | 8.93 | 8.83 | 8.76 |
| Ne | 8.09 | 8.08 | 7.95 |
| Mg | 7.58 | 7.58 | 7.62 |
| Si | 7.55 | 7.55 | 7.61 |
| S | 7.21 | 7.33 | 7.26 |
| Ar | 6.56 | 6.40 | 6.62 |
| Ca | 6.36 | 6.36 | 6.41 |
| Fe | 7.67 | 7.50 | 7.54 |
| Ni | 6.25 | 6.25 | 6.29 |
While elements from O up to the Fe-group are produced by supernovae, the main sources of carbon and nitrogen are still being debated. Both elements are believed to originate from a wide range of sources including winds of short-lived massive metal rich stars, longer-lived low- and intermediate-mass stars, and also an early generation of massive stars (e.g. Gustafsson et al. 1999; Chiappini et al. 2003; Meynet & Maeder 2002).
In the Galaxy, Shi et al. (2002) found that C is enriched by winds of metal-rich massive stars at the beginning of the Galactic disk evolution, while at a later stage it is produced mainly by low-mass stars. Bensby & Feltzing (2006) found that the C enrichment in the Galaxy is happening on a time scale very similar to that of Fe. They conclude that while in the early Universe the main C contributors are massive stars, C is later produced mainly by asymptotic giant branch (AGB) stars.
Nitrogen is produced during hydrogen burning via the CNO and CN cycles as both a primary and secondary element. In primary nucleosynthesis its production is independent of the initial metallicity of the star. Primary production of N happens during hydrogen shell burning in intermediate mass stars of M⊙ (Matteucci & Tosi 1985). Stellar models that include the effects of rotation indicate that massive stars between 9 and 20 M⊙ may also produce primary N (Maeder & Meynet 2000). In secondary production, which is common to stars of all masses, N is synthesised from C and O and its abundance is therefore proportional to the initial metallicity of the star. The primary versus secondary production of N can be studied by investigating the N/O ratio as a function of O/H ratio. In the case of primary N production the N/O ratio will be constant. For the secondary production we will observe a linear correlation between the logarithms of N/O and O/H. The combination of primary and secondary nucleosynthesis will produce a non-linear relation. The ICM abundance of C and N was measured only in a few bright nearby galaxy clusters and elliptical galaxies (Peterson et al. 2003; Werner et al. 2006a). However, future instruments (see Sect. 8) will allow to measure the abundances of these elements in many clusters. This will be important for a better understanding of the stellar nucleosynthesis.
3 Abundance studies before XMM-Newton and Chandra
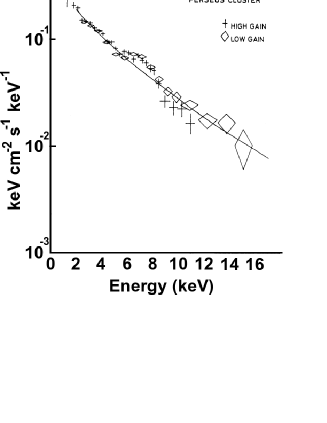
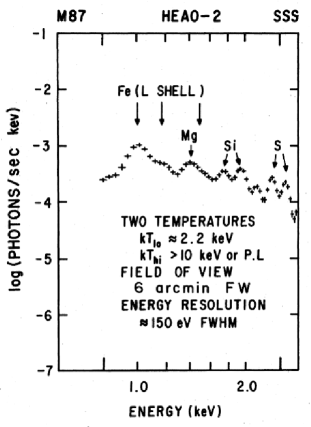
The discovery of the Fe-K line emission in the spectrum of the Perseus cluster by the Ariel V satellite (see the left panel of Fig. 3, Mitchell et al. 1976) and in Coma and Virgo by OSO-8 (Serlemitsos et al. 1977) confirmed that the X-ray emission of galaxy clusters is predominantly thermal radiation from hot intra-cluster gas rather than inverse Compton radiation. These observations showed that the hot plasma in clusters of galaxies contains a significant portion of processed gas, which was ejected from stars in the cluster galaxies. Subsequent spectroscopic analysis of cluster samples observed with OSO-8 and HEAO-1 A2 satellites revealed that the ICM has an Fe abundance of about one-third to one-half of the Solar value (Mushotzky et al. 1978; Mushotzky 1984). Combining spectra obtained by Einstein and Ginga, White et al. (1994) found an indication of a centrally enhanced metallicity in four cooling flow clusters. Unfortunately, the spectrometers on the Einstein observatory were not sensitive to the Fe-K line emission, because the mirror on the satellite was not sensitive to photon energies above 4 keV. However, the Solid-State Spectrometer (SSS) and the high-resolution Focal Plane Crystal Spectrometer (FPCS) on Einstein (Giacconi et al. 1979) allowed to detect emission lines at low energies. Using the SSS the K lines from Mg, Si, and S and the L lines from Fe were detected in the spectrum of M 87 (see the right panel of Fig. 3), Perseus, A 496, and A 576 (Lea et al. 1982; Mushotzky et al. 1981; Nulsen et al. 1982; Mushotzky 1984). Using the FPCS spectra of M 87 the O viii K line was detected (Canizares et al. 1979), implying an O/Fe ratio of 3–5, and the relative strength of various Fe-L line blends showed that the gas cannot be at a single temperature.
However, until the launch of ASCA in 1993, Fe was the only element for which the abundance was accurately measured in a large number of clusters. ASCA allowed to detect the emission features from O, Ne, Mg, Si, S, Ar, Ca, Fe, and Ni in the spectra of a number of clusters. Furthermore, it allowed to accurately determine the Fe abundances out to redshift . ASCA data revealed a lack of evolution in the Fe abundance out to redshift (Mushotzky & Loewenstein 1997; Rizza et al. 1998) and no evidence for a decrease at higher redshifts (Donahue et al. 1999). ASCA data were the first to show that in cooling core clusters the metallicity increases toward the centre (Fukazawa et al. 1994).
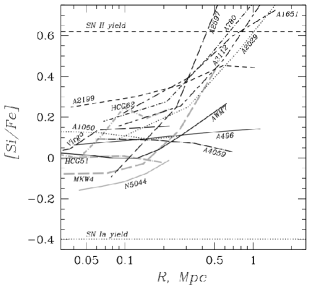
By analysing data of four clusters of galaxies, Mushotzky et al. (1996) found that the relative abundances of O, Ne, Si, S, and Fe are consistent with an origin in SNCC. They suggest that SNCC provided a significant fraction of metals in the ICM. Fukazawa et al. (1998) showed that the Si abundance and the Si/Fe ratio increases from the poorer to the richer clusters, suggesting that the relative contribution of SNCC increases toward richer clusters. They propose the possibility that a considerable fraction of SNCC products escaped the poorer systems. Finoguenov et al. (2000) used ASCA data to show that SN Ia products dominate in the cluster centres and the SNCC products are more evenly distributed (see the left panel of Fig. 4).
However, the large and energy dependent point-spread function (2′ half-power radius) of ASCA did not allow to investigate the spatial abundance distributions in detail. De Grandi & Molendi (2001) took advantage of the better spatial resolution (1′ half-power radius) of BeppoSAX and they measured the radial Fe abundance profiles for a sample of 17 rich nearby clusters of galaxies. They found that while the eight non-cooling core clusters in their sample have flat Fe abundance profiles, the Fe abundance is enhanced in the central regions of the cooling core clusters (see the right panel of Fig. 4). De Grandi et al. (2004) show that the mass associated with the abundance excess found at the centre of cool core clusters can be entirely produced by the brightest cluster galaxy (BCG).
The bandpass of the ROSAT PSPC was well suited for X-ray bright galaxies and groups of galaxies with temperatures of 1 keV and its PSF allowed for spatially resolved spectral analysis on a half-arcminute scale. Buote (2000a) investigated the deprojected abundance gradients in 10 galaxies and groups. In 9 of the 10 systems they found an abundance gradient, with the Fe abundance one to several times the Solar value within 10 kpc, decreasing to 0.5 Solar at 50–100 kpc distance.
The emerging picture from the abundance studies with ASCA and BeppoSAX data was that of an early homogeneous enrichment by SNCC, which produce -elements in the protocluster phase, and a subsequent more centrally peaked enrichment by SN Ia which have longer delay times and continue to explode in the cD galaxy for a long time after the cluster is formed.
Analysing and stacking all the data of clusters of galaxies observed with ASCA into temperature bins, Baumgartner et al. (2005) found a trend showing that the relative contribution of SNCC is larger in higher temperature clusters than in the clusters with lower temperature. Moreover, they found that Si and S do not track each other as a function of temperature, and Ca and Ar have much lower abundances than expected. They conclude that the -elements do not behave homogeneously as a single group and the trends indicate that different enrichment mechanisms are important in clusters of different masses.
4 The possibilities and limitations of elemental abundance determinations
4.1 Spectral modelling and the most common biases
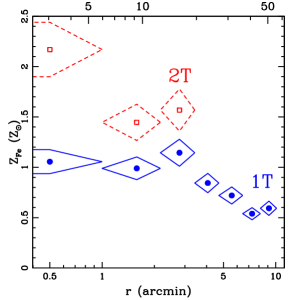
The correct modelling of the temperature structure is crucial for the elemental-abundance determinations. Fitting the spectrum of a multi-temperature plasma with a simple single-temperature model results in best-fitting elemental-abundances that are too low. This effect is the most important in galaxies, groups of galaxies and in the cooling cores of clusters. Many studies have found significantly subsolar values for the Fe abundance in groups of galaxies, with abundances generally less than the stellar values in these systems, and less than those observed in galaxy clusters. To reconcile these observations with the chemical enrichment models, it has been postulated that galaxy groups accrete primordial gas after they have been expelling gas during most of their evolution (Renzini 1997). Buote & Canizares (1994) showed that if a galaxy spectrum has intrinsically two temperature components, the single-temperature model can give a significantly underestimated metallicity. Buote (2000b) demonstrated that in a spectrum characterised by two temperatures, one below 1 keV and one above 1 keV, with an average of 1 keV, the lower temperature component preferentially excites emission lines in the Fe-L complex below 1 keV (Fe xvii–xxi), while the higher temperature component excites the Fe-L lines from 1–1.4 keV (Fe xxi–xxiv). If these components contribute approximately equally to the emission measure, the spectral shape of the Fe-L complex will be broader and flatter than the narrower Fe-L complex produced by a single-temperature model with the average temperature of the two components. In order to fit the flat spectral shape at 1 keV, the single-temperature model will fit a lower Fe abundance and will increase the thermal continuum. The strongest bias is at the low temperatures, for higher temperature plasmas the bias is smaller as the Fe-K line-emission becomes more important for the determination of the Fe abundance. Buote (2000b) also shows an excess in the Si/Fe and S/Fe ratios inferred for two-temperature plasmas fit by single-temperature models. He notes that the lower temperature component in the two-temperature plasma produces stronger Si and S emission, and the single-temperature model underestimates the continuum at higher energies. Therefore the Si/Fe and S/Fe ratios of multi-temperature ICM inferred using single-temperature models will yield values in excess of the true values. Buote (2000b) shows that this effect is the most important for the hotter clusters of galaxies. This bias may have played a role in the excess Si/Fe ratios and trends derived using ASCA data (Mushotzky et al. 1996; Fukazawa et al. 1998; Finoguenov et al. 2000; Baumgartner et al. 2005).
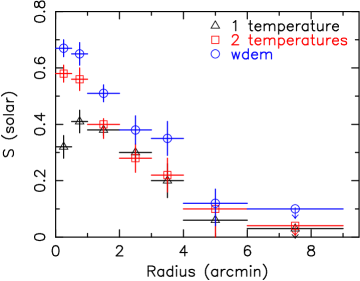
Several authors (e.g. Buote et al. 2003; Werner et al. 2006b; Matsushita et al. 2007a), using XMM-Newton and Chandra data, showed that the best-fitting abundances in the multi-phase cooling core regions of clusters and in groups increase when two-temperature models or more complicated differential emission measure (DEM) models are used. Buote et al. (2003) show that the abundances of O, Mg, Si, and Fe in the centre of NGC 5044 obtained using a two-temperature model are higher than those obtained using a single-temperature model. They also show that the Si/Fe ratio in the centre is significantly lower when a two-temperature model is used. Similar results were obtained for NGC 1399 (see the left panel of Fig. 5 Buote 2002). Analysing deep XMM-Newton data of the cluster 2A 0335+096, Werner et al. (2006b) showed that the abundances of all fitted elements (Mg, Si, S, Ar, Ca, Fe, Ni) in their model increased as they went from single- to two-temperature model, and to the multi-temperature DEM model. However, not only their absolute values increased but also the Si/Fe and the S/Fe ratios changed. Matsushita et al. (2007a) show an increase from single- to two- to multi-temperature models for O, Mg, Si, and Fe in the core of the Centaurus cluster. In the right panel of Fig. 5 we show the radial S profile obtained for 2A 0335+096 (Werner et al. 2006b) with single-, two-, and multi-temperature models.
As discussed in Buote (2000a) and Buote et al. (2003) in the lower mass systems ( keV) the best fit Fe abundance is sensitive to the lower energy limit used in spectral fitting. If the continuum at the low energies is not properly modelled, the equivalent widths of the lines in the Fe-L complex (and the oxygen line emission) will be inaccurate and the abundance determination will be incorrect. Buote et al. (2003) show the best-fitting Fe abundance in NGC 5044 determined with the lower energy limit at 0.7, 0.5, and 0.3 keV. They show that the results for each energy limit are significantly different and they obtain the highest Fe abundance for the lowest energy limit, which allows them to properly fit the continuum.
Since the keV component of the Galactic foreground emits O viii line emission, the uncertainties in the foreground/background model can cause systematic uncertainty in determining the oxygen abundance in the ICM. The temperature and flux of the keV Galactic foreground component is position dependent on the sky and cannot be properly subtracted with blank fields (for detailed discussion see de Plaa et al. 2006).
Systematic uncertainties in the abundance determination can be introduced if bright point sources are not excluded from the spectral fits, especially in the lower surface brightness regions of clusters. The contribution of point sources raises the continuum level, systematically reducing the observed line equivalent widths. If their contribution is not properly modeled, the best fitting thermal model will have a higher temperature and lower elemental abundances.
In general two plasma models are used for fitting cluster spectra: MEKAL (Mewe et al. 1985, 1986; Kaastra 1992; Liedahl et al. 1995; Mewe et al. 1995) and APEC (Smith et al. 2001). These codes have differences in their line libraries and in the way of modelling the atomic physics. This allows to test the robustness of the abundance determinations. Systematic effects on the best fit abundances due to the adopted plasma model were investigated for example by Buote et al. (2003), Sanders & Fabian (2006), and de Plaa et al. (2007). They conclude that despite small differences in the determined temperature structure, the derived abundances are generally consistent within the errors.
Using simulated galaxy clusters Kapferer et al. (2007a) show that the more inhomogeneously the metals are distributed within the cluster, the less accurate is the observed metallicity as a measure for the true metal mass. They show that in general the true metal mass is underestimated by observations. If the distribution of metals in the ICM is inhomogeneous, the true metal mass in the central parts ( kpc) of galaxy clusters can be up to three times higher than the metal mass obtained by X-ray observations. The discrepancies are due to averaging. As the metallicity and temperature are not constant throughout the extraction area, the integration of thermal Bremsstrahlung and of line radiation can lead to underestimated metal masses.
4.2 Possibilities and limitations of current instruments
XMM-Newton with its large effective area and superb spectral resolution, Chandra with its unprecedented spatial resolution, and Suzaku with its low background and good spectral resolution at low energies largely enhanced our knowledge on chemical abundances in galaxies, groups, and clusters of galaxies. In this section we describe the possibilities and the systematic uncertainties of abundance studies with these instruments.
4.2.1 XMM-Newton
Due to its large effective area and good spectral resolution, XMM-Newton is currently the best suited instrument to study abundances in the ICM. XMM-Newton has three identical telescopes and two sets of detectors on board. The first set of instruments is the European Photon Imaging Camera (EPIC), consisting of two metal oxide semiconductor - MOS1 and MOS2 - CCD arrays collecting 50 % of light from two telescopes, and the EPIC-pn CCD array collecting 100 % of light from one telescope on board. The second set of instruments are the Reflection Grating Spectrometers (RGS) that collect 50 % of light from two telescopes. Both sets of instruments play an important role in the abundance studies.
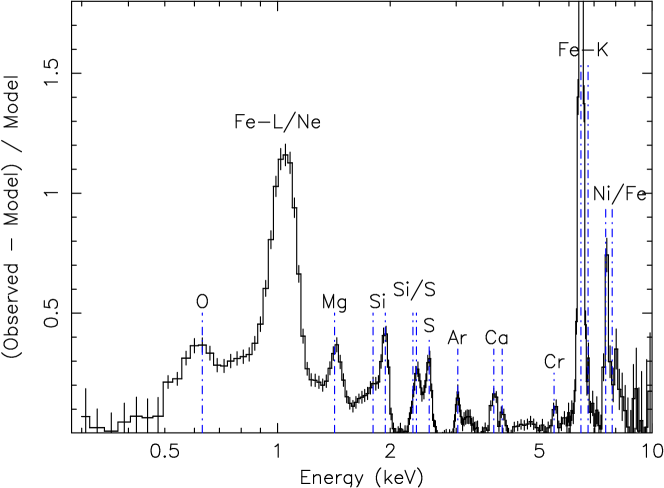
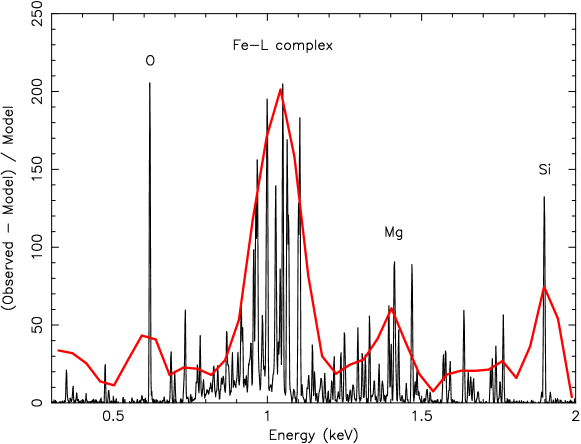
The advantages of EPIC are its broad bandpass, and good spatial and spectral resolutions, that allow us to detect the emission lines from O, Ne, Mg, Si, S, Ar, Ca, Fe, and Ni (see the top panel of Fig. 6). Furthermore, for deep observations of bright clusters, EPIC allows us to derive the spatial distribution of elements (see Sect. 5).
Unfortunately, the abundances determined in the cluster outskirts with low surface brightness using XMM-Newton remain uncertain due to the high background level. The value of the best fit temperature in these regions is very sensitive to the level of the subtracted background (e.g. de Plaa et al. 2006) and as we show above in Sect. 4.1, the temperature modelling is very important for the correct abundance determination.
The O line emission in the spectrum is strong, but its abundance is difficult to measure because it is sensitive to the assumed model for the Galactic foreground (see Sect. 4.1) and there are still remaining calibration uncertainties at low energies. The 1s–2p Ne lines at 1.02 keV are in the middle of the Fe-L complex (lying between 0.8 to 1.4 keV). The resolution of the EPIC cameras is not sufficient to resolve the individual lines in the Fe-L complex, which makes the Ne abundance determination by EPIC uncertain. However, the abundances of O and Ne in the cores of cooling core clusters, observed with XMM-Newton with sufficient statistics, can be well determined using the high spectral resolution of the RGS.
The systematic differences in the effective-area between EPIC-MOS and EPIC-pn are of the order of 5–10 % in certain bands (Kirsch 2006). By using data with high photon statistics and fitting spectra obtained by EPIC-MOS and EPIC-pn separately, de Plaa et al. (2007) investigated the magnitude of the systematic errors on the best-fitting abundances of elements heavier than Ne due to the uncertainties in the effective area calibration. They found that the elemental abundances most influenced by the calibration uncertainties are Mg, Si, and Ni. de Plaa et al. (2007) show that the systematic uncertainties on Mg are the largest, since the effective-area of EPIC-pn has a dip with respect to the effective-area of EPIC-MOS at the energies of the magnesium lines. This causes the Mg abundance derived by EPIC-pn to be underestimated. For the abundances of Si and Ni they estimate that the systematic uncertainties are 11 % and 19 %, respectively. Although EPIC-MOS and EPIC-pn show large systematic differences at the energy of the Mg lines, the Mg abundances derived by EPIC-MOS and Chandra ACIS for the Centaurus cluster are consistent (Matsushita et al. 2007a; Sanders & Fabian 2006), and the Mg abundances derived by the EPIC-MOS and RGS using the deep observations of 2A 0335+096 also agree with each other.
The S abundance determination with EPIC is robust (e.g. de Plaa et al. 2007). Ar and Ca abundances should also be accurately determined, however their signal is usually weak, so the level of their observed equivalent widths may be somewhat sensitive to the continuum level.
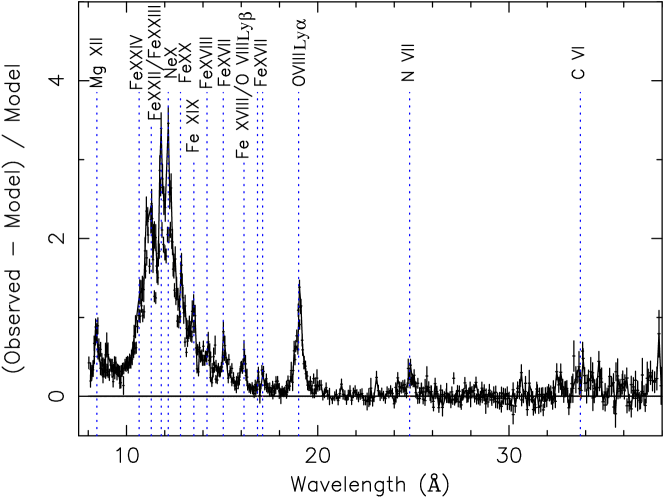
The RGS has a high spectral resolution but only a limited spatial resolution in the cross-dispersion direction. It allows for relatively accurate abundance measurements of O, Ne, Mg, Fe, and in the case of deep observations of nearby bright clusters and elliptical galaxies even the spectral lines of C and N are detected (see the bottom panel of Fig. 6). In the case of deep observations of nearby bright clusters, RGS allows us to extract spectra from typically five bins that are 1′ wide in the cross-dispersion direction and the photons in each bin are collected from 10′ long regions in the dispersion direction. This way RGS allows us to determine projected abundance profiles.
The spectral resolution of the RGS is, however, limited by the broadening of the observed line profiles caused by the spatial extent of the source along the dispersion direction. This makes RGS spectroscopy useful only for cooling core clusters with strongly peaked surface brightness distribution. In order to account for the line broadening in the spectral modelling, the model is convolved with the surface brightness profile of the source along the dispersion direction. Because the radial profile for a spectral line produced by an ion can be different from the radial surface brightness profile in a broad band, in practice the line profile is multiplied with a scale factor, which is a free parameter in the spectral fit. Different best fit line profiles for the Fe lines and for the O line emission can suggest a different radial distribution for these elements (de Plaa et al. 2006).
4.2.2 Chandra
Although the Advanced CCD Imaging Spectrometer (ACIS) on Chandra has a much smaller effective area than the EPIC on XMM-Newton, which makes it less suitable for abundance studies of the ICM, it is the instrument of choice for studies of metal enrichment in galaxies, where a good spatial resolution is required. Chandra is able to resolve the substantial fraction of X-ray binaries in galaxies as point sources, so their contribution can be excluded from the spectral modelling of the inter-galactic medium (IGM). The excellent spatial resolution also makes it possible to investigate the spatial temperature variations, which can bring a bias into the determination of abundances (see Sect. 4.1). The spectral resolution of ACIS is sufficient to reliably determine the abundances of a number of elements in the ICM and IGM. With deep enough exposure times Chandra ACIS can be used to study the ICM abundances of O, Ne, Mg, Si, S, Ar, Ca, Fe, and Ni (e.g. Sanders et al. 2004; Sanders & Fabian 2006).
Humphrey et al. (2004) discuss the systematic uncertainties in the abundance determinations due to the uncertainties in the absolute calibration of ACIS. After correcting for the charge transfer inefficiency (CTI) using an algorithm by Townsley et al. (2002), they found a change of in the best fit Fe abundance of NGC 1332.
Sanders & Fabian (2006) investigate the systematic uncertainties on the abundance determinations with the S3 chip of Chandra ACIS in the Centaurus cluster. They conclude that for the best determined elements the non-CTI-corrected Chandra and XMM-Newton results agree well. The only element where the Chandra and XMM-Newton data do not agree is oxygen. There has been a buildup of contamination on the ACIS detectors, which influences the effective area calibration at the low energies making the O abundance determination difficult. The iridium coating of the Chandra mirrors produces a steep drop in the effective area at around 2.05 keV, introducing a potential systematic uncertainty in the Si abundance determination. However, the Si abundances determined by Chandra and XMM-Newton agree well (Sanders & Fabian 2006).
4.2.3 Suzaku
The advantage of the X-ray Imaging Spectrometer (XIS) detectors (Koyama et al. 2007) on Suzaku (Mitsuda et al. 2007) compared to EPIC on XMM-Newton is its better spectral resolution below 1 keV, and the low background, providing a better sensitivity at the O line energy. Suzaku also allows for better measurements of the Mg lines in the low surface brightness cluster outskirts, which is difficult with EPIC/MOS due to the presence of a strong instrumental Al line close to the expected energy of the observed Mg lines.
The relatively broad point spread function of XIS with a half-power diameter of 2′ (Serlemitsos et al. 2007) does not allow detailed investigations of the spatial distribution of elements.
The effective area of the XIS detectors below 1 keV is affected by carbon and oxygen contamination of the optical blocking filter. The contamination is time and position dependent. Its column density and spatial distribution are still not well known. Matsushita et al. (2007b) estimate that the uncertainty in the thickness and chemical composition of the contaminating column results in a 20 % systematic error on the O abundance.
5 Spatial distribution of elements
5.1 Radial abundance profiles
Observations with XMM-Newton and Chandra confirmed the centrally peaked metallicity distribution in the cooling core clusters and the flat distribution of metals in the non-cooling core clusters (Vikhlinin et al. 2005; Pratt et al. 2007) previously seen with BeppoSAX. XMM-Newton and Chandra also confirmed the strong contribution of SN Ia to the enrichment of cluster cores found by ASCA. The observations are consistent with the picture of an early contribution by SNCC and later enrichment of cluster cores by SN Ia. One of the first abundance studies with XMM-Newton, performed on the cooling core cluster Abell 496, showed a radially flat distribution of O, Ne, and Mg and centrally peaked distribution of Ar, Ca, Fe, and Ni (Tamura et al. 2001). The abundance peak in the cluster core is consistent with the idea that the excess metals were produced by SNe Ia in the cD galaxy. However, the strongly increasing Si/Fe ratio toward the outskirts seen with ASCA was not confirmed with XMM-Newton.
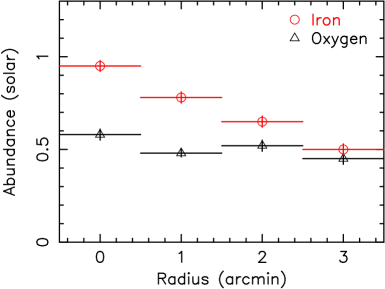
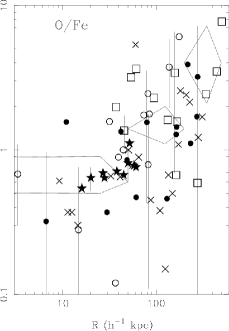
Analysing XMM-Newton EPIC data of M 87, Böhringer et al. (2001) and Finoguenov et al. (2002) found rather low O/Fe ratio in the cluster core, that increased toward the outer regions. Analysing the same dataset, Gastaldello & Molendi (2002) questioned these results, showing that the O/Fe ratio in the inner 9′ is constant. As shown in the left panel of Fig. 7, using XMM-Newton RGS data, Werner et al. (2006a) found a centrally peaked Fe abundance gradient and a flat O distribution in M 87 confirming the results of Böhringer et al. (2001), Finoguenov et al. (2002), and Matsushita et al. (2003) (the O abundance profiles found by Gastaldello & Molendi (2002) were different because of calibration problems at low energies in the early days of the mission). The RGS data reveal an O/Fe ratio of 0.6 in the cluster core and a ratio of 0.9 at a distance of 3′ (14 kpc) from the centre. However, the XMM-Newton EPIC data show that the Si abundance has a similar gradient in M 87 as the Fe abundance. A similar abundance pattern with a rather flat radial distribution of O, and centrally peaked Si, and Fe abundances is observed in the cluster sample analysed by Tamura et al. (2004, see the right panel of Fig. 7), in the Perseus cluster (Sanders et al. 2004), in Abell 85 (Durret et al. 2005), in Sérsic 159-03 (de Plaa et al. 2006), in 2A 0335+096 (Werner et al. 2006b), in the Centaurus cluster (Matsushita et al. 2007a; Sanders & Fabian 2006), and in the Fornax cluster (Matsushita et al. 2007a). The abundances of Si and Fe have similar gradients also in the group of galaxies NGC 5044 (Buote et al. 2003), with a constant radial distribution of Si/Fe. The radial distribution of O in this group is consistent with being flat. Suzaku observations of the clusters A 1060 (Sato et al. 2007c) and AWM 7 (Sato et al. 2007a) also showed rather low O abundance of around 0.5 Solar within about 5′ from the core without a clear abundance decline in the outer regions.
The radial metallicity gradients in cooling flow clusters often display an inversion in the centre (e.g. Sanders & Fabian 2002). This apparent metallicity drop in the very central region is often the result of an oversimplified model in the spectral analysis (see Sect. 4 and Molendi & Gastaldello 2001). However, in some cases the metallicity drop in the cluster core is robust. In the Perseus cluster the abundances peak at the radius of 40 kpc and they decrease at smaller radii. This inversion does not disappear when extra temperature components and power-law models are included, or when projection effects are taken into account (Sanders & Fabian 2007).
Böhringer et al. (2004) found that long enrichment times (5 Gyr) are necessary to produce the observed central abundance peaks. Since the classical cooling flows, or a strongly convective intra-cluster medium, or a complete metal mixing by cluster mergers would destroy the observed abundance gradients, they conclude that cooling cores in clusters are preserved over very long times. Böhringer et al. (2004) and Matsushita et al. (2007b) show that the iron-mass-to-light ratio in the central region of the Centaurus cluster (the mass of Fe relative to the B-band luminosity of the stellar population of the cD galaxy) is much higher than that of M 87. This indicates that the accumulation time scale of the SN Ia products was much higher in Centaurus than in M 87. In agreement with the conclusions of De Grandi et al. (2004) they also conclude that the innermost part of the ICM is dominated by gas originating mainly from the stellar mass loss of the cD galaxy.
If the metals originate from the stellar population of the cD galaxy, then in the absence of mixing the abundance profiles would follow the light profiles. The observed metal profiles are much less steep than the light profiles, which suggests that the injected metals are mixed and they diffuse to larger radii. Rebusco et al. (2005, 2006) model the diffusion of metals by stochastic gas motions after they were ejected by the brightest galaxy and compare their results with the peaked Fe abundance profiles of 8 groups and clusters. They suggest that the AGN/ICM interaction makes an important contribution to the gas motion in the cluster cores.
In order to determine the metallicities of the stellar populations of galaxies and star clusters it has become a common practice to use the feature made up of the Mg b line and the Mg H band around 5200 Å, which is known as the Mg2 index. The Mg2 index appears to be a relatively good metallicity indicator. In M 87, Centaurus, and the Fornax clusters the O and Mg abundances in the centre are consistent with the optical metallicity of the cD galaxy derived from the Mg2 index (Matsushita et al. 2003, 2007b, 2007a). The Mg2 index mainly depends on the Mg abundance, but also on the total metallicity where the O contribution matters most, and depends weakly on the age population of stars. The agreement between the O and Mg abundances in the ICM with the stellar metallicities supports the view that the ICM in the cluster centres is dominated by the gas ejected from the cD galaxies. However, the Mg/Fe ratio in the stellar populations of elliptical galaxies is significantly higher than that in the hot gas (Humphrey & Buote 2006). The observed difference shows that since the time when the current stellar populations of these ellipticals formed, a significant number of SNe Ia enriched the gas in addition to the stellar mass loss.
Observations indicate that at large radii clusters have a flat abundance distribution of about 0.2 Solar. By using Suzaku data, Fujita et al. (2007) found that the gas is enriched to a metallicity of 0.2 Solar out to the virial radii of clusters A 399 and A 401. These clusters are at the initial stage of a merger and their virial radii partially overlap. The authors interpret their finding as a result of early enrichment by galactic superwinds in the proto-cluster stage. However, the extraction region used by Fujita et al. (2007) is large and their measured Fe abundance might be significantly biased toward the value at about half of the virial radii of the clusters.
5.2 2D distribution of metals
Deep observations of bright clusters of galaxies with XMM-Newton and Chandra allow to map the 2D distribution of metals in the ICM (Sanders et al. 2004; Durret et al. 2005; O’Sullivan et al. 2005; Sauvageot et al. 2005; Finoguenov et al. 2006; Werner et al. 2006b; Sanders & Fabian 2006; Bagchi et al. 2006). In general the distribution of metals in clusters is not spherically symmetric, and in several cases it shows edges in the abundance distribution or several maxima and complex metal patterns. The 2D distribution of metals is a good diagnostic tool, which can be used together with the maps of thermodynamic properties to investigate the complex structure of cluster cores and the merging history of clusters (e.g. Kapferer et al. 2006).
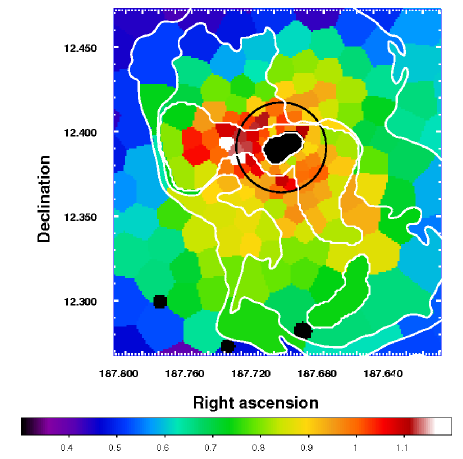
M 87 provides us with the unique opportunity to study in detail the role of the AGN feedback in transporting and distributing the metals into the ICM. The high X-ray surface brightness and small distance of M 87 allow a detailed study of the 2D distribution of several elements (O, Si, S, and Fe). By analysing deep (120 ks) XMM-Newton data, Simionescu et al. (2007) found that the spatial distribution of metals shows a clear enhancement along the radio lobes, where the rising radio emitting plasma ejected by the AGN uplifts cooler gas from the core of the cluster (see Fig. 8). Furthermore, they showed that the metallicity of the cool uplifted ( keV) gas is 2.2 times Solar and the abundance ratios in and outside the multi-phase region associated with the uplifted gas are very similar. They estimate that the mass of the cool gas is and it probably originates from the stellar winds enriched with SN Ia products. Approximately yr are required to produce the observed mass of cool gas, indicating that the uplift of cool gas by AGN radio bubbles is a rare event.
6 Element ratios and their reconstruction with supernova models
The chemical elements that we see in the ICM are the integral yield of all the different supernova types that have left their specific abundance patterns in the gas prior and during cluster evolution. Since the launch of ASCA, which for the first time allowed the determination of abundances of elements other than Fe in the ICM (see Sect. 3), several groups tried to use the ICM abundance patterns to constrain the contribution of different kinds of supernovae to the ICM enrichment and to put constraints on the theoretical supernova models.
In the following subsection we review these efforts. The still somewhat ambiguous results of these efforts are summarised in section 6.2
6.1 Results on reconstructed supernova models
Mushotzky et al. (1996) investigated the elemental abundances in four clusters, removing the central regions, and concluded that the abundance ratios are consistent with the contribution of SNCC. Dupke & White (2000) found that most of the Fe ( %) in the cores of their investigated clusters comes from SN Ia, and they used these central regions dominated by SN Ia ejecta to discriminate between competing theoretical models for SN Ia. They showed that the observed high Ni/Fe ratio of 4 is more consistent with the W7 convective deflagration SN Ia model than with the delayed detonation models. Stacking all the cluster data in the ASCA archive into temperature bins, Baumgartner et al. (2005) showed that the abundances of the most well determined elements Fe, Si, and S do not give a consistent solution for the fraction of material produced by SN Ia and SNCC at any given cluster temperature. They concluded that the pattern of elemental abundances requires an additional source of metals other than SN Ia and SNCC, which could be the early generation of Population III stars.
The ASCA estimates were largely based on the Si/Fe ratio, which has the disadvantage of Si being contributed by both SN Ia and SNCC. The much improved sensitivity of XMM-Newton to measure the spectral lines of more elements at a higher statistical significance offers better opportunities to constrain the supernova models.
Finoguenov et al. (2002) used XMM-Newton EPIC to accurately measure the abundances of O, Ne, Mg, Si, S, Ar, Ca, Fe, and Ni in the hot gas in two radial bins of M 87. They found that the Si-group elements (Si, S, Ar, Ca) and Fe have a stronger peak in the central region than O, Ne, and Mg. The SN Ia enrichment in the centre is characterised by a Solar ratio of Si-group elements to Fe. The inferred SN Ia enrichment in the outer region, associated with the ICM of the Virgo cluster, has a lower ratio of Si-group elements to Fe by 0.2 dex, which is more characteristic for the ICM of other clusters (Finoguenov et al. 2000). Finoguenov et al. (2002) also find a Ni/Fe ratio of 1.5 in the central region, while they point out that this ratio for other clusters determined by ASCA is 3. They conclude that these abundance patterns confirm the diversity of SN Ia and to explain the SN Ia metal enrichment in clusters both deflagration and delayed detonation scenarios are required. The high SN Ia yield of Si-group elements in the centre may imply that the Si burning in SN Ia is incomplete. This favours the delayed-detonation models with lower density of deflagration-detonation transition, lower C/O ratio, and lower central ignition density. On the other hand, the abundance patterns in the outer region of M 87 are more characteristic of deflagration supernova models.
A bimodal distribution is observed in the magnitude decline of the SN Ia events. While a population of SN Ia with a slow decline is more common in spiral and irregular galaxies with recent star formation, a fainter and more rapidly decaying population of SN Ia is more common in early-type galaxies (Hamuy et al. 1996; Ivanov et al. 2000). The SN Ia with incomplete Si burning enriching the central part of M 87 could be associated with optically fainter SNe Ia observed in early-type galaxies. Mannucci et al. (2006) found that the present data on SN Ia rates in different populations of parent galaxies indicate that SN Ia have a bimodal delay time distribution. They conclude that about 50 % of SN Ia explode soon after the formation of the progenitor binary system, in a time of the order of years, while the delay time distribution of the remaining 50 % of SN Ia can be described by an exponential function with a decay time of 3 Gyr. The supernovae with short delay times might be associated with the supernovae with the slower decline, while the supernovae with long delay times might be associated with the rapidly decaying SNe Ia. If this association is true, then the observed Si/Fe of the accumulated SN Ia ejecta will be a function of the age of the system.
Matsushita et al. (2007a) show that SN Ia ejecta have a higher Fe/Si ratio in regions with larger iron-mass-to-light ratio (IMLR). Higher IMLR corresponds to longer accumulation time scale. The correlation between the inferred Fe/Si ratio of SN Ia ejecta and the IMLR supports the suggestion by Finoguenov et al. (2002) and Matsushita et al. (2003) that the average Fe/Si ratio produced by SN Ia depends on the age of the system.
Böhringer et al. (2005) compiled the available observational results of the O/Si/Fe from XMM-Newton, Chandra, and ASCA to show that the observed abundance patterns in clusters are more consistent with the WDD models, which provide larger Si/Fe ratios than the W7 model. Buote et al. (2003) and Humphrey & Buote (2006) also discuss the higher -element enrichment observed in groups and in elliptical galaxies. They conclude that there is an increasing evidence that the O is over-predicted by the theoretical SNCC yields, or there is a source of -element enrichment in addition to that provided by SNCC and SN Ia.

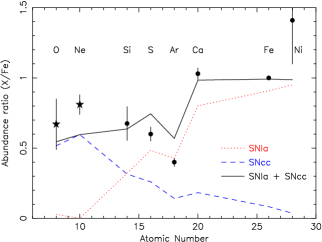
Using deep XMM-Newton observations of the clusters 2A 0335+096 and Sérsic 159-03, Werner et al. (2006b) and de Plaa et al. (2006) determined the abundances of 9 elements and fitted them with nucleosynthesis models for supernovae. They found that 30 % of all supernovae enriching the ICM were SN Ia and 70 % were SNCC. They also found that the Ca abundance in these clusters is higher than that expected from the models. Later, de Plaa et al. (2007) used a sample of 22 clusters observed with XMM-Newton to determine the abundances of Si, S, Ar, Ca, Fe, and Ni in the ICM within the radius of and they compared the best-fitting abundances with theoretically predicted yields of different SN Ia and SNCC models (see Fig. 9). Because the SNCC do not have a significant impact on the Ar/Ca ratio, de Plaa et al. (2007) used the Ar and Ca abundances in clusters as a criterion for determining the quality of SN Ia models. They found that the Ar and Ca abundances in the ICM are inconsistent with currently favored SN Ia models. However, they showed that their best fit Ca/Fe and Ar/Ca ratios are consistent with the empirically modified delayed-detonation SN Ia model, which is calibrated on the Tycho supernova remnant (Badenes et al. 2006). Using this model, de Plaa et al. (2007) obtained a number ratio of , which suggests that binary systems in the appropriate mass range are very efficient ( %) in eventually forming SN Ia explosions.
Based on Suzaku observations of 2 clusters (A1060 and AWM 7) and 2 groups of galaxies (HCG 62 and NGC 507), Sato et al. (2007b) obtained abundance patterns for O, Mg, Si, S, and Fe in the region out to . Contrary to most of the previously mentioned results, they found a better fit to the observed abundance patterns using the W7 SN Ia model rather than the WDD models. Assuming the W7 model for SN Ia, the yields from Nomoto et al. (2006) and the Salpeter IMF for SNCC, the ratio of occurrence numbers of SNcc to SN Ia is 3.5. It corresponds to the number ratio of , which is smaller than that obtained by de Plaa et al. (2007). The number ratios were determined only considering the metals in the ICM and metals locked up in the stars were not considered.
6.2 Summary of the efforts of using ICM abundances to constrain supernova models
The abundance patterns obtained during many deep observations of clusters of galaxies with XMM-Newton clearly favor the delayed-detonation SN Ia models (see Böhringer et al. 2005) and the observed abundance ratios of Ar/Ca are relatively well reproduced using empirically modified delayed-detonation models calibrated on the Tycho supernova remnant (de Plaa et al. 2007). However, several observations still favor the W7 SN Ia model (Sato et al. 2007b) and in most of the cases the abundances are not determined well enough to really discriminate between the different models. As Finoguenov et al. (2002) suggest it might even be possible that both the deflagration and delayed-detonation types of SN Ia play a role in the chemical enrichment of clusters of galaxies.
XMM-Newton RGS observations of the hot gas in clusters of galaxies and in elliptical galaxies reveal Ne/O ratios which are higher than Solar (Xu et al. 2002; Peterson et al. 2003; Werner et al. 2006a, b). SN Ia produce very little O and Ne, and their ratio can be used to put constraints on the progenitors of SNCC. From the SNCC models discussed in Sect. 2 only the models with pre-enriched progenitors predict higher than Solar Ne/O ratio.
While it is well known that elements from O up to the Fe-group are primarily produced in supernovae, the main sources of C and N are still being debated (see Sect. 2). Deep observations of nearby X-ray bright elliptical galaxies and bright clusters with the RGS on XMM-Newton allow to measure the C and N abundances in the hot gas. By combining the RGS data obtained in two deep XMM-Newton observations of M 87, Werner et al. (2006a) determined relatively accurate C and N abundance values. The small O/Fe ratio and large C/Fe and N/Fe ratios found in M 87 suggest that the main sources of C and N are not the massive stars that also produce large quantities of O, but the low- and intermediate-mass asymptotic giant branch stars.
7 Abundances as function of cluster mass and redshift
Arnaud et al. (1992) studied the correlations between the gas mass, Fe mass, and optical luminosity in clusters of galaxies. They found that the gas mass in the ICM is highly correlated and the Fe mass is directly proportional to the inegrated optical luminosity of elliptical and lenticular galaxies. They found no correlation with the integrated optical luminosity of spiral galaxies. The ratio of the gas mass in the ICM to the stellar mass increases with the cluster richness.
Renzini (1997) showed that the IMLR is very similar in all clusters of galaxies with ICM temperature above 1 keV. However, below 1 keV the IMLR seems to drop by almost 3 orders of magnitude. This drop at low temperatures is due to the combination of lower gas mass and lower measured Fe abundance in cool systems. However, it was shown that the low Fe abundances measured in many groups were artifacts of wrong temperature modelling (see later).
Renzini (1997, 2004) showed that clusters hotter than 2.5 keV have similar abundances, with very small dispersion. Below 2.5 keV, the best fit metallicities show a large range of values. The previously reported very low abundance values for low temperature groups and elliptical galaxies turn out to be much higher when two- or multi-temperature fitting is applied (see Sect. 4.1 and Buote & Fabian 1998; Buote 2000b; Buote et al. 2003; Humphrey & Buote 2006). However, the outer regions of galaxy groups still show very low metallicities. An XMM-Newton observation of the group NGC 5044 indicates an iron abundance in the hot gas of Solar in the region between 0.2 and 0.4 of the virial radius (Buote et al. 2004). This result shows that the total iron mass to optical light ratio in NGC 5044 is about 3 times lower than that observed in rich clusters.

We compiled the abundance values measured within 0.2 for the sample of 22 clusters analysed by de Plaa et al. (2007). In the top panel of Fig. 10 we show the best fit Fe abundance as a function of ICM temperature. Our data confirm earlier results showing that while in cooler clusters, in the temperature range of – keV, shows a range of values between – Solar, in hot massive clusters (k keV) the Fe abundance is on average lower and equal to Solar. We compare the observed trend with values from simulations extracted within 0.2 as the XMM-Newton data (Borgani et al. 2008 - Chapter 18, this volume). The data are simulated for the Salpeter IMF. The data are more consistent with the simulated values at the lower temperatures. At higher temperatures the simulated abundances are higher than the observed values. The observed trend might be linked to a decrease of the star formation efficiency with increasing cluster mass (Lin et al. 2003).
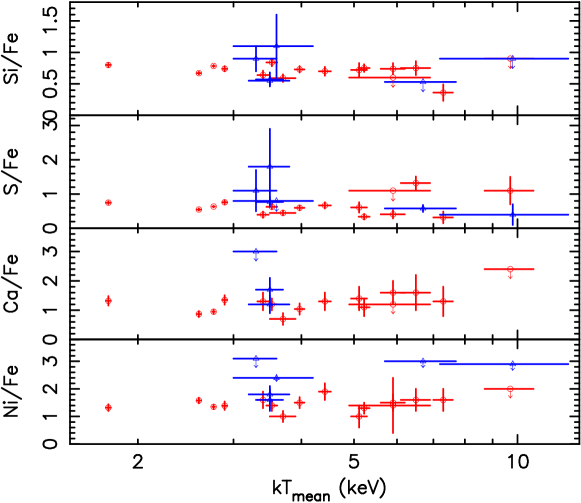
In the bottom panel of Fig. 10 we show the abundance ratios of Si, S, Ca, and Ni with respect to Fe as a function of the cluster temperature, compiled from de Plaa et al. (2007). The abundance ratios are consistent with being constant as a function of temperature, which is related to the cluster mass. The intrinsic spread in abundance ratios between clusters is smaller than 30 %. This finding contradicts the ASCA results (Baumgartner et al. 2005), which show an increase of the Si/Fe ratio from 0.7 to 3 Solar in the – keV temperature range. This result indicates that the ratios of SN Ia and SNCC contributing to the enrichment of the ICM are similar for clusters of all masses.
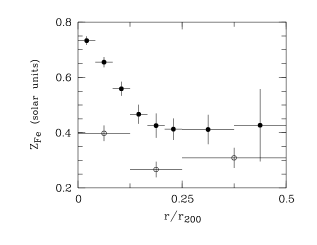
Investigating a sample of 56 clusters at , Balestra et al. (2007) confirmed the trend of the Fe abundance with cluster temperature also in the higher redshift clusters. They show that the abundance measured within (0.15–0.3) in clusters below 5 keV is, on average, a factor of 2 larger than in hot clusters, following a relation .
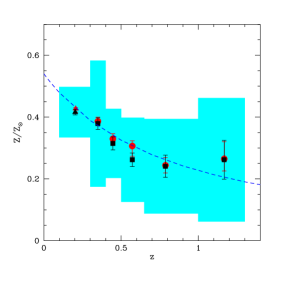
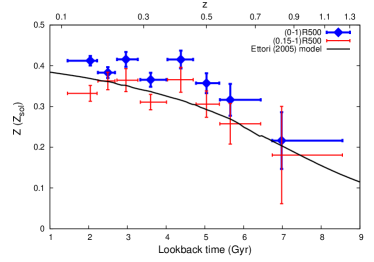
Balestra et al. (2007) also found an evolution of the Fe content in the ICM with redshift (see the left panel of Fig. 11). They conclude that the average Fe content of the ICM at the present epoch is a factor of 2 larger than at . While at the redshift they observe an average ICM abundance of Z⊙, in the redshift range of – they measure Z⊙. They parametrise the decrease of metallicity with redshift with a power-law . The evolution in the Fe abundance with redshift was confirmed by Maughan et al. (2007), who investigated a sample of 116 clusters of galaxies at in the Chandra archive (see the right panel of Fig. 11). They found a significant evolution with the abundance dropping by 50 % between and . They verified that the evolution is still present, but less significant, when the cluster cores are excluded from the abundance measurement (they use apertures of 0–1 R500 and 0.15–1 R500), indicating that the evolution is not solely due to disappearance of relaxed, cool core clusters at .
Simulations by Kapferer et al. (2007b) show that between redshifts of and a galaxy cluster accretes fresh gas, with the gas mass increasing during this time period by a factor of 3. Which means that in order to get an increase of the metallicity during this time period the freshly accreted gas must be pre-enriched or the input of metals into the ICM in this time interval must be larger than expected.
8 Future of ICM abundance studies
A major improvement in X-ray spectroscopy will be the employment of micro-calorimeters, and especially of the so-called Transition-Edge Sensors (TES) on future satellites (for more information on future instrumentation see Paerels et al. 2008 - Chaper 19, this volume). Compared to the current state-of-the-art CCD technology, this new type of detectors promises a factor of improvement in spectral resolution ( eV, depending on the optimalisation of the detector). To reach this high spectral resolution, the TES detectors use the transition edge between normal conductivity and superconductivity that is present in a number of materials. At temperatures of 0.1 K, the conductivity of the absorbing material is very sensitive to the temperature. When an X-ray photon hits the detector, its temperature rises and the resistance of the material increases. By measuring the increase of the resistance, one can calculate with high accuracy the energy of the X-ray photon. The main effort today is to build an array of TES detectors, with imaging capabilities. Next major proposed missions with TES arrays on board are, amongst others, the X-ray Evolving Universe Explorer (XEUS), Explorer of Diffuse emission and Gamma-ray burst Explosions (EDGE), and Constellation-X.
The combination of the large effective area (5 m2) and high spectral resolution ( eV) of XEUS will open up new possibilities in cluster abundance studies, with enormous improvement in the abundance determinations. In the left panel of Fig. 12 we show a simulated spectrum of the cluster Sérsic 159-03 (from de Plaa 2007), for the planned TES detector that will be part of the Narrow-Field Imager (NFI) on XEUS. For comparison also the model at the resolution of XMM-Newton EPIC is shown. With XEUS the abundances will be measured with an accuracy of Solar, which is more than an order of magnitude improvement compared to EPIC. This accuracy might be sufficient to detect the contribution of the Population-III stars to the enrichment of the ICM. Also spectral lines from more elements will be resolved, which will enable better tests for supernova models.
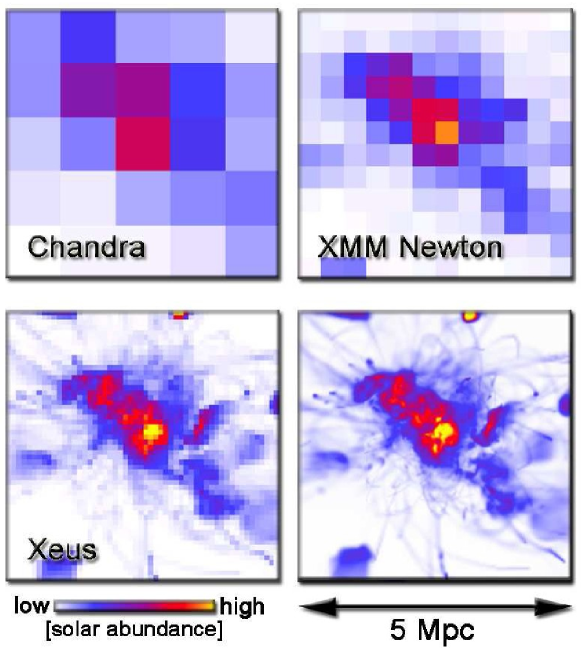
The large collecting area of XEUS in combination with the CCD-type detectors of the Wide-Field Imager will be excellent to observe the spatial distribution of metals, which will help us to constrain the enrichment history of clusters. Simulated metallicity maps by Kapferer et al. (2006) for Chandra, XMM-Newton, and XEUS are shown in the right panel of Fig. 12.
The proposed EDGE satellite would also open up new possibilities in the chemical abundance studies. The combination of the planned long exposure times (of the order of few Ms), large field of view (1.4 degrees) and good angular resolution (Half Power Diameter of 15′′) of its CCD type Wide-Field Imager, and the high spectral resolution (3 eV at 0.6 keV) of the Wide-field Spectrometer promises new possibilities in the studies of metal abundances in clusters. EDGE would not only increase the number of detected spectral lines and improve the accuracy of the abundance measurements, but it would also enable us to accurately measure the chemical abundances and the spatial distribution of metals in the faint outskirts of clusters out to their virial radius, which is beyond the possibilities of current instruments. This would provide us with insights of crucial importance for the understanding of the chemical enrichment processes, nucleosynthesis, and of the metal budget of the Universe.
Acknowledgements.
The authors thank ISSI (Bern) for the support of the team “Non-virialized X-ray components in clusters of galaxies”. We would like to thank Hans Böhringer and Alexis Finoguenov for reading the manuscript and providing comments. NW acknowledges support by the Marie Curie EARA Early Stage Training visiting fellowship. The Netherlands Institute for Space Research is supported financially by NWO, the Netherlands Organization for Scientific Research. We thank Joop Schaye for his help with the core collapse supernova yields. RW acknowledges support from Marie Curie Excellence Grant MEXT-CT-2004-014112.References
- Anders & Grevesse (1989) Anders, E. & Grevesse, N. 1989, Geochim. Cosmochim. Acta, 53, 197
- Arnaud et al. (1992) Arnaud, M., Rothenflug, R., Boulade, O., Vigroux, L., & Vangioni-Flam, E. 1992, A&A, 254, 49
- Badenes et al. (2006) Badenes, C., Borkowski, K. J., Hughes, J. P., Hwang, U., & Bravo, E. 2006, ApJ, 645, 1373
- Bagchi et al. (2006) Bagchi, J., Durret, F., Lima Neto, G. B., & Paul, S. 2006, Science, 314, 791
- Balestra et al. (2007) Balestra, I., Tozzi, P., Ettori, S., et al. 2007, A&A, 462, 429
- Baumgartner et al. (2005) Baumgartner, W. H., Loewenstein, M., Horner, D. J., & Mushotzky, R. F. 2005, ApJ, 620, 680
- Bensby & Feltzing (2006) Bensby, T. & Feltzing, S. 2006, MNRAS, 367, 1181
- Böhringer et al. (2001) Böhringer, H., Belsole, E., Kennea, J., et al. 2001, A&A, 365, L181
- Böhringer et al. (2004) Böhringer, H., Matsushita, K., Churazov, E., Finoguenov, A., & Ikebe, Y. 2004, A&A, 416, L21
- Böhringer et al. (2005) Böhringer, H., Matsushita, K., Finoguenov, A., Xue, Y., & Churazov, E. 2005, Adv. Sp. Res., 36, 677
- Borgani et al. (2008) Borgani, S., Fabjan, D., Tornatore, L., et al. 2008, SSR, in press
- Buote (2000a) Buote, D. A. 2000a, ApJ, 539, 172
- Buote (2000b) Buote, D. A. 2000b, MNRAS, 311, 176
- Buote (2002) Buote, D. A. 2002, ApJ, 574, L135
- Buote et al. (2004) Buote, D. A., Brighenti, F., & Mathews, W. G. 2004, ApJ, 607, L91
- Buote & Canizares (1994) Buote, D. A. & Canizares, C. R. 1994, ApJ, 427, 86
- Buote & Fabian (1998) Buote, D. A. & Fabian, A. C. 1998, MNRAS, 296, 977
- Buote et al. (2003) Buote, D. A., Lewis, A. D., Brighenti, F., & Mathews, W. G. 2003, ApJ, 595, 151
- Canizares et al. (1979) Canizares, C. R., Clark, G. W., Markert, T. H., et al. 1979, ApJ, 234, L33
- Chiappini et al. (2003) Chiappini, C., Matteucci, F., & Meynet, G. 2003, A&A, 410, 257
- Chieffi & Limongi (2004) Chieffi, A. & Limongi, M. 2004, ApJ, 608, 405
- Clementini et al. (1999) Clementini, G., Gratton, R. G., Carretta, E., & Sneden, C. 1999, MNRAS, 302, 22
- De Grandi et al. (2004) De Grandi, S., Ettori, S., Longhetti, M., & Molendi, S. 2004, A&A, 419, 7
- De Grandi & Molendi (2001) De Grandi, S. & Molendi, S. 2001, ApJ, 551, 153
- de Plaa (2007) de Plaa, J. 2007, Enrichment study of hot intra-cluster gas through X-ray spectroscopy (PhD thesis, Utrecht University)
- de Plaa et al. (2007) de Plaa, J., Werner, N., Bleeker, J. A. M., et al. 2007, A&A, 465, 345
- de Plaa et al. (2006) de Plaa, J., Werner, N., Bykov, A. M., et al. 2006, A&A, 452, 397
- Donahue et al. (1999) Donahue, M., Voit, G. M., Scharf, C. A., et al. 1999, ApJ, 527, 525
- Dupke & White (2000) Dupke, R. A. & White, III, R. E. 2000, ApJ, 528, 139
- Durret et al. (2005) Durret, F., Lima Neto, G. B., & Forman, W. 2005, A&A, 432, 809
- Ettori (2005) Ettori, S. 2005, MNRAS, 362, 110
- Ettori & Fabian (1999) Ettori, S. & Fabian, A. C. 1999, MNRAS, 305, 834
- Feldman (1992) Feldman, U. 1992, Phys. Scr., 46, 202
- Finoguenov et al. (2000) Finoguenov, A., David, L. P., & Ponman, T. J. 2000, ApJ, 544, 188
- Finoguenov et al. (2006) Finoguenov, A., Henriksen, M. J., Miniati, F., Briel, U. G., & Jones, C. 2006, ApJ, 643, 790
- Finoguenov et al. (2002) Finoguenov, A., Matsushita, K., Böhringer, H., Ikebe, Y., & Arnaud, M. 2002, A&A, 381, 21
- Fujita et al. (2007) Fujita, Y., Tawa, N., Hayashida, K., et al. 2007, PASJ, in press (astro-ph/0705.2017)
- Fukazawa et al. (1998) Fukazawa, Y., Makishima, K., Tamura, T., et al. 1998, PASJ, 50, 187
- Fukazawa et al. (1994) Fukazawa, Y., Ohashi, T., Fabian, A. C., et al. 1994, PASJ, 46, L55
- Gastaldello & Molendi (2002) Gastaldello, F. & Molendi, S. 2002, ApJ, 572, 160
- Giacconi et al. (1979) Giacconi, R., Branduardi, G., Briel, U., et al. 1979, ApJ, 230, 540
- Grevesse & Sauval (1998) Grevesse, N. & Sauval, A. J. 1998, SSR, 85, 161
- Gustafsson et al. (1999) Gustafsson, B., Karlsson, T., Olsson, E., Edvardsson, B., & Ryde, N. 1999, A&A, 342, 426
- Hamuy et al. (1996) Hamuy, M., Phillips, M. M., Suntzeff, N. B., et al. 1996, AJ, 112, 2438
- Humphrey & Buote (2006) Humphrey, P. J. & Buote, D. A. 2006, ApJ, 639, 136
- Humphrey et al. (2004) Humphrey, P. J., Buote, D. A., & Canizares, C. R. 2004, ApJ, 617, 1047
- Ivanov et al. (2000) Ivanov, V. D., Hamuy, M., & Pinto, P. A. 2000, ApJ, 542, 588
- Iwamoto et al. (1999) Iwamoto, K., Brachwitz, F., Nomoto, K., et al. 1999, ApJS, 125, 439
- Kaastra (1992) Kaastra, J. S. 1992, An X-ray Spectral Code for Optically Thin Plasmas (Internal SRON-Leiden Report, Updated Version 2.0)
- Kapferer et al. (2006) Kapferer, W., Ferrari, C., Domainko, W., et al. 2006, A&A, 447, 827
- Kapferer et al. (2007a) Kapferer, W., Kronberger, T., Weratschnig, J., & Schindler, S. 2007a, A&A, 472, 757
- Kapferer et al. (2007b) Kapferer, W., Kronberger, T., Weratschnig, J., et al. 2007b, A&A, 466, 813
- Kirsch (2006) Kirsch, M. 2006, http://xmm.vilspa.esa.es/docs/documents/CAL-TN-0018.pdf
- Koyama et al. (2007) Koyama, K., Tsunemi, H., Dotani, T., et al. 2007, PASJ, 59, 23
- Lea et al. (1982) Lea, S. M., Mushotzky, R., & Holt, S. S. 1982, ApJ, 262, 24
- Liedahl et al. (1995) Liedahl, D. A., Osterheld, A. L., & Goldstein, W. H. 1995, ApJ, 438, L115
- Lin et al. (2003) Lin, Y.-T., Mohr, J. J., & Stanford, S. A. 2003, ApJ, 591, 749
- Lodders (2003) Lodders, K. 2003, ApJ, 591, 1220
- Maeder & Meynet (2000) Maeder, A. & Meynet, G. 2000, A&A, 361, 159
- Mannucci et al. (2006) Mannucci, F., Della Valle, M., & Panagia, N. 2006, MNRAS, 370, 773
- Matsushita et al. (2007a) Matsushita, K., Böhringer, H., Takahashi, I., & Ikebe, Y. 2007a, A&A, 462, 953
- Matsushita et al. (2003) Matsushita, K., Finoguenov, A., & Böhringer, H. 2003, A&A, 401, 443
- Matsushita et al. (2007b) Matsushita, K., Fukazawa, Y., Hughes, J. P., et al. 2007b, PASJ, 59, 327
- Matteucci & Tosi (1985) Matteucci, F. & Tosi, M. 1985, MNRAS, 217, 391
- Maughan et al. (2007) Maughan, B. J., Jones, C., Forman, W., & Van Speybroeck, L. 2007, ApJS, in press (astro-ph/0703156)
- Mewe et al. (1985) Mewe, R., Gronenschild, E. H. B. M., & van den Oord, G. H. J. 1985, A&AS, 62, 197
- Mewe et al. (1995) Mewe, R., Kaastra, J. S., & Liedahl, D. A. 1995, Legacy, 6, 16
- Mewe et al. (1986) Mewe, R., Lemen, J. R., & van den Oord, G. H. J. 1986, A&AS, 65, 511
- Meynet & Maeder (2002) Meynet, G. & Maeder, A. 2002, A&A, 381, L25
- Mitchell et al. (1976) Mitchell, R. J., Culhane, J. L., Davison, P. J. N., & Ives, J. C. 1976, MNRAS, 175, 29P
- Mitsuda et al. (2007) Mitsuda, K., Bautz, M., Inoue, H., et al. 2007, PASJ, 59, 1
- Molendi & Gastaldello (2001) Molendi, S. & Gastaldello, F. 2001, A&A, 375, L14
- Mushotzky et al. (1996) Mushotzky, R., Loewenstein, M., Arnaud, K. A., et al. 1996, ApJ, 466, 686
- Mushotzky (1984) Mushotzky, R. F. 1984, Physica Scripta, T7, 157
- Mushotzky et al. (1981) Mushotzky, R. F., Holt, S. S., Boldt, E. A., Serlemitsos, P. J., & Smith, B. W. 1981, ApJ, 244, L47
- Mushotzky & Loewenstein (1997) Mushotzky, R. F. & Loewenstein, M. 1997, ApJ, 481, L63
- Mushotzky et al. (1978) Mushotzky, R. F., Serlemitsos, P. J., Boldt, E. A., Holt, S. S., & Smith, B. W. 1978, ApJ, 225, 21
- Nomoto et al. (1997) Nomoto, K., Hashimoto, M., Tsujimoto, T., et al. 1997, Nucl. Phys. A, 616, 79
- Nomoto et al. (1984) Nomoto, K., Thielemann, F.-K., & Yokoi, K. 1984, ApJ, 286, 644
- Nomoto et al. (2006) Nomoto, K., Tominaga, N., Umeda, H., Kobayashi, C., & Maeda, K. 2006, Nucl. Phys. A, 777, 424
- Nulsen et al. (1982) Nulsen, P. E. J., Stewart, G. C., Fabian, A. C., et al. 1982, MNRAS, 199, 1089
- O’Sullivan et al. (2005) O’Sullivan, E., Vrtilek, J. M., Kempner, J. C., David, L. P., & Houck, J. C. 2005, MNRAS, 357, 1134
- Owen et al. (2000) Owen, F. N., Eilek, J. A., & Kassim, N. E. 2000, ApJ, 543, 611
- Paerels et al. (2008) Paerels, F., Kaastra, J. S., Ohashi, T., et al. 2008, SSR, in press
- Peterson et al. (2003) Peterson, J. R., Kahn, S. M., Paerels, F. B. S., et al. 2003, ApJ, 590, 207
- Pratt et al. (2007) Pratt, G. W., Böhringer, H., Croston, J. H., et al. 2007, A&A, 461, 71
- Rebusco et al. (2005) Rebusco, P., Churazov, E., Böhringer, H., & Forman, W. 2005, MNRAS, 359, 1041
- Rebusco et al. (2006) Rebusco, P., Churazov, E., Böhringer, H., & Forman, W. 2006, MNRAS, 372, 1840
- Renzini (1997) Renzini, A. 1997, ApJ, 488, 35
- Renzini (2004) Renzini, A. 2004, in Clusters of Galaxies: Probes of Cosmological Structure and Galaxy Evolution, ed. J. S. Mulchaey, A. Dressler, & A. Oemler, 260
- Rizza et al. (1998) Rizza, E., Burns, J. O., Ledlow, M. J., et al. 1998, MNRAS, 301, 328
- Sanders & Fabian (2002) Sanders, J. S. & Fabian, A. C. 2002, MNRAS, 331, 273
- Sanders & Fabian (2006) Sanders, J. S. & Fabian, A. C. 2006, MNRAS, 371, 1483
- Sanders & Fabian (2007) Sanders, J. S. & Fabian, A. C. 2007, MNRAS, 381, 1381
- Sanders et al. (2004) Sanders, J. S., Fabian, A. C., Allen, S. W., & Schmidt, R. W. 2004, MNRAS, 349, 952
- Sarazin (1988) Sarazin, C. L. 1988, X-ray emissions from clusters of galaxies (Cambridge University Press)
- Sato et al. (2007a) Sato, K., Matsushita, K., Ishisaki, Y., et al. 2007a, PASJ, in press (astro-ph/0707.4342)
- Sato et al. (2007b) Sato, K., Tokoi, K., Matsushita, K., et al. 2007b, ApJ, 667, L41
- Sato et al. (2007c) Sato, K., Yamasaki, N. Y., Ishida, M., et al. 2007c, PASJ, 59, 299
- Sauvageot et al. (2005) Sauvageot, J. L., Belsole, E., & Pratt, G. W. 2005, A&A, 444, 673
- Schindler & Diaferio (2008) Schindler, S. & Diaferio, A. 2008, SSR, in press
- Serlemitsos et al. (1977) Serlemitsos, P. J., Smith, B. W., Boldt, E. A., Holt, S. S., & Swank, J. H. 1977, ApJ, 211, L63
- Serlemitsos et al. (2007) Serlemitsos, P. J., Soong, Y., Chan, K.-W., et al. 2007, PASJ, 59, 9
- Shi et al. (2002) Shi, J. R., Zhao, G., & Chen, Y. Q. 2002, A&A, 381, 982
- Simionescu et al. (2007) Simionescu, A., Werner, N., Finoguenov, A., Böhringer, H., & Brüggen, M. 2007, A&A submitted, (astro-ph/0709.4499)
- Smith et al. (2001) Smith, R. K., Brickhouse, N. S., Liedahl, D. A., & Raymond, J. C. 2001, ApJ, 556, L91
- Tamura et al. (2001) Tamura, T., Bleeker, J. A. M., Kaastra, J. S., Ferrigno, C., & Molendi, S. 2001, A&A, 379, 107
- Tamura et al. (2004) Tamura, T., Kaastra, J. S., den Herder, J. W. A., Bleeker, J. A. M., & Peterson, J. R. 2004, A&A, 420, 135
- Townsley et al. (2002) Townsley, L. K., Broos, P. S., Nousek, J. A., & Garmire, G. P. 2002, Nucl. Instr. Meth. Phys. Res. A, 486, 751
- Vikhlinin et al. (2005) Vikhlinin, A., Markevitch, M., Murray, S. S., et al. 2005, ApJ, 628, 655
- Werner et al. (2006a) Werner, N., Böhringer, H., Kaastra, J. S., et al. 2006a, A&A, 459, 353
- Werner et al. (2006b) Werner, N., de Plaa, J., Kaastra, J. S., et al. 2006b, A&A, 449, 475
- White et al. (1994) White, III, R. E., Day, C. S. R., Hatsukade, I., & Hughes, J. P. 1994, ApJ, 433, 583
- Woosley & Weaver (1995) Woosley, S. E. & Weaver, T. A. 1995, ApJS, 101, 181
- Xu et al. (2002) Xu, H., Kahn, S. M., Peterson, J. R., et al. 2002, ApJ, 579, 600