Application of information and complexity theories to public opinion polls. The case of Greece (2004-2007).
Abstract
A general methodology to study public opinion inspired from information and complexity theories is outlined. It is based on probabilistic data extracted from opinion polls. It gives a quantitative information-theoretic explanation of high job approval of Greek Prime Minister Mr. Constantinos Karamanlis (2004-2007), while the same time series of polls conducted by the company Metron Analysis showed that his party New Democracy (abbr. ND) was slightly higher than the opposition party of PASOK -party leader Mr. George Papandreou. It is seen that the same mathematical model applies to the case of the popularity of President Clinton between January 1998 and February 1999, according to a previous study, although the present work extends the investigation to concepts as complexity and Fisher information, quantifying the organization of public opinion data.
1 Introduction
Public opinion expressed in results of elections and opinion polls have been studied widely using traditional statistics. An alternative approach is information theory, which can be applied to probabilistic data. Electoral data can be easily transformed from percentages to probabilities. Thus the use of information theory to investigate public opinion about political parties and the conduct of governments and its opposition is obvious, but has not been carried out so far. Such an application, the only one to our knowledge, is an analytical approach to interpret the public’s high job approval rating for president Clinton [1]. This rating has been high and nearly constant between January 1998 and February 1999, despite the well known unfavorable conditions for the US president in that period. Such a high rating could be explained partially, but is still considered unusual for several reasons [1]. The political situation in Greece in the recent three years is completely different than the United States of the years 1998-1999. However, an interesting (parallel) question arises: Greek Prime Minister Karamanlis enjoyed a high job approval (2004-2007), although his party New Democracy approval by the public was just higher than the opposition party PASOK, headed by George Papandreou. We note that we used statistical data from a specific Greek opinion polls company (Metron Analysis) in the period 2004-2007, stopping just three months before the latest parliament elections in Greece (September 2007). It is of interest to try to clarify the above striking fact by extending the usual statistical treatment to Shannon’s information theory [2]. Information theory was used for the first time in telecommunications in the late 40’s. Our aim is to investigate the possibility to extract some general, qualitative conclusions from typical opinion polls in Greece, employing the tools of information and complexity theories. As we mentioned above, our inspiration comes from a similar study in the United States. Although the political systems and the conditions in the USA and Greece are very different, our work leads to the same mathematical model. It is seen that information-theoretic methods can be used to extend the results of usual statistics, which illuminate certain statistical data of public opinion. Information theory can proceed further towards an interpretation, in some sense, of statistical processes. The use of the logarithm in the definition of information entropy smooths small differences in statistical data from various companies and yields the same qualitative conclusions. This illustrates the strength of information theory to give quantitative (numerical) answers to qualitative questions.
2 Elements of Information Theory
Specifically information entropy , corresponding to a probability distribution of events occuring with probabilities , respectivelly, can be defined as
| (1) |
is an information theoretic quantity which takes into account all the moments of a probability distribution and can be considered, in a sense, superior to traditional statistics employing the well-known quantities of average value and variance. in relation (1) is measured in bits (if the base of logarithm is 2), nats–natural units of information (if the base is e) and Hartleys (if the base is 10). In the present paper the base is 10, for the sake of comparison with [1]. However, one case can be transformed to the other one, by multiplying with just a constant.
Definition (1) represents the average information content of an event, which occurs with a specific probability distribution . The use of the logarithm is justified because in such a way obeys certain mathematical and intuitive properties expected from a quantity related to information content of a probability function. Specifically, is positive and the joint information content of two simultaneous independent events translate to the addition of the corresponding information measures of each event e.t.c. For more properties and a pedagogical description see [2].
is maximum for an equiprobable or uniform probability distribution , i.e. . is minimum when one of the ’s is 1 () and all the other ’s are 0, i.e. , under the convention that . In this case, one of the outcomes is certain, while all the other ones are impossible to occur.
represents a measure of information content of a probabilistic event, i.e. the average number of ”Yes” or ”No” questions needed to specify the event (in the case of bits). is reciprocal to the degree of surprise of an event, i.e. the least probable event has the most information and vice versa.
We give a simple example in order to understand the meaning of relation (1). Let us ask to a certain number of people the following question: Is C. Karamanlis suitable for the position of Prime Minister of Greece? We receive answers with percentages and corresponding probabilities (Yes), (No), (Something Else). A direct application of (1) for the normalized probability distribution , where () gives the information content in Hartleys of that set of probabilities.
In the case of a uniform (equiprobable) distribution i.e. , relation (1) gives . This is the maximum information entropy with uniform probability distribution (). This can be interpreted as a distribution of complete ignorance (unbiased) in the sense that a specific answer does not contain more information than any other one. A case of maximum entropy corresponds to a minimum amount of information about our question. Thus information , is reciprocal with
| (2) |
The above convention agrees with our intuition, i.e. the information content of an event corresponding to a probability distribution can be quantified by the magnitude of our surprise after the event has occurred or how unpredictable is the outcome.
The case of equiprobable distribution for , i.e. occurred in the recent general parliament elections in Italy (April 2006). There were two large coalition of parties and one of the coalitions won with a slight difference in votes, about 40,000 -while the number of votes was about 40,000,000. Thus, with real results versus , we can consider with a very satisfactory approximation that . The application of information theory in this case gives bit (base of the logarithm equals 2). This fact is completely equivalent with throwing a fair coin (equal probability for the two results heads-tails) or with the question Yes-No (equiprobable) which coalition will win. That means that gives and the minimum information can be interpreted as a complete homogenization of the public opinion about the two coalitions. In other words, the results of elections in Italy correspond to the random throw of a fair coin i.e. a complete lack of knowledge of the voters. Our observation does not intend to depreciate the process of elections, the culmination of democracy, but it is an extreme case with maximum possible information entropy .
There are other measures of information such as Onicescu’s information energy [3] and Fisher’s information [4]. Shannon’s information is a global measure, while Fisher’s is a local one i.e. does not depend on the ordering of the probabilities , while does depend, due to the existence of the derivative of the distribution in its definition.
Their definitions are given below together with appropriate comments. It is stressed that all are based on the same probability distributions as .
Disorder is a normalized disorder (). (zero disorder, ) corresponds to complete order and (complete disorder, ) corresponds to zero order . enable us to study the organization of data, described probabilistically.
The next important step is the statistical complexity
| (5) |
defined by Shiner-Davison-Landsberg (SDL) [6], where is the strength of disorder and is the strength of order. In the present work we consider the simple case and .
Another measure of complexity is
| (6) |
according to Lopez Ruiz-Mancini-Calbet (LMC) [7]. Here is the so-called disequilibrium (or distance from equilibrium) defined as
| (7) |
SDL complexity describes correctly the two extreme cases of complete order and complete disorder, where we expect intuitively zero complexity or organization of the data. An example taken from the physical world is illuminating. A perfect crystal (complete order) has and the same holds for a gas (complete disorder) where as well. Thus (perfect) crystals and gases are not interesting, lacking complexity or organization. This is given by and agrees with intuition. Instead, for the information entropy we have for crystals and for gases, which is not satisfactory.
Thus extending from physics, , , and enable us to study quantitatively the (organized) complexity of probabilistic data of opinion polls and elections.
An other very important information measure is Fisher information [4]. Recently, there is a revival of interest for Fisher information, culminating in two books [8] and [9], defined as
| (8) |
for a continuous probability distribution , which is modified accordingly in the present work for discrete probability distributions. Specifically, for a discrete probability distribution employed in the present work, relation (8) becomes
| (9) |
Thus the treatment of high job approval of Clinton in [1], will be repeated for the case of the Greek Prime Minister Constantinos Karamanlis and the Greek political scene in the recent three years (2004-2007) and extended in the present paper using new quantities e.g. , , , and as functions of time.
3 Results and Discussion
We used statistical data for the public opinion coming from the Greek opinion polls company Metron Analysis333http://www.metronanalysis.gr. Specifically, we focused our interest on the following three questions, presented in Table 1.
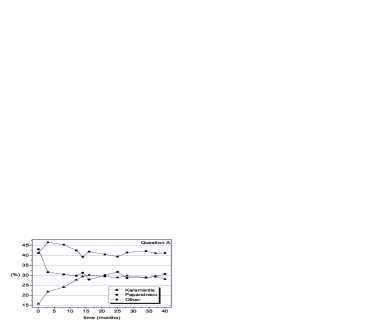
| Question A | Choose a political leader, who is, according to your opinion, most suitable for the position of Prime Minister of Greece. |
|---|---|
| Answers | Karamanlis (), Papandreou (), and Other (). |
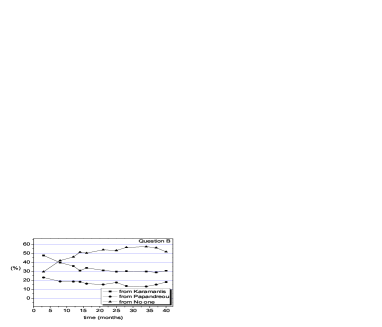
| Question B | Are you satisfied from Mr. Karamanlis or Mr. Papandreou as political leaders? |
| Answers | from Karamanlis (), from Papandreou (), and from No one (). |
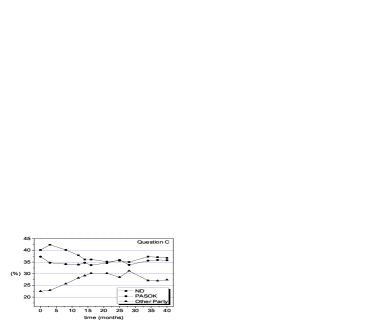
| Question C | Which party you wish to vote for? |
| Answers | New Democracy (abbr. ND) -party leader Karamanlis (), PASOK -party leader Papandreou (), and Other party (). |
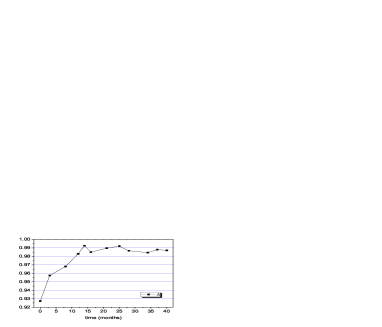
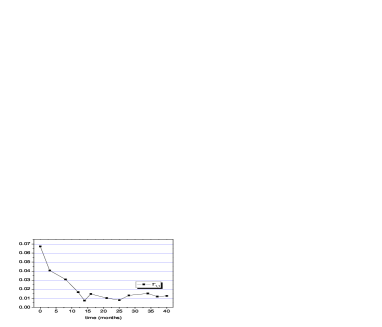
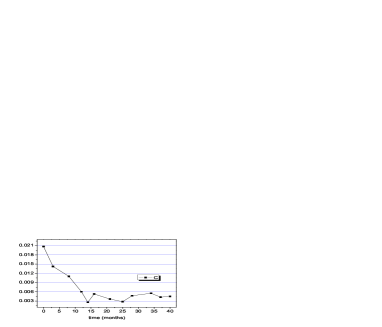
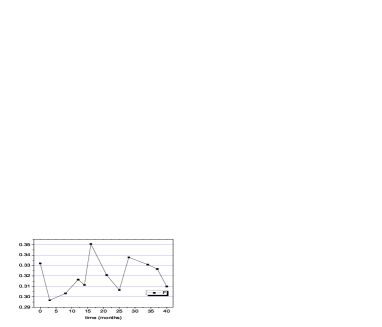
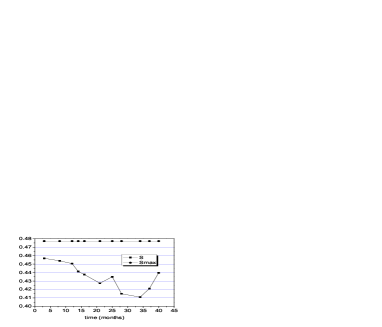
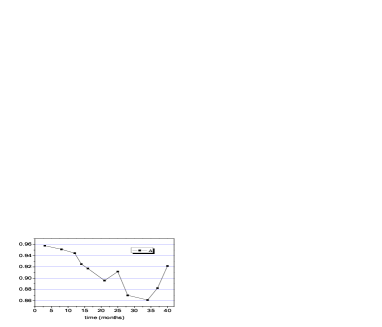
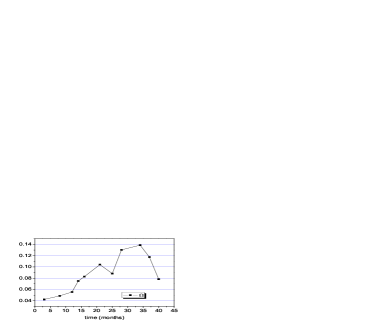
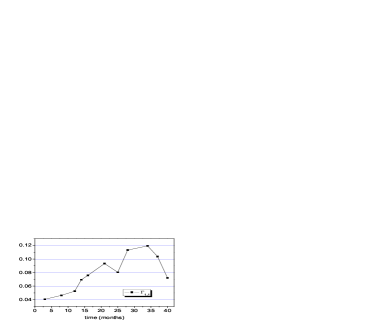
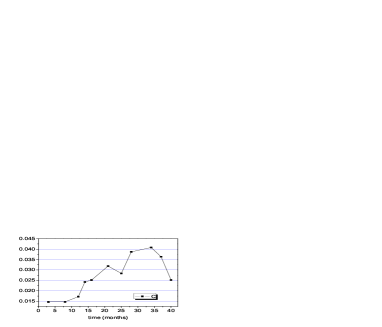
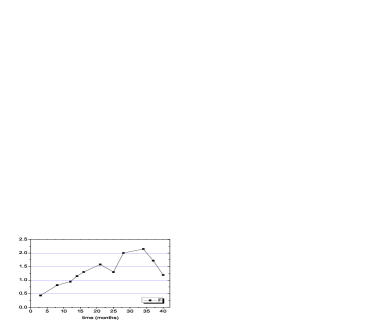
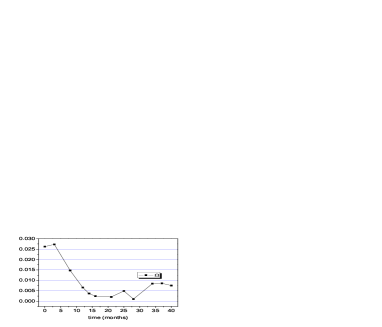
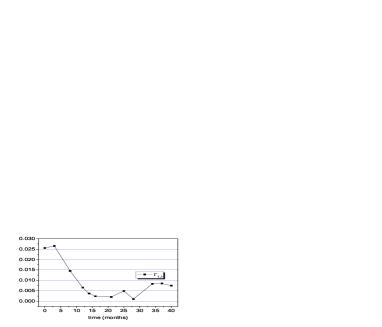
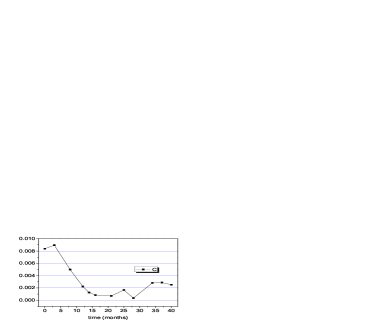
The corresponding answers (as probabilities), asked to a careful chosen number of voters, are shown in the vertical axes of Fig. 1 (for Questions A, B and C, respectively).
In all the figures the horizontal axis represents the time in months, starting from (March 2004) to (June 2007). Time is just before the parliament elections of April 2004 (winner ND) and time is 3 months before the latest elections that took place in September 2007, with another victory for ND.
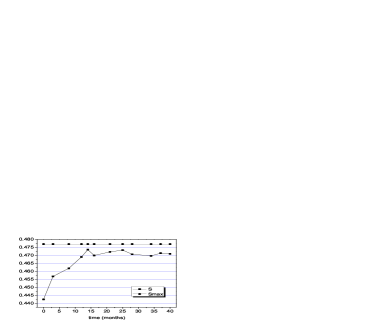
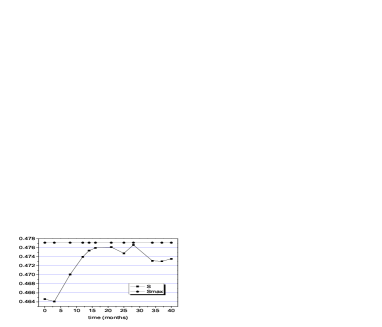
Thus we have three sets of probabilities corresponding to Questions A, B, and C. In Fig. 2 we present and , calculated using (1), from probabilities of Fig. 1 (Question A). We also present disorder and order , calculated from relations (3) and (4). Statistical complexity , complexity and Fisher information are calculated employing relations (5), (6) and (8) and are displayed in Fig. 2 as well.
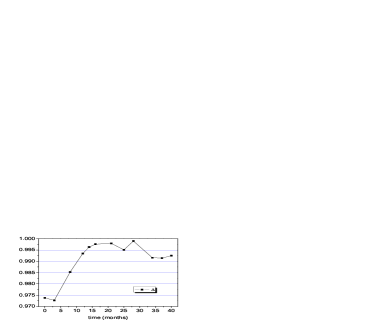
In Fig. 3 we present , , , , and for Question B, while in Fig. 4 we present , , , , and for Question C.
In Question A, the entropy shows an overall increase as function of time and tends to the limit value of Hartleys. Taking into account that the information is reciprocal to the entropy (2), it is seen that the information possessed by the body of voters on how suitable is Mr. Karamanlis, decreases as a function of time. In a sense, Mr. Karamanlis achievement was to compartmentalize and make strongly independent, the opinion of voters for him as a person (high percentages in Question A) compared to their opinion about his party (slightly higher percentage of ND compared with PASOK). The results of the parliament elections in September 2007 (ND-, PASOK-) confirmed the idea of the Mr. Karamanlis’ favorable and dominant profile, despite the major event of the forest fires and the collateral losses during August 2007.
The same trend can be extracted by the other information-theoretic measures with the probabilities of Question A, e.g. the disorder increases while the order decreases. This is a mark that the organization of the statistics of the public opinion decreases.
In Question B entropy as a function of time decreases and there is a global minimum for months (December 2006). After that global minimum it slightly increases, but stays far away from the maximum value. Respectively, order increases and shows a global maximum for the same time ( months), while the behavior of the other information-theoretic measures is analogous.
It is seen from the figures that , , and , although their mathematical definitions are different, show the same trends as functions of time: For Question A all of them decrease with time, while for Question B all increase. The same trend holds for Fisher information , which is reciprocal to and analogous with . It is noted that this is the case for a simple Gaussian probability distribution, as seen in the literature [9]. On the contrary, there is a striking similarity in the behavior of and compared with with and respectively. This can be attributed to the special meaning of Fisher’s information which is a local measure of information as contrasted to Shannon’s global measure. Specifically, changes in or are amplified as seen in the corresponding plots. This is very interesting but however, can be considered as a preliminary result taking into account that the presence of the derivative in the definition of cannot be reflected correctly in a case of a small discrete set of probabilities ().
Here we can make the following comment: If we switch from Question A to Question B, the qualitative behavior of the results changes drastically, it is almost inverse. So, in Question B the information that is available to the public increases (while the corresponding information in Question A decreases) and there is a global maximum (minimum) in December 2006. Thus, we have, from a mathematical (quantitative) point of view, a strong indication that the opinion polls are seriously affected from the formulation of the relevant questions.
The fact that Mr. Karamanlis has a favorable profile based on Question A is escorted by a clearly less favorable profile according to the results of Question B. Completely analogous is the picture of Mr. Papandreou. The satisfaction rate is clearly less than the suitability for Prime Minister rate. The survey concerning president Clinton [1] is based on a classical question about job approval which is definitely more objective (”Do you approve or disapprove of the way [name of president] is handling his job as president?”) and it has been used to US polls since 1930’s.
On the other hand, the question about the suitability of a party leader for the position of the Prime Minister (it has been used in Greek opinion polls, since the mid 1990’s) is less objective. The person who answers the question takes into account extra data not related to a realistic assessment of the job and accomplishments of a party leader. The answers can be affected by factors such as the public image of the leader (the one that he shows and the one that the media advertise). There is more space for expectation or hope that in the future some issues are going to improve or are going to work better, due to special characteristics of the leader, his personality, his abilities etc. Question B about satisfaction is more realistic but still is general and obscure.
Qualitatively, results for Question C are similar with the results of Question A. An interesting remark concerning the available data is that in the time interval between months (March 2005) and months (June 2006), the entropy reaches the maximum value and information practically minimizes. This time interval can be considered as the interim (meantime) between two elections.
A final (extreme) remark seems appropriate in order to demonstrate the difference between the information theory point of view and the classical statistics approach.
Suppose that the majority party achieves a crashing victory over minority, e.g. over . The entropy for this scenario should be bits, while the corresponding maximum value is , so entropy decreases (or equivalently information increases) only by . Thus, in terms of information theory, a fact that is completely clear-cut from the point of view of classical statistics, is not so important to give a complete and fair assessment of the public opinion. This has been outlined in [1] as well.
It is obvious that information theory can serve as a useful tool even for politics surveys, with more details than the present work. Something that so far has not been done systematically.
Acknowledgements
The authors would like to thank Mr. Pantelis Savvidis (director of the newspaper Macedonia of Thessaloniki) and Mr. Dimitris Katsantonis (executive of the Metron Analysis for Thessaloniki) for providing the data.
 |
 |
 |
 |
 |
 |
 |
 |
 |
 |
 |
 |
 |
 |
 |
 |
 |
 |
 |
 |
 |
References
- [1] R.G. Kulkarni, R.R. Stough, and K.E. Haynes, Entropy 1, 37 (1999).
- [2] C.E. Shannon, Bell Syst. Tech. 27, 379 (1948); ibid. 27 623 (1948).
- [3] O. Onicescu, C. R. Acad. Sci. Paris A263, 25 (1966); O. Onicescu and V. Stefanescu, Elements of Informational Statistics with Applications (Bucharest, 1979).
- [4] R.A. Fisher, Proc. Cambridge Phil. Sec. 22, 700 (1925).
- [5] P.T. Landsberg and J. Shiner, Phys. Lett. A 245, 228 (1998).
- [6] J.S. Shiner, M. Davison, and P.T. Landsberg, Phys. Rev. E 59, 1459 (1999).
- [7] R. Lopez-Ruiz, H.L. Mancini, and X. Calbet, Phys. Lett. A 209, 321 (1995).
- [8] R. Frieden, Science from Fisher Information, (Cambridge Univ. Press, 2004).
- [9] B.R. Frieden and R.A. Gatenby, eds. Exploratory Data Analysis using Fisher Information (Springer-Verlag; Berlin 2007)