Observations of Dense Molecular Gas in a Quasar Host Galaxy at =6.42: Further Evidence for a Non-Linear Dense Gas – Star Formation Relation at Early Cosmic Times
Abstract
We report a sensitive search for the HCN(=21) emission line towards SDSS J114816.64+525150.3 (hereafter: J1148+5251) at =6.42 with the Very Large Array (VLA). HCN emission is a star formation indicator, tracing dense molecular hydrogen gas (cm-3) within star-forming molecular clouds. No emission was detected in the deep interferometer maps of J1148+5251. We derive a limit for the HCN line luminosity of K km s-1pc2, corresponding to a HCN/CO luminosity ratio of /0.13. This limit is consistent with a fraction of dense molecular gas in J1148+5251 within the range of nearby ultraluminous infrared galaxies (ULIRGs; median value: /=0.17) and HCN-detected 2 galaxies (0.17). The relationship between and is considered to be a measure for the efficiency at which stars form out of dense gas. In the nearby universe, these quantities show a linear correlation, and thus, a practically constant average ratio. In J1148+5251, we find /6600. This is significantly higher than the average ratios for normal nearby spiral galaxies (/=580) and ULIRGs (740), but consistent with a rising trend as indicated by other 2 galaxies (predominantly quasars; 1525). It is unlikely that this rising trend can be accounted for by a contribution of active galactic nucleus (AGN) heating to alone, and may hint at a higher median gas density and/or elevated star-formation efficiency toward the more luminous high-redshift systems. There is marginal evidence that the / ratio in J1148+5251 may even exceed the rising trend set by other 2 galaxies; however, only future facilities with very large collecting areas such as the Square Kilometre Array (SKA) will offer the sensitivity required to further investigate this question.
Subject headings:
galaxies: active, starburst, formation, high redshift — cosmology: observations — radio lines: galaxies1. Introduction
High redshift galaxy populations are now being detected back to 780 million years after the Big Bang (spectroscopically confirmed: =6.96; Iye et al. 2006), probing into the epoch of cosmic reionization (e.g., Fan et al. 2006; Hu & Cowie 2006). Many of these very distant galaxies show evidence for star formation activity (e.g., Taniguchi et al. 2005). Some are even found to be hyperluminous infrared galaxies (HLIRGs; Bertoldi et al. 2003a; Wang et al. 2007) with far-infrared (FIR) luminosities exceeding 1013 , suggesting vigorous star formation and/or AGN activity. To probe the earliest stages of galaxy formation and the importance of AGN in this process, it is necessary to study the star formation characteristics of these galaxies.
A good diagnostic to examine the star-forming environments in distant HLIRGs are observations of molecular gas, the fuel for star formation. The by far brightest and most common indicator of molecular gas in galaxies is line emission from the rotational transitions of carbon monoxide (CO), which was detected in 40 galaxies at high redshift (1; see Solomon & Vanden Bout 2005 for a review). These observations have revealed molecular gas reservoirs with masses of 1010 in these galaxies, even in the highest redshift quasar known, J1148+5251 at =6.42 (Walter et al. 2003, 2004; Bertoldi et al. 2003b).
Although CO is a good tracer of the total amount of molecular gas in a galaxy, due to the relatively low critical density of cm-3 required to collisionally excite its lower transitions, it is not a reliable tracer of the dense molecular cloud cores where the actual star formation takes place. Recent studies of nearby actively star-forming galaxies have shown that hydrogen cyanide (HCN) is a far better tracer of the dense ( cm-3) molecular gas where stars actually form (e.g. Gao & Solomon 2004a, 2004b, hereafter: GS04a, GS04b). In the local universe it was found that the HCN luminosity () scales linearly (unlike ) with the FIR luminosity () over 7–8 orders of magnitude, ranging from Galactic dense cores to ULIRGs (Wu et al. 2005). As traces the massive star formation rate (unless AGN heating is significant), this implies that HCN is also a good tracer of star formation.
HCN has now also been detected in five galaxies at 2 (Solomon et al. 2003; Vanden Bout et al. 2004; Carilli et al. 2005, hereafter: C05; Wagg et al. 2005; Gao et al. 2007, hereafter: G07). Adding a number of upper limits obtained for other high- galaxies, these observations indicate that the more luminous, higher redshift systems systematically deviate from the linear – correlation found in the local universe (G07), and hint at a rising slope of the relation toward high and/or . To further investigate this apparent non-linear, rising trend, our aim has been to extend the range of existing HCN observations beyond redshift 6 and to higher .
In this letter, we report sensitive VLA111The Very Large Array is a facility of the National Radio Astronomy Observatory, operated by Associated Universities, Inc., under cooperative agreement with the National Science Foundation. observations of HCN(=21) emission toward the =6.42 quasar J1148+5251, the highest redshift source detected in CO. A previous, less sensitive search for HCN(=21) emission in this source has yielded no detection (C05). We use a concordance, flat CDM cosmology throughout, with =71 km s-1 Mpc-1, =0.27, and =0.73 (Spergel et al. 2007).
2. Observations
We observed the HCN(=21) transition line (GHz) toward J1148+5251 using the VLA in D configuration in 10 tracks on 2004 June 21 and 26 (these observations were discussed by C05), and between 2007 May 01 and 13. At the target redshift of 6.419, the line is shifted to 23.892873 GHz (11.96 mm). The total integration time amounts to 80 hr. Observations were performed in fast-switching mode using the nearby source 11534+49311 (at distance to J1148+5251) for secondary amplitude and phase calibration. Observations were carried out under very good weather conditions with 26 antennas [including 9 Expanded Very Large Array (EVLA) antennas in 2007]: the phase stability was excellent (typically 15∘ phase rms for the longest baselines). The QSO 3C286 was observed as a primary flux calibrator. The resulting flux scale is accurate within the standard 15% uncertainty.
In 2004, two 25 MHz wide intermediate frequency bands (IFs) with seven 3.125 MHz channels each were observed simultaneously, one centered at the HCN(=21) line frequency (23.8929 GHz), and one centered at 24.0430 GHz for continuum monitoring222In fact, this is the center frequency of the HCO+(=21) line, which however was not detected. Neither was the continuum.. This leads to an effective bandwidth of 21.875 MHz for both the line and continuum observations, corresponding to 274 km s-1 at 23.9 GHz. For lines as broad as CO (279 km s-1 FWHM; Bertoldi et al. 2003b), this setup would miss only 15% flux in the line wings. In 2007, observations were carried out in continuum mode, with one 25 MHz wide IF centered at the HCN(=21) line frequency (23.8929 GHz), and one 50 MHz wide IF centered at 23.7649 GHz to monitor the source’s continuum333This frequency avoids other potentially bright emission lines near the HCN(=21) frequency, such as HCO+(=21), HNC(=21), and C2H(=21)..
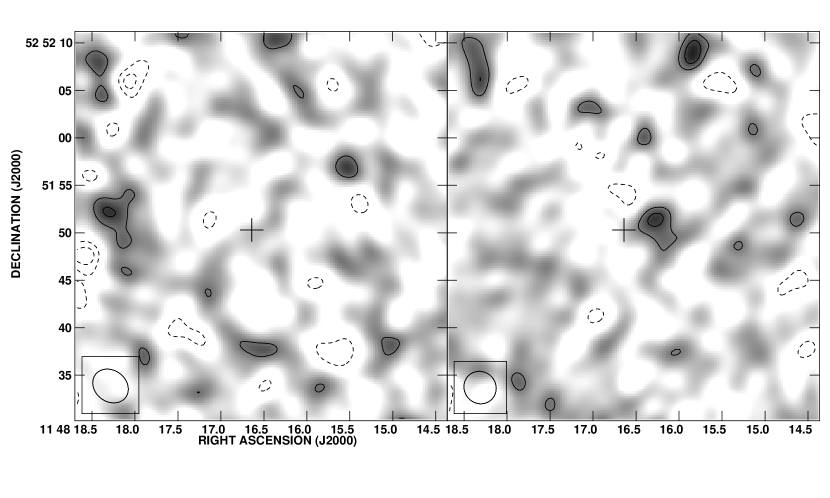
For data reduction and analysis, the package was used. All data were mapped using the CLEAN algorithm and ‘natural’ weighting; this results in synthesized beams of 4.0 ′′3.3 ′′ for the line map and 3.5 ′′3.3 ′′ (20 kpc at ) for the continuum map (see Fig. 1). The final rms in the integrated HCN(=21) line map is 15 Jy beam-1, and 14 Jy beam-1 in the continuum map. Averaging both uv datasets to a ‘high-sensitivity’ continuum map leads to an rms of 11 Jy beam-1.
3. Results
No HCN(=21) emission is detected in J1148+5251 (Fig. 1, left). We derive a peak flux density of (7 15) Jy beam-1 at the source’s CO position (see Table 2), setting an upper limit444In this letter, we quote 2 limits; however, note that all conclusions hold for 3 limits. of 30 Jy to the emission line peak flux. No continuum emission is detected at and/or close to the HCN(=21) line frequency (Fig. 1, right). From the ‘high-sensitivity’ continuum map, we derive a peak flux density of (11 11) Jy beam-1 at the source’s position, setting an upper limit of 22 Jy to the 23.9 GHz continuum flux density. This is consistent with the model-predicted continuum level of 8 Jy (Beelen et al. 2006).
From our observations, we derive a limit to the HCN(=21) line luminosity of K km s-1 pc2 (assuming a HCN/CO linewidth ratio of 0.67, i.e., the average value for the four 2 HCN-detected quasars555This ratio lies between 57% and 80% for the 2 sample, but is up to 100% in nearby starburst galaxies like NGC 253 (e.g., Knudsen et al. 2007).; see Table 4 for references), corresponding to 13% of the CO luminosity (Walter et al. 2003). Using the FIR luminosity derived by Beelen et al. (2006)666FIR luminosities estimated from modeling the sparsely sampled FIR SEDs of high- galaxies are only accurate within a factor of 2., we find /6600.
4. Analysis
The nondetection of HCN(=21) in J1148+5251 at the depth of our observations has several implications. For the following comparison with other galaxies (for which and are given in the ground-state transitions), we assume that the HCN(=21) and CO(=32) lines are thermalized, so that = and =. Considering the high CO excitation in this source (Bertoldi et al. 2003b) and the fact that both lines arise from low transitions, this is likely a valid assumption.
| Source | / | / | Refs. |
|---|---|---|---|
| [/] | |||
| SDSS J1148+5251 | 6600 | 0.13 | 1,2,3 |
| Cloverleaf | 1305360 | 0.100.02 | 4,5,6 |
| IRAS F10214+4724 | 2835855 | 0.180.05 | 7,8,9 |
| VCV J1409+5628 | 2615860 | 0.090.03 | 9,10,3 |
| APM 08279+5255aa We adopt the extrapolated HCN(=10) luminosity from Weiß et al. (2007), derived by assuming collisional excitation only (uncertainties are model-dominated). Also, we only consider the ‘cold, dense’ gas and dust component in their model, which is assumed to give rise to the HCN emission. | 1000 | 0.27 | 11,12,13 |
| SMM J16359+6612 | 1550550 | 0.180.04 | 14,15,16 |
| avg. ‘normal’ spiral (33) | 580 | 0.04 | 17,14 |
| avg. 0 LIRG (23) | 650 | 0.07 | 17,14 |
| avg. 0 ULIRG (9) | 740 | 0.17 | 17,14 |
| avg. 0 ‘all’ (33+23+9) | 680 | 0.05 | 17,14 |
| avg. 2 galaxy (5) | 1525 | 0.17 | 4–16 |
References. — [1] This work, [2] Walter et al. (2003), [3] Beelen et al. (2006), [4] Solomon et al. (2003), [5] Weiß et al. (2003), [6] Riechers et al. (2006a), [7] Vanden Bout et al. (2004), [8] D. Downes & P. M. Solomon, in prep., [9] Carilli et al. (2005), [10] Beelen et al. (2004), [11] Wagg et al. (2005), [12] Riechers et al. (2006b), [13] Weiß et al. (2007), [14] Gao et al. (2007), [15] Kneib et al. (2005), [16] Kneib et al. (2004), [17] Gao & Solomon (2004b).
Note. — Line luminosity unit is =K km s-1 pc2. Bracketed numbers are sample sizes (‘all’ corresponds to the full Gao & Solomon sample). For the averaged samples, median values and 1 statistical errors of the cumulative distribution are given. Where not quoted in the literature, 25% error are assumed for .
4.1. ‘Dense Gas Fraction’: The / Ratio
CO(=10) emission is considered a good tracer for the total amount of molecular gas in a galaxy, while HCN(=10) emission is considered a good tracer for the dense peaks of the molecular mass distribution. The / ratio thus is considered a measure for the dense fraction of molecular gas in a galaxy777We note that Graciá-Carpio et al. (2006) have questioned the validity of / as a tracer of the dense gas fraction.. On average, this ratio is about four to five times higher in local ULIRGs compared to normal, nearby spiral galaxies [median value of 0.17 (ULIRGs) vs. 0.04 (spirals); see Table 4]. However, there does not appear to be a further increase toward the even more FIR-luminous systems at 2 (0.17 on average) within the statistical uncertainties (all values rederived from GS04ab; G07). The upper limit for / in J1148+5251 is 0.13, placing it below the median but within the range of values measured for ULIRGs and 2 galaxies (Fig. 2a). Our observations thus confirm the finding of G07 that galaxies brighter than =1012 appear to have a higher fraction of dense molecular gas than normal spiral galaxies; however, there is no indication that this fraction rises further toward the highest , or that it changes with redshift.
4.2. ‘Star Formation Law’: The / Ratio
The FIR luminosity is thought to originate dominantly from dust-reprocessed light of young massive stars, and thus to be a good tracer of the star-formation rate (SFR) in a galaxy. Star formation in galaxies takes place in dense molecular clouds that are traced well by HCN emission, resulting in a linear correlation between the FIR and HCN luminosities (Wu et al. 2005). However, G07 have found a mild increase of / with increasing FIR luminosity between normal spiral galaxies and ULIRGs [/=580 (spirals) vs. 740 (ULIRGs) on average; see Table 4]. This trend appears to get stronger toward the even more FIR-luminous 2 systems (/=1525 on average). The lower limit of /6600 obtained for J1148+5251 is consistent with such a rising trend toward high- systems, and extends it toward higher redshift (Fig. 2b). Due to the fact that the high- sources also have systematically higher than the nearby galaxies, it remains unclear whether we observe a rising trend with redshift or with (Fig. 2c), or both.

5. Discussion
5.1. Median Gas Density and Star Formation Efficiency
Krumholz & Thompson (2007) argue that / is expected to be higher for galaxies with a median (molecular) gas density close to or higher than the critical density required for excitation of the observed HCN transition than for galaxies with lower . In their case, they define star formation efficiency as the fraction of the mass that is converted into stars per dynamical time of the system. Note that this is different than the star formation rate per unit total gas mass. They argue that the non-linear relation between and (e.g., Kennicutt 1998a, 1998b; GS04b; Riechers et al. 2006b) arises due to the fact that CO traces all gas. The star-formation rate is then dictated by the density divided by the free-fall time (), giving the standard Schmidt-law: star formation rate , or 1.5. For molecules like HCN, which only trace the small fraction of dense gas clouds directly associated with star formation in normal galaxies, is roughly fixed by . Hence the star formation rate shows a linear relationship with , or 1.0. However, in extreme galaxies, where in the molecular ISM approaches , again becomes relevant (i.e., HCN emission no longer selects just the rare, dense peaks whose density is fixed by , but instead traces the bulk of the ISM, whose density can vary from galaxy to galaxy, and thus the variation of and re-enter the calculation), and the relationship approaches 1.5 (and ). Interestingly, current data show a marginal trend for a changing power-law index at the highest luminosities of the type proposed by Krumholz & Thompson. This change in power-law index from 1 to 1.5 would suggest that, in these extreme luminosity systems, approaches . More systems at high luminosity are required to confirm this trend of changing power-law index.
5.2. The Role of AGN Heating for
Like most of the 2 HCN-detected sources, J1148+5251 is a quasar. It has been found that, even for such strong AGN galaxies, the bulk of is likely dominatly heated by star formation in most cases (e.g., Carilli et al. 2001; Omont et al. 2001; Beelen et al. 2006; Riechers et al. 2006b). However, based on radiative transfer models of the dust SED of J1148+5251, Li et al. (2007) argue that this source may currently undergo a ‘quasar phase’, in which AGN heating of the hot and warm dust contributes significantly to . If correct, this may be an alternative explanation for the elevated / in this galaxy. The (rest-frame) IR properties (tracing emission from hot dust) of J1148+5251 are similar to those of other 6 quasars with much lower (tracing emission from warm dust), and even to local quasars (Jiang et al. 2006). This supports the assumption that the hot dust in J1148+5251 is dominantly heated by the AGN; however, the lack of a correlation between and in quasars indicates that the warm dust may still be dominantly heated by star formation. Moreover, J1148+5251 follows the radio-FIR correlation for star-forming galaxies (Carilli et al. 2004), which also suggests a starburst origin for the dominant fraction of .
Furthermore, one of the 2 HCN detections and some of the meaningful limits are submillimeter galaxies without a known luminous AGN, but are still offset from the local / relation. It thus appears unlikely that AGN heating alone can account for the higher average / in the high- galaxy sample.
5.3. Implications for Future Studies
Even when assuming the highest / of 2835 found among all HCN-detected galaxies in Table 4, the depth of our observations is sufficient to detect a galaxy with the redshift and of J1148+5251 (=6.42) in HCN emission at a signal-to-noise ratio of 4.5. To first order, our lower limit thus is consistent with previous suggestions (G07) that / ratios in high redshift sources lie systematically above those for nearby galaxies. The scatter around this trend is still significant, and will primarily be improved by increasing the number of HCN-detected galaxies at high . In addition, it will be important to improve on the main sources of error for the individual high- detections (e.g., signal-to-noise limited HCN/CO linewidth ratio, accuracy of the FIR SED fit, AGN bias of ). The statistical and individual results, so far, would even be consistent with an even stronger increase in / toward the highest and/or . Our study of J1148+5251 may hint at such an effect. Clearly, it is desirable to obtain more sensitive observations of this source to further investigate this issue. Due to its superior collecting area and high calibrational stability, the VLA is ideally suited for such a sensitive study. Although J1148+5251 is the most CO- and FIR-luminous 6 galaxy known, 80 hr of VLA observations were necessary to obtain the current limit. In a favourable case, the HCN(=21) line may have a strength of about 1.5 times the current rms. To obtain a solid 5 detection of such a line, of order 1000 hr of observations with the VLA would be required. Due to improved receivers and antenna performance, the fully operational EVLA will be by a factor of two more sensitive to spectral lines of several 100 km s-1 width (such as in J1148+5251), but will still require long integration times. Studies of dense gas at 6 thus appear to require an order of magnitude increase in collecting area, such as offered by future facilities like the SKA phase I demonstrator (e.g., Carilli 2006), which can serve as a low frequency counterpart to the Atacama Large Millimeter/submillimeter Array (ALMA).
References
- Beelen et al. (2004) Beelen, A., Cox, P., Pety, J., et al. 2004, A&A, 423, 441
- Beelen et al. (2006) Beelen, A., Cox, P., Benford, D. J., et al. 2006, ApJ, 642, 694
- Bertoldi et al. (2003a) Bertoldi, F., Carilli, C. L., Cox, P., et al. A&A, 406, L55
- Bertoldi et al. (2003b) Bertoldi, F., Cox, P., Neri, R., et al. 2003b, A&A, 409, L47
- Carilli et al. (2001) Carilli, C. L., Bertoldi, F., Rupen, M. P., et al. 2001, ApJ, 555, 625
- Carilli et al. (2004) Carilli, C. L., Walter, F., Bertoldi, F., et al. 2004, AJ, 128, 997
- Carilli et al. (2005) Carilli, C. L., Solomon, P. M., Vanden Bout, P. A., et al. 2005, ApJ, 618, 586 [C05]
- Carilli (2006) Carilli, C. L. 2006, SKA memo 70
- Fan et al. (2006) Fan, X., Carilli, C. L., & Keating, B. 2006, ARA&A, 44, 415
- Gao & Solomon (2004a) Gao, Y., & Solomon, P. M. 2004a, ApJS, 152, 63 [GS04a]
- Gao & Solomon (2004b) Gao, Y., & Solomon, P. M. 2004b, ApJ, 606, 271 [GS04b]
- Gao et al. (2007) Gao, Y., Carilli, C. L., Solomon, P. M., & Vanden Bout, P. A. 2007, ApJ, 660, L93 [G07]
- Graciá-Carpio et al. (2006) Graciá-Carpio, J., García-Burillo, S., Planesas, P., & Colina, L. 2006, ApJ, 640, L135
- Hu & Cowie (2006) Hu, E. M., & Cowie, L. L. 2006, Nature, 440, 1145
- Iye et al. (2006) Iye, M., et al. 2006, Nature, 443, 186
- Jiang et al. (2006) Jiang, L., Fan, X., Hines, D. C., et al. 2006, AJ, 132, 2127
- Kennicutt (1998a) Kennicutt, R. C. 1998a, ApJ, 498, 541
- Kennicutt (1998b) Kennicutt, R. C. 1998b, ARA&A, 36, 189
- Kneib et al. (2004) Kneib, J.-P., van der Werf, P. P., Knudsen, K. K., et al. 2004, MNRAS, 349, 1211
- Kneib et al. (2005) Kneib, J.-P., Neri, R., Smail, I., et al. 2005, A&A, 434, 819
- Knudsen et al. (2007) Knudsen, K. K., Walter, F., Weiss, A., Bolatto, A., Riechers, D. A., & Menten, K. 2007, ApJ, 666, 156
- Krumholz & Thompson (2007) Krumholz, M. R., & Thompson, T. A. 2007, ApJ, in press (arXiv:0704.0792)
- Li et al. (2007) Li, Y., Hopkins, P. F., Hernquist, L., et al. 2007, ApJ, submitted (arXiv:0706.3706)
- Omont et al. (2001) Omont, A., Cox, P., Bertoldi, F., et al. 2001, A&A, 374, 371
- Riechers et al. (2006a) Riechers, D. A., Walter, F., Carilli, C. L., et al. 2006a, ApJ, 645, L13
- Riechers et al. (2006b) Riechers, D. A., Walter, F., Carilli, C. L., et al. 2006b, ApJ, 650, 604
- Solomon et al. (2003) Solomon, P., Vanden Bout, P., Carilli, C., & Guelin, M. 2003, Nature 426, 636
- Solomon & Vanden Bout (2005) Solomon, P. M., & Vanden Bout, P. A. 2005, ARA&A, 43, 677
- Spergel et al. (2007) Spergel, D. N., Bean, R., Doré, O., et al. 2007, ApJS, 170, 377
- Taniguchi et al. (2005) Taniguchi, Y., Ajiki, M., Nagao, T., et al. 2005, PASJ, 57, 165
- Vanden Bout et al. (2004) Vanden Bout, P., Solomon, P., & Maddalena, R. 2004, ApJ, 614, L97
- Wagg et al. (2005) Wagg, J., Wilner, D. J., Neri, R., Downes, D., & Wiklind, T. 2005, ApJ, 634, L13
- Walter et al. (2003) Walter, F., Bertoldi, F., Carilli, C. L., et al. 2003, Nature, 424, 406
- Walter et al. (2004) Walter, F., Carilli, C., Bertoldi, F., et al. 2004, ApJ, 615, L17
- Wang et al. (2007) Wang, R., Carilli, C. L., Beelen, A., et al. 2007, AJ, 134, 617
- Weiss et al. (2003) Weiß, A., Henkel, C., Downes, D., & Walter, F. 2003, A&A, 409, L41
- Weiss et al. (2007) Weiß, A., Downes, D., Neri, R., et al. 2007, A&A, 467, 955
- Wu et al. (2005) Wu, J., Evans II, N. J., Gao, Y., Solomon, P. M., Shirley, Y. L., & Vanden Bout, P. A. 2005, ApJ, 635, L173