Properties and geoeffectiveness of halo CMEs
Abstract
Halo coronal mass ejections (HCMEs) originating from regions close to the center of the Sun are likely to be geoeffective. Assuming that the shape of HCMEs is a cone and they propagate with constant angular widths and velocities, at least in their early phase, we have developed a technique (Michalek et al. 2003) which allowed us to obtain the space speed, width and source location. We apply this technique to obtain the parameters of all full HCMEs observed by the Solar and Heliospheric Observatory (SOHO) mission’s Large Angle and Spectrometric Coronagraph (LASCO) experiment until the end of 2002. Using this data we examine which parameters determine the geoeffectiveness of HCMEs. We show that in the considered period of time only fast halo CMEs (with the space velocities higher than and originating from the western hemisphere close to the solar center could cause the severe geomagnetic storms. We illustrate how the HCME parameters can be used for space weather forecast. It is also demonstrated that the strength of a geomagnetic storm does not depend on the determined width of HCMEs. This means that HCMEs do not have to be very large to cause major geomagnetic storms.
MICHALEK ET AL \titlerunningheadProperties and geoeffectiveness of halo CMEs \authoraddrG. Michale, Astronomical Obsrvatory of Jagiellonian University, Orla 171, Krakow, Poland. (michalek@oa.uj.edu.pl)
1 Introduction
Coronal mass ejections (CMEs) originating from regions close to the central meridian of the Sun and directed toward Earth cause the most severe geomagnetic storms (Gosling, 1993; Kahler, 1992; Webb et al., 2001). Many of these Earth-directed CMEs appear as an enhancement surrounding the occulting disk of coronagraphs. We call them halo CMEs (Howard et al. 1982). The measured properties of CMEs include their occurrence rate, direction of propagation in the plane of the sky, angular width, and speed (e.g. Kahler, 1992; Webb, 2000; St. Cyr et al., 2000, Gopalswamy et al., 2003a; Gopalswamy, 2004; Yashiro et al., 2004). It is well known that the geoffective CMEs originate mostly within a latitude (Gopalswamy et al., 2000a, 2001; Webb et al., 2000, 2001; Wang et al., 2002; Zhang et al. 2003). Srivastava and Venkatakrishan (2002) showed that the initial speed of the CMEs is correlated with the index strength of the geomagnetic storm, although their conclusion was based only on the study of four events. This tendency was also suggested earlier by Gosling et al. (1990) and Tsurutani Gonzalez (1998). On the other hand, Zhang et al. (2003) demonstrated that both slow and fast HCMEs can cause major geomagnetic disturbances. They showed that geoeffective CMEs are more likely to originate from the western hemisphere than from the eastern hemisphere. They also demonstrated a lack of correlation between the size of X-ray associated with a given CME and the importance of geomagnetic storms. Unfortunately, these studies were based on the sky plane speeds of CMEs without consideration of the projection effects. The parameters describing properties of CMEs, especially for HCMEs, are affected by projection effects (Gopalswamy et al., 2000b). Assuming that the shape of HCMEs is a cone and they propagate with constant angular widths and speeds, at least in their early phase of propagation, we have developed a technique (Michalek et al. 2003) which allows us to determine the following parameters: the linear distance of source location measured from the solar disk center, the angular distance of source location measured from the plane of sky, the angular width (cone angle =) and the space velocity of a given HCME. A similar cone model was used recently by Xie et al. (2004) to determine the angular width and orientation of HCMEs.
The present paper is divided into two parts. First, in the Section 2 we applied the cone model (Michalek et al. 2003) to obtain the space parameters of all HCMEs observed by the Solar and Heliospheric Observatory (SOHO) mission’s Large Angle and Spectrometric Coronagraph (LASCO) until the end of 2002. In the Subsection 2.2 a short statistical analysis, based on the derived parameters, of HCMEs is presented (Fig. 1 - Fig. 4). In the Section 3, we use these parameters to identify the most important factors determining geoeffectiveness of HCMEs and how they could be used for space weather forecast (Fig. 5 - Fig. 17)
2 Space parameters of HCMEs
2.1 Data
The list of HCMEs studied in this paper is shown in Table 1. We considered only frontside full (type F) and asymmetric (type A) HCMEs (Gopalswamy et al. 2003b). Only these events could be considered using the technique proposed by Michalek et al. (2003). Full halos are the classical halo CMEs which originate from close the disk center. Asymmetric halos are typically wide, near-limb CMEs, which become halos late in the event. They are different from partial halos. The partial halos never appear around the entire oculting disk, even in LASOC/C3 observations (their width is ). Only frontside events could be potentially geoeffective. The first four columns of Table 1 are from the SOHO/LASCO catalog (date, time of first appearance in the coronagraph field of view, projected speed and position angle of the fastest part of the HCME). Details about the SOHO/LASCO catalog and the method of measurements are described by Yashiro et al. (2004). Parameters and , estimated from the cone model (Michalek et al. 2003), are shown in columns (5), (6), (7), and (8), respectively. It is important to note that for some events, the space velocity determined by this technique could be smaller than the projected speeds reported in the LASCO catalog. This is because the Michalek et al. (2003) technique applies only to the beginning phase of CMEs, whereas the CME catalog gives average speed within the LASCO’s field of view. The model also cannot estimate the parameters for symmetric HCMEs originating very close to the disk center and for limb events appearing as halos on account of deflections of preexisting coronal structures. In column (9) the source locations of the associated H-flares are given. The associated flares were determined using two restrictions. They should originate in the same part of solar disk and set up in the same time as respective CMEs (limit time is about half an hour). To be sure that our determination is correct we checked together EIT and LASCO movies also. It is important to note that localization of solar flares might be slightly shifted with respect to origin of CMEs. This might affect some figures and presented correlations. By examining the solar wind plasma data from Solar Wind Experiment (Wind/SWE, http://web.mit.edu/space/www/wind/) and interplanetary magnetic field data (from Magnetic Field Investigation, http://lepmfi.gsfc.nasa.gov/mfi), we identified, when possible, the associated interplanetary CMEs (ICMEs). The changes of geomagnetic indices and caused by these ICMEs are presented in columns 10 and 11, respectively. The last two columns give the maximum value of magnitude () and southward component () of magnetic field in the ICME. We considered 144 frontside HCMEs (FHCMEs) recorded by the LASCO coronagraphs until the end of 2002. For 101(70) of them we were able to determine the required parameters ( and ). The events that could not be measured were mostly too faint to get height-time plots at the opposite sides of the occulting disk. Only a few (16) were symmetric for which we could not obtain the HCME parameters.
2.2 Statistical analysis
2.2.1 The space velocities of FHCMEs
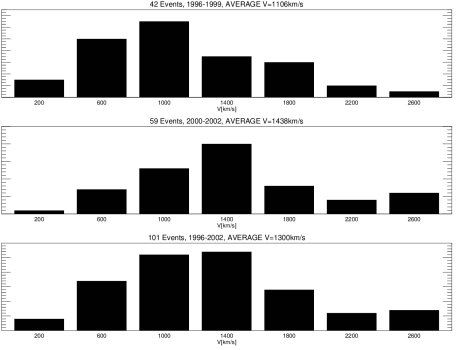
The properties of halo CMEs observed by SOHO/LASCO have been described in a number of papers (Gopalswamy et al., 2003a; Gopalswamy, 2004; Yashiro et al., 2004). Here we describe the properties of FHCMEs measured according to Michalek et al. (2003). Fig. 1 shows the distribution of the space velocities () of FHCMEs during the ascending (1996-1999) and maximum phases of solar activity (2000-2002) as well as for the whole period (1996-2002). It was noted before, e.g., by Webb et al. (1999), Gopalswamy (2004, see Fig 1.13, 1.14) and Yashiro et al. (2004), that HCMEs are much faster and more energetic than typical CMEs. Our results also confirm this. The average speed of the HCMEs is (about larger than that for HCMEs from SOHO/LASCO catalog, Yashiro et al. (2004)). The difference, between average speeds received in the present paper and by Yashiro et al. (2004), is likely to be due to the fact that we are using corrected speeds while Yashiro et al. (2004) used sky-plane speeds. We use a smaller number of events in the statistic. From the histograms in Figure 1, it is evident that velocities of HCMEs increase significantly following the solar activity cycle as for all CMEs (Yashiro et al., 2004). During the maximum of solar activity the FHCMEs have, on the average, velocities about higher than the average velocities during the minimum of solar activity. The speed of the slowest event is while the speed of the fastest one is .
In Fig. 2, we present the sky-plane speeds against the corrected (space) speeds. The solid line represents the linear fit to the data points. The inclination of the linear fit demonstrates that the projection effect increases slightly with the speed of CMEs. It is clear that the projection effect is important, and on average the corrected speeds are higher than the velocities measured in the plane of sky. This was also anticipated based on other considerations (Gopalswamy et al., 2001). It is important to note that both sky-plane and corrected speeds are determined at the same distance () from the disk center.
2.2.2 Widths of FHCMEs
Fig. 3 shows the distribution of the estimated widths () of FHCMEs during the ascending (1996-1999) and maximum phases of solar activity (2000-2002) as well as for the whole period (1996-2002). The average width of HCMEs is (more than twice the average value obtained from the SOHO/LASCO catalog, Yashiro et al., 2004). The average width of HCMEs does not change significantly with solar activity, except for a small increase during the maximum of solar activity. The most narrow HCME has a width of and the widest one has as large as .
2.2.3 Source locations of FHCMEs
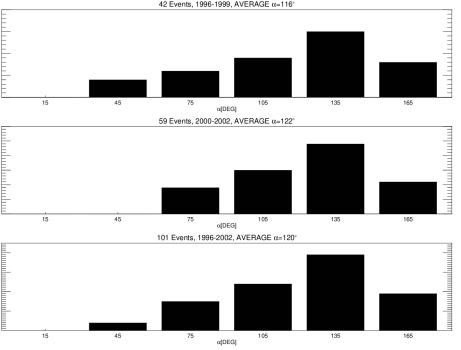
Fig. 4 presents the distribution of source location () of FHCMEs during the ascending (1996-1999) and maximum phases of solar activity (2000-2002) and for the whole period (1996-2002). FHCMEs with close to originate near to the solar limb while events with close to originate from the disk center region. Fig. 4 shows that the FHCMEs originate close to the Sun center with a maximum of distribution around . The distribution of source location does not depend on the period of solar activity. We have to note that these distributions are slightly biased due to the fact that we neglected 16 symmetric FHCMEs (these CMEs cannot be measured using the cone model). They originate very close to the disk center and should slightly increase the average value of .
3 Geoeffectiveness of FHCMEs.
Having defined the parameters describing FHCMEs, we now explore which of theses parameters determine the strength of geomagnetic disturbances. In situ counterparts of frontside HCMEs can be recognized in the magnetic field and plasma measurements as ejecta (EJs) or magnetic clouds (MCs). Magnetic clouds can be identified by the following characteristic properties: (1) the magnetic field strength is higher than the average; (2) the proton temperature is lower than the average; (3) and the magnetic field direction rotates smoothly (Burlaga 1988, 2002, 2003a,b; Lepping et al., 1990). In the present paper we refer to both MCs and EJs as interplanetary CMEs (ICMEs). The presence of these signatures changes from one ICME to an other. By examining the solar wind plasma data we identified, when possible, ICMEs. These ICMEs could be responsible for geomagnetic disturbances. The strength of geomagnetic storms is described by two indices Ap (which measures the general level of geomagnetic activity over the globe) and (which is obtained using magnetometer data from stations near the equator). The maximum values of and indices associated with the ICMEs are presented in Table 1. We included those events for which the index decreased below -25nT. We now examine the relation between the geomagnetic indices and , and . First in the Subsection 3.1, we consider influence of different parameters on geoeffectiveness of FHCMEs (Fig. 5 - Fig. 14). In the Subsection 3.2 we try to find which FHCMEs could cause false alarms (Fig. 15 - Fig. 17).
3.1 Geoeffectiveness of FHCMEs
3.1.1 Geoeffectiveness and space velocity () of FHCMEs.
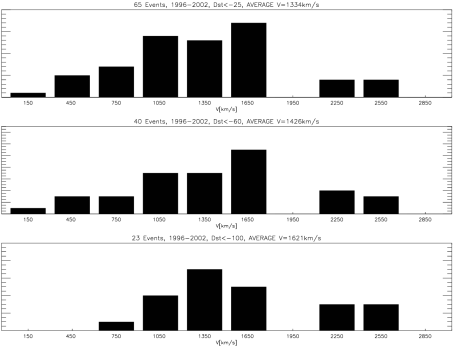
Fig. 5 shows the scatter plots of plane of sky speeds versus and indices. Diamond symbols represent events originating from the western hemisphere and cross symbols represent events originating from the eastern hemisphere. The solid lines are the linear fits to the data points associated with eastern events, and the dashed lines are linear fits to data points associated with western events. The dot-dashed vertical lines indicate velocity limits above which HCMEs can cause geomagnetic storms with . These lines were inferred from two events on 1 May 1998 and 2 May 1998. Upon inspection of this figure, it is clear that the major geomagnetic storms can be generated by slow (speeds ) and fast HCMEs originating in the western hemisphere. There is not a significant correlation (correlation coefficients are ) between the projected speed and geomagnetic indices. Linear and Spearman correlation coefficients are approximately equal 0.35(0.31) for the western and 0.10(0.05) for eastern events, similar to the results of Zhang et al. (2003). The situation is different when we consider the space velocities of HCMEs. In Fig. 6, the scatter plots of versus and indices are presented. The space velocities are larger than the plane of sky speeds and all events in the panels are shifted to the higher velocity range, especially for the two events on 1 May 1998 and 2 May 1998, which seem to be narrow (width ) and three times faster than they appear in LASCO observations (Table 1). Determination of the space velocity is consistent with observations of ICMEs associated with these events. Since, these CMEs needed only hours to reach Earth (Manoharan et al., 2004, Michalek et al., 2004), they must be very fast. In LASCO observations these CMEs appear faint, suggesting that they seem to be narrow and they could be observed as halos when they are far from the Sun. Upon inspection of this figure, it is clear that only very fast events () originating in the western hemisphere can cause the biggest geomagnetic storms (). The dot-dashed verticals lines indicate velocity limits above which HCMEs can cause severe geomagnetic storms. We find significant correlation (correlation coefficients are ) between velocity and geomagnetic indices for the western events. The linear and Spearman correlation coefficients are 0.60(0.54) and 0.62(0.56) for and indices respectively. In contrast there is very little correlation between the space velocity and geomagnetic indices for the eastern events. the linear and spearman correlation coefficients are 0.16(0.04) and 0.07(0.02) for and indices, respectively. Events originating in the eastern hemisphere are not likely to cause major geomagnetic storms. Fig. 7 shows the distribution of the space velocities of FHCMEs, which cause geomagnetic disturbance with index lower than , and , respectively. These histograms demonstrate again that geoeffectivenes of HCMEs depend on their space velocities and sever geomagnetic storms with can be caused by fast CMEs (with ) only. The results seem to be different from these reported by Zhang et al. (2003) for the plane of sky speeds. This demonstrates that conclusions based on coronagraphic observations subjected to the projection effects could be incorrect.
3.1.2 Geoeffectiveness and of HCMEs.
In Fig. 8 we show the scatter plots of versus and indices. Diamond symbols represent events originating from the western hemisphere and cross symbols represent events originating from the eastern hemisphere. The solid lines are the linear fits to the data points associated with eastern events and the dashed lines are linear fits to data points associated with western events. For the eastern events the correlation between and geomagnetic indices is not significant. For these events, the linear and Spearman correlation coefficients for and indices are 0.14(0.18) and 0.20(0.38), respectively. In contrast the western events originating close to the disk center () are more likely to cause the biggest geomagnetic storms. For these events correlation coefficients for and indices are 0.39(0.38) and 0.35(0.42), respectively. Similar conclusions are obtained when we consider H-alpha flare locations. In Fig. 9 we show the scatter plots of absolute values of longitudes of H-alpha flares associated with HCMEs versus and indices. Diamond symbols represent events originating from the western hemisphere and cross symbols represent events originating from the eastern hemisphere. These results confirm previous conclusion that the western events originating close to the disk center are more likely to cause the biggest geomagnetic storms. We have to note that there is one event on 04 April 2000 which originate far from the disk center (N26W66) and cause the severe geomagnetic storm with . Now the correlation between longitude and geomagnetic indices is very poor for the western and eastern events as well. The results are proved by histograms presented in Fig. 10. This figure presents the distribution of the longitude of FHCMs which cause geomagnetic disturbance with index lower than , and . Upon inspection of the histograms, it is clear that the goeffectiveness of CMEs depends on the longitude of source location and that the severe geomagnetic disturbance () are mostly caused by the western events originating close to the disk center. During the study period of time there were only two severe geomagnetic storms () caused by western events originating far from the disk center. It is important to note that the peak of the longitude distribution is shifted to the west from the disk center.
3.1.3 Geoeffectiveness and angular widths () of CMEs
In Fig. 11, we have shown the scatter plots of against and indices. Cross and diamonds symbols are associated with the eastern and western events, respectively. The solid lines are the linear fits to the data points associated with eastern events and the dashed lines are linear fits to data points associated with western events. Upon inspection of the figures it is clear that the geoeffectiveness of CMEs depends very little on their widths. All considered correlation coefficients are . Even severe geomagnetic storms can be caused by both narrow and wide HCMEs. This means that HCMEs do not have to be very large to cause major geomagnetic storms.
3.1.4 Geoeffectivness against velocities and source localization of the FHCMEs
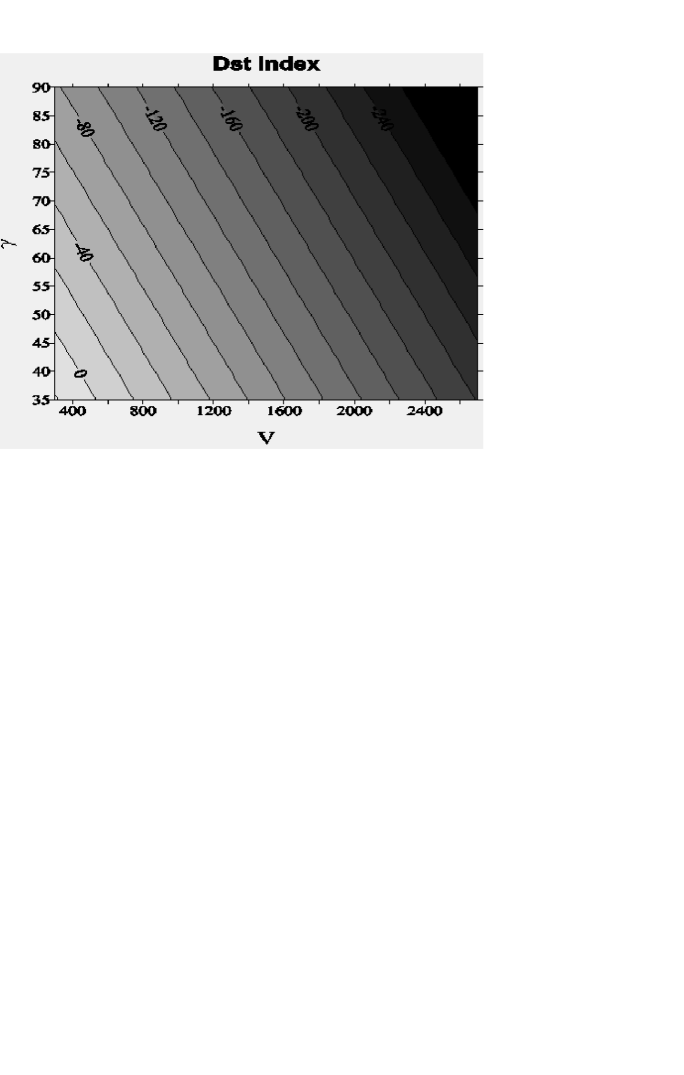
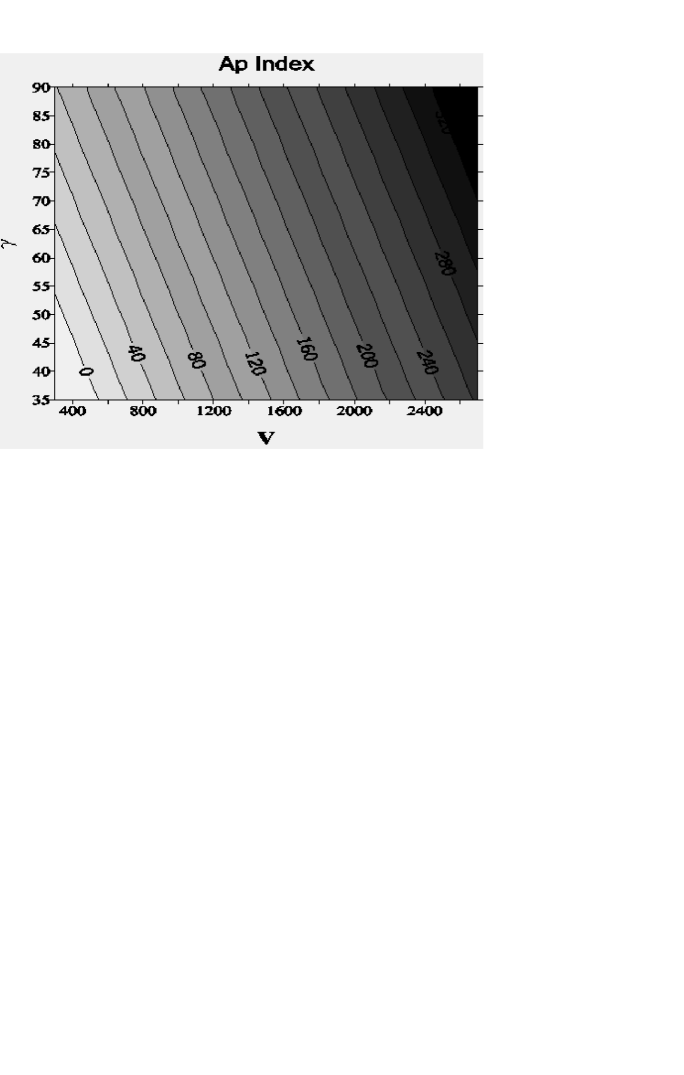
As we demonstrated in the previous subsection, geoeffectiveness of FHCMEs strongly depends on their space velocity and source location . These parameters may be helpful for space weather forecast. In Figs. 12 and 13, and indices versus and are shown in contour plots using the Kriging (Isaacs and Srivastava, 1989) procedure for generating regular grids. The darker the shade, the higher are the and indices. Knowing the source location and space velocity of a given HCME, we can, in a simple way, predict its geoeffectiveness. From the inspection of the picture we see that the strongest geomagnetic storms can occur for fast events originating close to the disk center.
3.1.5 Geoeffectiveness and interplanetary magnetic field (IMF) carried by FHCMEs
Fig. 14 shows the scatter plots of the maximum values of magnitude () and southward component () of ICME magnetic field versus and indices. The solid lines are linear fits to the data points. This figure clearly confirms that the major geomagnetic storms are generated by CMEs carrying strong magnetic filed with significant southward component. Correlation between these parameters and geomagnetic indices is very large and linear coefficients are approximately equal for () and () as well. Spearman correlation coefficients in this case are slightly smaller and are approximately equal for () and (). Spearman correlation coefficients in this case are slightly smaller and are approximately equal for () and (). It is due to the fact that they are derived from the rank of variable within the distribution and they are not sensitive to the 4 outlying points with . Unfortunately, and are measured in situ and hence may not be useful for space weather forecast.
3.2 False alarms
Previous studies (e.g. Cane et al., 2000; St. Cyr et al., 2000; Wang et al. 2002) have shown that a large fraction of frontside HCMEs is non-geoeffective. St. Cyr et al. (2000) found that only () of all frontside HCMEs during 1996-1998 from SOHO/LASCO caused geomagnetic storms with . Wang et al. (2002) used a larger data base (March 1997 to December 2000) showed that () of frontside HCMEs could result in moderate to severe geomagnetic storms () and that the majority of these events occurred within latitude . They also found an asymmetry in the central meridian distance distribution. In the western hemisphere, a geoeffective event could be expected even at . On the eastern side, there were no geoeffective HCMEs outside of . We performed a similar analysis for our sample of FHCMEs. During the study period, there were only FHCMEs with geomagnetic signatures () at Earth which means that only of FHCMEs are geoeffective. For () of them we determined the space parameters ( and ). If we take into account only those FHCMEs which caused moderate to severe geomagnetic storms () the fraction of geoeffective events decreased to (). It is important to recognize them because they generate ”false alarms”. In our sample, there were () not geoeffective HCMEs. For () of them we were able to determine the space parameters ( and ). We now explore why these FHCMEs did not cause geomagnetic disturbances. Fig. 15 presents the distributions of longitude and the space velocities of the non-geoeffective FHCMEs. The histograms show that these events originate from the whole solar disk and have velocities from up to . The distributions do not demonstrate any specific signatures characterizing these events. Fig. 16 shows, in the successive panels, the distributions of: the space velocities for FHCMEs originating close to the disk center (), the space velocities for FHCMEs originating close to the limb (), the longitude for slow FHCMEs () and the longitude for fast FHCME (). Upon the inspection of the histograms (the first and last panel in the figure) it is clear that all fast HCMEs () originating close to the disk center () must be geoeffective. There is no false alarm for such events. Slower FHCMEs () originating close to the disk center do not have to be geoeffective. In the third panel we note events originating from the disk center but not influencing Earth. On the other hand, even very fast FHCMEs ( were not geoeffetive when they originated close to the limb. In the fourth panel we have 16 fast FHCMEs originating close to the limb without geomagnetic signatures at Earth. Fig. 17 shows the scatter plot of the space velocities versus longitude for all FHCMEs. Diamond symbols represent goeeffective and cross symbols non-geoeffective FHCMEs. The solid lines are linear fits for non-geoeffective events originating from the east and west hemisphere. For non-geoeffective eastern and western events the linear and Spearman correlation coefficients are very large and equal and , respectively. Upon inspection of the figure, it is clear that geoeffective events are faster than the non-geoeffective events originating at the same longitude. It is also clear from the strong correlation that events originating farther form the disk center are faster than those originating close to the disk center. Linear fits to the non-geoeffective events could be considered as lower limits for the space velocities above which a given CME originating at a given longitude could be observed as a halo event. In the vicinity of these fits we see both geoeffective and non-geoeffective FHCMEs. Slightly above these fits we see only geoeffective FHCMEs. It is important to note that the inclination of linear fit to the eastern events is steeper than that for the western events. Eastern events must be faster to appear as halo events or to be geoeffective than western events originating at the same angular distance from the disk center.
Generally our results are consistent with those of previous studies. We would like to emphasize that the geoeffectiveness of HCMEs depends not only on source locations, but also on their space velocity. Having both the parameters improves our ability to forecast whether a given HCME will be geoeffective or not. Non geoeffective events are slow or fast but originating far from disk center. They do not affect magnetosphere. If they are directly ejected to Earth they are slow and disturbed before reach Earth. If they are fast, they are ejected not directly to Earth (events with large longitude) and they only touch magnetosphere by flanks. Unfortunately there is very difficult to give sharp boundary limits dividing CMEs on geoeffective and non geoeffective events. These limits depend not only on CMEs properties but also on condition of interplanetary medium. Approximate limits can be obtain from Fig. 17. Of course, we appreciate that additional parameters such as the strength and orientation of the resulting interplanetary CME are also expected to play a role in deciding the geoeffectiveness. It is difficult to give sharp boundary conditions for non geoeffective events.
4 Summary
In this study we considered the geoeffectiveness of all full HCMEs observed by SOHO/LASCO coronagraphs from the launch in 1995 until the end of 2002. For () of full HCMEs we were able to find the source location, width and space velocity using the cone model (Michalek et al., 2003). We must be aware that the cone model is only rough simplification of real events. We know that not all CMEs are perfectly symmetric (Moran and Davila, 2004; Jackson et al., 2004). Most of CMEs could be approximate using cone model but probably for some of them this assumption is unrealistic. Fortunately technique presented by Michalek et al. does not demand perfect symmetry for CMEs. This approach requires measurements of sky-plane speeds and the moments of the first appearance of the halo CMEs above limb at only two opposite points. We are able to determine, with good accuracy, the space velocity and with of a given CME at least in the plane symmetry crossing CMEs at these points. When a given CME could be approximated by the cone model these derived parameters are valid for the entire CME. HCMEs originating very close to the disk center (mostly within a latitude of ), are very wide (the average angular width ) and are very fast (the average space speed ). We find significant () increase in the average space velocities of HCMEs during the maximum of solar activity. These results could suggest that the HCMEs represent a special class of CMEs which are very wide and fast. It is important to note that this ”class” of CMEs is defined due to artificial effect caused by coronagraphic observations. Events originating close to the disk center (from SOHO/LASCO point of view) must be wide and fast to appear as HCMEs in LASCO observations. This is not due to localization on the solar disk but due to oculting disk which not only blocks bright photospheric light but also eliminates some narrow and slow events. We have to emphasize that this effect mostly depends on the dimension of oculting disk but in less degree on the sensitivity of instrument. More sensitive instrument can record some poorer events (halos and also not halos so statistic will be similar) but could not register these events which never appear behind occulting disk. Potentially more sensitive instrument could register less energetic events (narrower and slower) and the average velocities and widths (for halos and whole population of CMEs) could be slightly lower but the main relation between the halos and whole population of events will be the same. Fortunately, poor events do not cause a big concern because they are not geoeffective. We do not expect, in the near future, any special programs devoted to looking for less energetic CMEs. Next scientific mission (STEREO) will be mostly dedicated to recognize 3D structure of CMEs. Such fast and wide CMEs are known to be associated with electron and proton acceleration by driving fast mode MHD shocks (e.g., Cane et al., 1987; Gopalswamy et al., 2002a). Using observations from Wind spacecraft, interplanetary magnetic clouds (MC) and geomagnetic disturbances associated to HCMEs were identified. The strength of geomagnetic storms, described by and indices, is highly correlated with the source location and space velocity of a given event. Only HCMEs originating in the western hemisphere, close to the solar center and very fast (space velocity ) are likely to cause major geomagnetic storms (). Slow HCMEs (space velocity ), even originating close to the solar center, may not cause severe geomagnetic disturbances. We have to note that there was one event (04 April 2000), which originated far from disk center and produced a severe geomagnetic storm (). Probably this storm was not due to an ICME. It was caused by the sheath region ahead of the CME as was reported by Gopalswamy (2002b). We illustrated, using contour maps, how the derived HCME parameters can be useful for space weather forecast. We have to note that geoeffectiveness of events does not depend on their widths.
During our study period we recognized () FHCMEs without any geomagnetic signature at Earth. This is significant population of FHCMEs. To distinguish them from the geoeffective events we considered the source locations and space velocities of HCMEs. When both the parameters are available, it becomes easier to assess the geoeffectiveness of HCMEs. We may say that fast FHCMs () originating close to the disk center () must be geoeffective. For such events there were no false alarms. But, even very fast events originating far from the disk center can be non-geoeffective.
Acknowledgements.
This work was done when GM visited the Center for Solar Physics and Space Weather, The Catholic University of America in Washington.Work done by Grzegorz Michalek was partly supported by Komitet Badań Naukowych through the grant PB 0357/P04/2003/25. Part of this research was also supported by NASA/LWS and NSF/SHINE programs.
References
- [Burlaga et al. (1988)] Burlaga, L.F., et al., 1988, J. Geophys. Res., 93,7217
- [Burlaga et al. (2003)] Burlaga, L.F., et al., 2003a, ApJ, 585, 115893
- [Burlaga et al. (1988)] Burlaga, L.F., et al., 2003b, J. Geophys. Res., 108, SSH2-1
- [Cane et al. (1987)] Cane, H.V., et al., 1987, J. Geophys. Res., 92, 9869
- [Cane et al. (2000)] Cane, H.V., Richardson, I.G., St.Cyr, O.C.,2000, Geophys. Res. Lett., 27, 3591
- [Gopalswamy et al. (2000)] Gopalswamy, N., et al. 2000a, Geophys. Res. Lett., 27, 145
- [Gopalswamy et al. (2000)] Gopalswamy, N., et al. 2000b, Geophys. Res. Lett., 27, 1427
- [Gopalswamy et al. (2001)] Gopalswamy, N., et al., 2001,J. Geophys. Res., 106, 29207
- [Gopalswamy et al. (2002)] Gopalswamy, N., et al., 2002a, ApJL, 572, L103
- [Gopalswamy et al. (2002)] Gopalswamy, N., 2002b, In solar-terrestial magnetic activity ans space environment, Ed. H.N. Wang and R.L. Lin, COSPRA Colloquia Ser., Vol. 14, p157
- [Gopalswamy et al. (2003)] Gopalswamy, N., et al., 2003a, ApJ, 598,L63
- [Gopalswamy et al. (2003)] Gopalswamy, N., et al., 2003b, Proc. ISCS 2003 Synposium, Tatranska Lomnica, Slovakia, p403
- [Gopalswamy et al. (2004)] Gopalswamy, N., 2004, ASSL series, ed. G. Poletto and S. Suess, KLUWER, in press
- [Gosling (1993)] Gosling J.T., 1993, J. Geophys. Res. , 98, 18937
- [Gosling et al. (1990)] Gosling J.T., et al., 1990, Geophys. Res. Lett., 17, 901
- [Howard et al. (1982)] Howard R.A., et al., 1982, ApJ, 263, L101
- [Isaacs et al. (1989)] Isaacs, E., Srivastava, 1989, An Introduction to Applied Geostatistics.- Oxford University Press, New York.
- [Jackson et al. (2004)] Jackson, B., et al., 2004, AGU, Fall Meeting 2004, abstract SH21A-0393
- [Kahler (1992)] Kahler S.W., 1992,Annu. Rev. Astron. Astrophys.,30,113
- [Lepping (1990)] Lepping, R.P., et al., 1990, J.Geophys.Res., 95, 11957
- [Manoharan (2004)] Manoharan, P.K., et al., 2004 J. Geophys. Res., 109, A06109
- [Michalek (2003)] Michalek, G., et al., 2003, ApJ, 584, 472
- [Michalek (2004)] Michalek, G., et al., 2004, A&A, 423,729
- [Moran (2004)] Moran, T., Devila, 2004, Science, 305, 66
- [srivastava et al. (2002)] Srivastava, N., Venkatakrishnan, P., Geophys. Res. Lett., 29, 101029
- [Sheeley et al. (1999)] Sheeley, N.R., Jr., Walters, J.H., Wang, Y.-M., Howard, R.A. 1999, J. Geophys. Res., 104, 24739
- [St. Cyr et al. (2000)] St. Cyr, O.C., et al., 2000, J. Geophys. Res., 105, 18169
- [Tsurutani et al. (1998)] Tsurutani B.T., Gonzalez W.D., 1998, Geophys. Monogr. 98; Washington, DC,AGU,77
- [wang et all. (2002)] Wang, Y.M., et al., 2002, J. Geophys. Res., 107, 1340
- [Webb et al. (1997)] Webb, D.F., et al. 1997, J. Geophys. Res., 102, 24161
- [Webb et al. (2000)] Webb, D.F., et al. 2000,J. Geophys. Res., 105, 7491
- [Xie et al. (2004)] Xie H., et al. 2004, J. Geophys. Res., 109, A03109
- [Yashiro et al. (2004)] Yashiro, S., et al. 2004, J. Geophys. Res., 109, A07106
- [Zhang et al. (2003)] Zhang et al., 2003,ApJ, 582, 520


List of halo CMEs
| DATA | TIME | SPEED | PA | r | V | Location | Dst | Ap | B | |||
|---|---|---|---|---|---|---|---|---|---|---|---|---|
| km/ s | Deg | Deg | Deg | km/s | nT | nT | ||||||
| 1996/12/02 | 15:35:05 | 538 | 270 | 0.77 | 39 | 110 | 830 | S05W75 | — | — | — | — |
| 1997/01/06 | 15:10:42 | 136 | 182 | 0.13 | 82 | 105 | 189 | S18E06 | -78 | 88 | 16 | -15 |
| 1997/04/07 | 14:27:44 | 875 | 126 | 0.42 | 65 | 139 | 954 | S30E19 | -82 | 111 | 23 | -14 |
| 1997/05/12 | 06:30:09 | 464 | 277 | 0.32 | 71 | 111 | 790 | N21W08 | -115 | 111 | 26 | -25 |
| 1997/08/30 | 01:30:35 | 370 | 65 | 0.21 | 78 | 56 | 590 | N30E17 | -98 | 94 | 18 | -17 |
| 1997/09/17 | 20:28:48 | 377 | 274 | 0.65 | 49 | 148 | 360 | N45W16 | -38 | 09 | 18 | -07 |
| 1997/09/28 | 01:08:33 | 359 | 66 | 0.53 | 57 | 131 | 212 | N22E05 | — | — | — | — |
| 1997/10/21 | 18:03:45 | 523 | 30 | 0.24 | 75 | 103 | 580 | N16E07 | -64 | 56 | — | — |
| 1997/11/04 | 06:10:05 | 755 | 265 | 0.12 | 85 | 125 | 912 | S14W33 | -106 | 132 | 19 | -16 |
| 1997/11/06 | 12:10:41 | 1556 | 261 | 0.82 | 34 | 153 | 2059 | S18W63 | — | — | — | — |
| 1998/01/21 | 06:37:25 | 361 | 176 | 0.71 | 44 | 159 | 468 | S57E19 | — | — | — | — |
| 1998/01/25 | 15:26:34 | 693 | 36 | 0.27 | 74 | 123 | 705 | N21E25 | -55 | 32 | 09 | -06 |
| 1998/04/23 | 05:27:07 | 1618 | 113 | 0.61 | 59 | 126 | 1744 | E15E48 | — | — | — | — |
| 1998/04/27 | 08:56:06 | 1385 | 79 | 0.35 | 69 | 118 | 1443 | S16E50 | — | — | — | — |
| 1998/04/29 | 16:58:54 | 1374 | 16 | 0.30 | 72 | 89 | 1622 | S17E20 | -85 | 111 | 15 | -13 |
| 1998/05/01 | 23:40:09 | 585 | 142 | 0.10 | 84 | 40 | 1427 | S18W05 | -205 | 300 | 42 | -35 |
| 1998/05/02 | 05:31:56 | 542 | 143 | 0.10 | 85 | 39 | 1612 | S20W07 | -205 | 300 | 42 | -35 |
| 1998/05/02 | 14:06:12 | 938 | 311 | 0.15 | 81 | 57 | 1518 | S15W15 | -139 | 80 | 19 | -13 |
| 1998/11/04 | 07:54:07 | 523 | 0 | 0.25 | 75 | 62 | 541 | N17W01 | -81 | 50 | 20 | -15 |
| 1998/11/05 | 02:02:52 | 380 | 264 | 0.18 | 79 | 88 | 482 | N19W10 | — | — | — | — |
| 1998/11/05 | 20:44:02 | 1118 | 305 | 0.35 | 69 | 75 | 1283 | N22W18 | -149 | 179 | 35 | -25 |
| 1998/11/24 | 02:30:05 | 1744 | 224 | 0.88 | 27 | 153 | 2655 | S30W81 | — | — | — | — |
| 1998/11/27 | 08:30:05 | 434 | — | — | — | — | — | S24E09 | — | — | — | — |
| 1998/12/18 | 18:09:50 | 1749 | 40 | 0.68 | 47 | 120 | 1792 | N19E64 | — | — | — | — |
| 1999/05/03 | 06:06:05 | 1584 | 50 | 0.61 | 51 | 110 | 1369 | N15E32 | — | — | — | — |
| 1999/05/10 | 05:50:05 | 920 | 80 | 0.27 | 74 | 76 | 1333 | N16E19 | -49 | 48 | — | — |
| 1999/06/12 | 21:26:08 | 465 | — | — | — | — | — | N27W43 | — | — | — | — |
| 1999/06/22 | 18:54:05 | 1133 | — | — | — | — | — | N22E37 | -33 | 22 | 16 | -10 |
| 1999/06/23 | 07:31:24 | 1006 | — | — | — | — | — | N24E45 | — | — | — | — |
| 1999/06/24 | 13:31:24 | 975 | 314 | 0.63 | 50 | 144 | 1148 | N24E34 | -41 | 48 | 12 | -07 |
| 1999/06/26 | 07:31:25 | 558 | 0 | 0.11 | 83 | 67 | 909 | N25E00 | — | — | — | — |
| 1999/06/28 | 21:30:08 | 1083 | — | — | — | — | — | N26W51 | — | — | — | — |
| 1999/06/29 | 07:31:26 | 634 | 10 | 0.15 | 81 | 112 | 698 | N19E02 | -26 | 48 | 11 | -07 |
| 1999/06/29 | 18:54:07 | 438 | — | — | — | — | — | S14E01 | — | — | — | — |
| 1999/06/30 | 11:54:07 | 406 | 23 | 0.16 | 80 | 92 | 705 | S15E00 | — | — | — | — |
| 1999/07/25 | 13:31:21 | 1389 | 306 | 0.76 | 40 | 127 | 1466 | N38W81 | — | — | — | — |
| 1999/07/28 | 05:30:05 | 457 | — | — | — | — | — | S15E08 | -53 | 179 | 11 | -07 |
| 1999/07/28 | 09:06:05 | 456 | — | — | — | — | — | S15E04 | -39 | 56 | 07 | -05 |
| 1999/09/20 | 06:06:05 | 604 | — | — | — | — | — | S20W05 | -173 | 207 | 23 | -22 |
| 1999/10/14 | 09:26:05 | 1250 | 63 | 0.82 | 34 | 157 | 1702 | N11E32 | — | — | — | — |
| 1999/12/22 | 02:30:05 | 570 | 14 | 0.75 | 40 | 162 | 984 | N10E30 | — | — | — | — |
| 1999/12/22 | 19:31:22 | 605 | 24 | 0.65 | 69 | 141 | 1042 | N24E19 | — | — | — | — |
| 2000/01/18 | 17:54:05 | 739 | 162 | 0.18 | 79 | 148 | 848 | S19E11 | -97 | 94 | 18 | -16 |
| 2000/01/28 | 20:12:41 | 1177 | — | — | — | — | — | S31W28 | — | — | — | — |
| 2000/02/08 | 09:30:05 | 1079 | 55 | 0.63 | 50 | 162 | 1091 | N25E26 | -25 | 32 | 08 | -07 |
| 2000/02/09 | 19:54:17 | 910 | 218 | 0.44 | 63 | 128 | 1125 | S17W40 | -133 | 80 | 13 | -10 |
| 2000/02/10 | 02:30:05 | 944 | 331 | 0.41 | 65 | 111 | 1111 | N30E03 | -58 | 22 | — | — |
| 2000/02/12 | 04:31:20 | 1107 | 335 | 0.61 | 52 | 151 | 1121 | N26W23 | -67 | 56 | 10 | -08 |
| 2000/02/17 | 20:06:05 | 728 | 196 | 0.29 | 72 | 149 | 801 | S29E07 | -26 | 39 | 18 | -11 |
| 2000/04/04 | 16:32:37 | 1188 | 304 | 0.79 | 37 | 151 | 1645 | N16W66 | -288 | 300 | 32 | -30 |
| 2000/04/10 | 00:30:05 | 409 | 212 | 0.14 | 81 | 125 | 470 | S14W01 | — | — | — | — |
| 2000/05/05 | 15:50:05 | 1594 | 269 | 0.85 | 32 | 146 | 2154 | S16W84 | — | — | — | — |
| 2000/06/06 | 15:54:05 | 1119 | 6 | 0.32 | 71 | 152 | 1028 | N20E18 | -90 | 132 | 15 | -13 |
| 2000/06/07 | 16:30:05 | 842 | — | — | — | — | — | N23E03 | -52 | 32 | — | — |
| 2000/06/10 | 17:08:05 | 1108 | 306 | 0.68 | 50 | 138 | 1460 | N22W37 | — | — | — | — |
| 2000/07/07 | 10:26:05 | 453 | 198 | 0.42 | 65 | 147 | 315 | N17E10 | -25 | 56 | 13 | -05 |
| 2000/07/11 | 13:27:23 | 1078 | 51 | 0.68 | 47 | 162 | 1753 | N18E27 | -43 | 132 | 10 | -09 |
| 2000/07/14 | 10:54:07 | 1674 | 270 | 0.10 | 85 | 69 | 2521 | N22W07 | -301 | 400 | 48 | -40 |
| 2000/07/25 | 03:30:05 | 528 | — | — | — | — | — | N06W08 | -74 | 67 | 15 | -09 |
| 2000/08/09 | 16:30:05 | 702 | — | — | — | — | — | N11W11 | -237 | 179 | 34 | -29 |
| 2000/09/12 | 11:54:05 | 1550 | 216 | 0.58 | 54 | 159 | 1385 | S17W18 | -39 | 48 | — | — |
| 2000/09/15 | 21:50:07 | 257 | — | — | — | — | — | N13E03 | — | — | — | — |
| 2000/09/16 | 05:18:14 | 1251 | 21 | 0.27 | 74 | 126 | 1278 | N14W07 | -201 | 236 | 40 | -30 |
| 2000/09/25 | 02:50:05 | 587 | — | — | — | — | — | S11W59 | — | — | — | — |
| 2000/10/02 | 03:50:05 | 525 | 144 | 0.41 | 65 | 131 | 578 | S09E07 | — | — | — | — |
| 2000/10/02 | 20:26:05 | 569 | — | — | — | — | — | S10W02 | -170 | 179 | 12 | -10 |
| DATA | TIME | SPEED | PA | r | V | Location | Dst | Ap | B | |||
| km/ s | Deg | Deg | Deg | km/s | nT | nT | ||||||
| 2000/10/09 | 23:50:05 | 798 | — | — | — | — | — | N01W14 | -71 | 111 | 10 | -05 |
| 2000/10/24 | 08:26:05 | 800 | — | — | — | — | — | S20E70 | — | — | — | — |
| 2000/10/25 | 08:26:05 | 770 | — | — | — | — | — | N17W70 | -127 | 80 | 19 | -18 |
| 2000/11/01 | 16:26:08 | 801 | — | — | — | — | — | S20E42 | -50 | 48 | — | — |
| 2000/11/03 | 18:26:06 | 291 | — | — | — | — | — | N02W02 | -159 | 132 | 24 | -17 |
| 2000/11/23 | 06:06:05 | 492 | 230 | 0.72 | 43 | 168 | 651 | S22W33 | — | — | — | — |
| 2000/11/24 | 05:30:05 | 994 | 352 | 0.45 | 62 | 147 | 1013 | N20W05 | — | — | — | — |
| 2000/11/24 | 15:30:05 | 1245 | 324 | 0.26 | 74 | 96 | 1556 | N22W07 | -80 | 94 | 11 | -08 |
| 2000/11/24 | 22:06:05 | 1005 | 312 | 0.56 | 55 | 130 | 1122 | N21W14 | — | — | — | — |
| 2000/11/25 | 01:31:58 | 2519 | 75 | 0.54 | 57 | 100 | 2452 | N07E50 | -53 | 45 | 11 | -05 |
| 2000/11/25 | 09:30:17 | 675 | — | — | — | — | — | N18W24 | — | — | — | — |
| 2000/11/25 | 19:31:57 | 671 | — | — | — | — | — | N20W23 | — | — | — | — |
| 2000/11/26 | 17:06:05 | 980 | 283 | 0.58 | 54 | 124 | 1360 | N18W38 | -119 | 111 | 10 | -10 |
| 2000/12/18 | 11:50:05 | 510 | 15 | 0.05 | 87 | 105 | 740 | N14E03 | — | — | — | — |
| 2001/01/10 | 00:54:05 | 832 | 102 | 0.55 | 56 | 122 | 933 | N13E36 | — | — | 10 | -05 |
| 2001/01/20 | 19:31:50 | 839 | 109 | 0.51 | 58 | 134 | 1082 | S07E40 | — | — | — | — |
| 2001/01/20 | 21:30:08 | 1507 | 78 | 0.49 | 60 | 93 | 2139 | S07E46 | -61 | 39 | 08 | -07 |
| 2001/02/11 | 01:31:48 | 1183 | 294 | 0.64 | 69 | 69 | 1516 | N24W57 | -43 | 32 | — | — |
| 2001/02/15 | 13:54:05 | 625 | 18 | 0.39 | 66 | 134 | 608 | N07E12 | — | — | 07 | -06 |
| 2001/03/19 | 05:26:05 | 389 | — | — | — | — | — | S05W00 | -42 | 32 | 08 | -06 |
| 2001/03/24 | 20:50:05 | 906 | — | — | — | — | — | N15E22 | -55 | 80 | — | — |
| 2001/03/25 | 17:06:05 | 677 | 19 | 0.42 | 65 | 164 | 835 | N16E26 | -86 | 94 | 10 | -09 |
| 2001/03/29 | 10:26:05 | 942 | 277 | 0.38 | 67 | 168 | 1186 | N20W19 | -351 | 300 | 50 | -45 |
| 2001/04/05 | 17:06:05 | 1390 | 83 | 0.43 | 64 | 127 | 1404 | S24E50 | -59 | 132 | 10 | -05 |
| 2001/04/06 | 19:30:02 | 1270 | 124 | 0.54 | 56 | 143 | 1502 | S21E31 | -63 | 132 | 13 | -10 |
| 2001/04/09 | 15:54:02 | 1192 | 213 | 0.18 | 79 | 65 | 1705 | S21W04 | -271 | 207 | 35 | -25 |
| 2001/04/10 | 05:30:00 | 2411 | 187 | 0.25 | 75 | 103 | 2489 | S23W09 | -271 | 236 | 21 | -10 |
| 2001/04/11 | 13:31:48 | 1103 | 229 | 0.23 | 76 | 107 | 1450 | S22W27 | -108 | 154 | 15 | -08 |
| 2001/04/12 | 10:31:29 | 1184 | 251 | 0.57 | 55 | 120 | 1566 | S19W43 | -75 | 50 | — | — |
| 2001/04/26 | 12:30:05 | 1006 | 46 | 0.64 | 50 | 140 | 928 | N17W31 | -47 | 80 | 11 | -09 |
| 2001/08/14 | 16:01:28 | 618 | — | — | — | — | — | N16W36 | -105 | 132 | 23 | -13 |
| 2001/08/25 | 16:50:05 | 1433 | 127 | 0.54 | 57 | 107 | 1602 | S17E34 | -28 | 39 | 06 | -04 |
| 2001/08/31 | 16:11:33 | 310 | — | — | — | — | — | N19E33 | — | — | — | — |
| 2001/09/11 | 14:54:05 | 791 | 74 | 0.39 | 66 | 148 | 768 | N13E35 | -47 | 39 | 07 | -05 |
| 2001/09/24 | 10:30:59 | 2402 | 147 | 0.36 | 68 | 79 | 2650 | S12E23 | -102 | 154 | 15 | -05 |
| 2001/09/28 | 08:54:34 | 846 | — | — | — | — | — | N10E18 | -148 | 120 | 20 | -13 |
| 2001/10/09 | 11:30:05 | 973 | 174 | 0.27 | 73 | 79 | 1514 | S28E08 | -71 | 80 | 25 | -18 |
| 2001/10/19 | 16:50:05 | 901 | 268 | 0.37 | 67 | 101 | 1389 | N15W29 | -187 | 160 | 15 | -07 |
| 2001/10/22 | 15:06:05 | 1336 | 121 | 0.51 | 58 | 113 | 1441 | S21E18 | -41 | 20 | 09 | -04 |
| 2001/10/25 | 15:26:05 | 1092 | 203 | 0.27 | 73 | 105 | 1170 | S16W21 | -157 | 104 | 19 | -14 |
| 2001/11/01 | 22:30:05 | 453 | — | — | — | — | — | N12W23 | -41 | 56 | — | — |
| 2001/11/03 | 19:20:05 | 457 | 307 | 0.25 | 75 | 138 | 431 | N04W20 | — | — | — | — |
| 2001/11/04 | 16:35:06 | 1810 | 246 | 0.21 | 77 | 118 | 2184 | N06W18 | -288 | 300 | 10 | -09 |
| 2001/11/17 | 05:30:06 | 1379 | 65 | 0.73 | 42 | 145 | 1580 | S13E42 | -48 | 32 | 08 | -05 |
| 2001/11/21 | 14:06:05 | 518 | — | — | — | — | — | S13W18 | — | — | — | — |
| 2001/11/22 | 20:30:33 | 1443 | 221 | 0.74 | 42 | 138 | 1847 | S25W67 | — | — | — | — |
| 2001/11/22 | 23:30:05 | 1437 | 68 | 0.74 | 42 | 159 | 2275 | S17W36 | -221 | 225 | 22 | -12 |
| 2001/11/28 | 17:30:06 | 500 | — | — | — | — | — | N14E16 | — | — | 07 | -03 |
| 2001/12/13 | 14:54:06 | 864 | — | — | — | — | — | N16E09 | — | — | — | — |
| 2002/01/04 | 09:30:05 | 896 | — | — | — | — | — | N38E87 | — | — | — | — |
| 2002/01/08 | 17:54:05 | 1794 | — | — | — | — | — | S18E79 | -51 | 48 | — | — |
| 2002/02/20 | 06:30:05 | 952 | 270 | 0.88 | 27 | 153 | 1662 | N12W72 | — | — | — | — |
| 2002/03/14 | 17:06:06 | 907 | 140 | 0.75 | 41 | 132 | 1429 | S23E57 | — | — | — | — |
| 2002/03/15 | 23:06:06 | 907 | 276 | 0.49 | 60 | 153 | 1014 | S08W03 | -41 | 48 | 23 | -10 |
| 2002/03/18 | 02:54:06 | 989 | 257 | 0.31 | 71 | 115 | 1001 | S15W22 | — | — | 08 | -05 |
| 2002/03/20 | 17:30:05 | 308 | — | — | — | — | — | S17W20 | -101 | 84 | 15 | -11 |
| 2002/03/22 | 11:06:05 | 1750 | 261 | 0.64 | 49 | 105 | 1758 | S20W80 | -97 | 80 | — | — |
| 2002/04/15 | 03:50:05 | 720 | — | — | — | — | — | S15W01 | -126 | 154 | 15 | -10 |
| 2002/04/17 | 08:26:05 | 1218 | 283 | 0.58 | 54 | 129 | 1370 | S16W54 | -151 | 154 | 10 | -09 |
| 2 2002/05/07 | 04:06:05 | 720 | 120 | 0.32 | 70 | 77 | 754 | S22E14 | — | — | 08 | -03 |
| 2002/05/08 | 13:50:05 | 614 | — | — | — | — | — | S12W07 | -102 | 111 | 12 | -10 |
| 2002/05/16 | 00:50:05 | 600 | 140 | 0.26 | 74 | 61 | 972 | S22E14 | -58 | 56 | 20 | -10 |
| 2002/05/22 | 03:50:05 | 1494 | 247 | 0.45 | 65 | 123 | 1778 | S30W34 | -108 | 236 | 16 | -11 |
| 2002/05/28 | 16:26:05 | 1244 | 224 | 0.89 | 26 | 158 | 2518 | N06W82 | — | — | — | — |
| 2002/07/15 | 20:30:05 | 1132 | 3 | 0.28 | 73 | 68 | 1543 | N19W01 | -12 | 48 | 07 | -03 |
| 2002/07/18 | 08:06:08 | 1111 | 279 | 0.43 | 64 | 99 | 1015 | N19W30 | -32 | 32 | 08 | -05 |
| 2002/07/23 | 01:31:51 | 1726 | 87 | 0.87 | 29 | 141 | 2576 | S13E72 | — | — | — | — |
| 2002/07/26 | 22:06:10 | 818 | — | — | — | — | — | S19E26 | — | — | — | — |
| 2002/07/29 | 12:07:33 | 556 | — | — | — | — | — | N10W15 | -51 | 55 | 14 | -13 |
| 2002/08/16 | 12:30:05 | 1459 | 121 | 0.23 | 76 | 107 | 1565 | S14E20 | -53 | 48 | 14 | -10 |
| 2002/08/22 | 02:06:06 | 1005 | 233 | 0.77 | 39 | 139 | 1740 | S05W62 | — | — | — | — |
| 2002/08/24 | 01:27:19 | 1878 | — | — | — | — | — | S02E81 | -45 | 39 | — | — |
| 2002/09/05 | 16:54:06 | 1657 | 115 | 0.46 | 62 | 89 | 2177 | N04W28 | -170 | 154 | 10 | -08 |
| 2002/11/09 | 13:31:45 | 1838 | — | — | — | — | — | S12W29 | — | — | — | — |
| 2002/11/10 | 03:30:11 | 1516 | — | — | — | — | — | S12W37 | — | — | — | — |
| 2002/11/24 | 20:30:05 | 1077 | 48 | 0.79 | 36 | 167 | 1367 | N15E63 | -52 | 48 | 08 | -03 |
| 2002/12/08 | 23:54:05 | 1339 | — | — | — | — | — | S18E70 | — | — | — | — |
| 2002/12/19 | 22:06:05 | 1092 | 299 | 0.30 | 72 | 136 | 1231 | N15W09 | -58 | 67 | — | — |