Jets or high velocity flows revealed in high-cadence spectrometer and imager co-observations?
Abstract
We report on active region EUV dynamic events observed simultaneously at high-cadence with SUMER/SoHO and TRACE. Although the features appear in the TRACE Fe ix/x 171 Å images as jets seen in projection on the solar disk, the SUMER spectral line profiles suggest that the plasma has been driven along a curved large scale magnetic structure, a pre-existing loop. The SUMER observations were carried out in spectral lines covering a large temperature range from 104 K to 106 K. The spectral analysis revealed that a sudden heating from an energy deposition is followed by a high velocity plasma flow. The Doppler velocities were found to be in the range from 90 to 160 km s-1. The heating process has a duration which is below the SUMER exposure time of 25 s while the lifetime of the events is from 5 to 15 min. The additional check on soft X-ray Yohkoh images shows that the features most probably reach 3 MK (X-ray) temperatures. The spectroscopic analysis showed no existence of cold material during the events.
1 Introduction
A large variety of jet-like phenomena are often observed in the solar atmosphere such as surges, spicules, sprays, Extreme-UltraViolet (EUV) and X-ray jets. X-ray jets (Shibata et al. 1992) were first identified in data obtained with the Soft X-ray Telescope (SXT) on Yohkoh (Tsuneta et al. 1991). They represent X-ray enhancements with an apparent collimated motion and were found to have a typical size of 5 103 – 4 105 km and an apparent velocity of 30 to 300 km s-1. Their kinetic energy is estimated to be 1025 – 1028 ergs. Most of the jets were associated with small flares in large X-ray bright points or active regions. Shimojo & Shibata (2000) derived the physical parameters of X-ray jets and found temperatures from 3 to 8 MK (determined by using Yohkoh filter ratios) and densities of 0.7 – 4.0 109 cm-3. It is strongly believed that they are produced by magnetic reconnection and represent the evaporation flow resulting from the reconnection heating.
EUV jets were studied by Brekke (1999) in off-limb data from the Coronal Diagnostics Spectrometer (CDS) and the Extreme-ultraviolet Imaging Telescope (EIT). From the CDS data it was found that the jet was emitting only at transition region temperatures showing Doppler shifts in the O v 629.73 Å line up to -75 km s-1. The event was also seen in the EIT Fe xii 195 Å passband propagating with an apparent velocity of 180 km s-1. The plasma seemed to be ejected along a large looped magnetic structure. Jets were also analysed in on-disk data from the Transition Region And Coronal Explorer (TRACE) taken in the 171 Å and 1216 Å passbands by Alexander & Fletcher (2000). In the 171 Å channel the ejected plasma was seen both in emission and absorption which suggests that simultaneously highly collimated hot and cold material was ejected along the magnetic field lines. An EUV jet from a new emerging active region (a large Bright Point) was analysed in simultaneous TRACE, EIT and CDS data by Lin et al. (2006). The authors found the plasma jet to emit in a wide temperature range from 10 000 K (He i) to 2.5 MK (Fe xvi, the upper temperature limit of their observations).
Hα surges are often associated with EUV and X-ray emissions showing the co-existence of cool (Hα) and hot ejections of plasma (Jiang et al. 2007 and references therein). Only recently, however, have the spatial and temporal relation of these emissions been studied in detail (Jian et al. 2007) during surge events in a plage area of an active region. The authors first observed the bright structures in TRACE 171 Å followed by the cooler Hα jet which they interpret as cooling of the hot plasma with a cooling time lasting about 6 – 15 min.
2 Observations
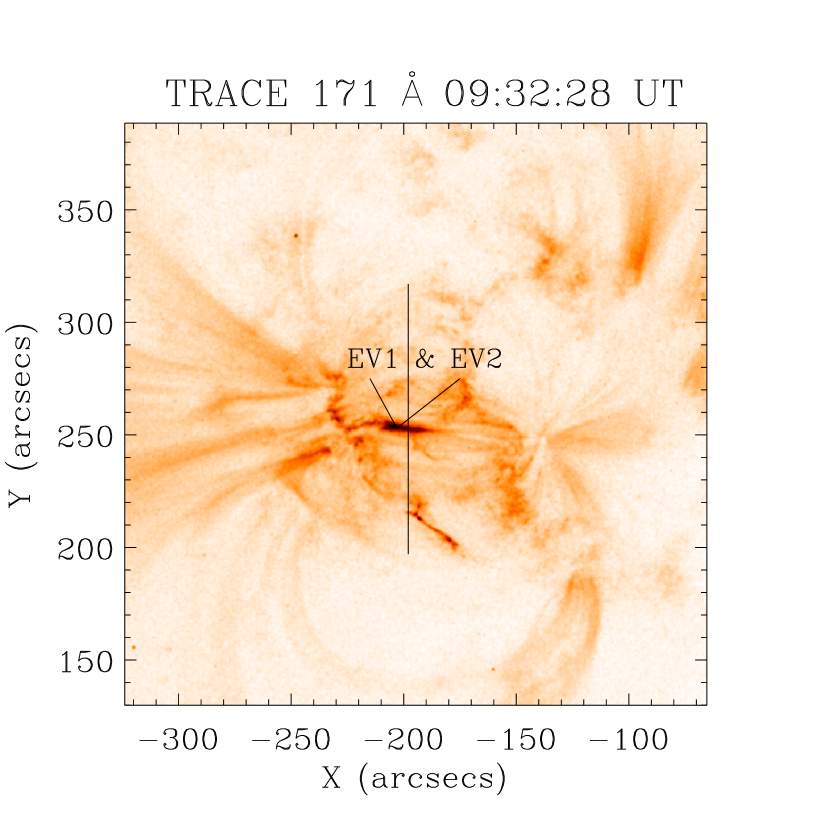
The events discussed here occurred in the active region NOAA 8558 on 1999 June 2. No flares were registered during the events. Simultaneous Solar Ultraviolet Measurements of Emitted Radiation (SUMER) telescope and TRACE observations were taken during several hours. The field-of-view (FOV) of the two instruments is shown in Figure 1. EIT Fe xii 195 Å single images for some of the events are also available, as well as a few SXT images. In the present letter only TRACE and SUMER data will be shown.
The SUMER spectrometer (Wilhelm et al. 1995, Lemaire et al. 1997) data were taken on 1999 June 2 starting at 09:17 UT and ending at 11:02 UT. A slit with a size of 03 120″ was used exposing for 25 s pointed at the plage area of the active region between two sunspots (Figure 1). Four spectral windows were telemetred, each with a size of 120 spatial 50 spectral pixels. The spectral lines read out are shown in Table 1. At the start of the observations the spectrometer was pointed at solar disk coordinates xcen = -217 ″(at 09:17 UT) and ycen = 257″. Subsequently, the observations were compensated for the solar rotation. The spectral analysis was made in respect to a reference spectrum obtained by averaging over the entire dataset.
The TRACE (Handy et al. 1999) data were obtained in the Fe ix/x 171 Å and 1600 Å passbands starting at 09:00 UT and finishing at 11:30 UT on June 2, 1999. The integration time was 2.9 s for the 171 Å passband and 0.3 s for 1600 Å. The 171 Å channel cadence was 10 s which increased to 15 s when an image in the 1600 Å channel was taken. From 09:18:38 UT until 09:32:28 UT only observations in the 1600 Å channel were taken.
The co-alignment of SUMER and TRACE observations (spatial resolution of 1.5″ and 1″, respectively) was done by using SUMER raster observations, taken just before the time series in the Si ii 1260.44 Å line which falls in the transmitted O v 629.73 Å spectral window, and TRACE 1600 Å images. The SUMER raster was obtained with 5 s exposure time and 0.37″ increment. The emission in the TRACE 1600 Å passband mainly comes from continuum emission, C iv, C i, and Fe ii. Note that the SUMER times mark the beginning of the exposures, while the TRACE times the end of the exposures.
3 Features analysis: temporal evolution, velocity and temperature
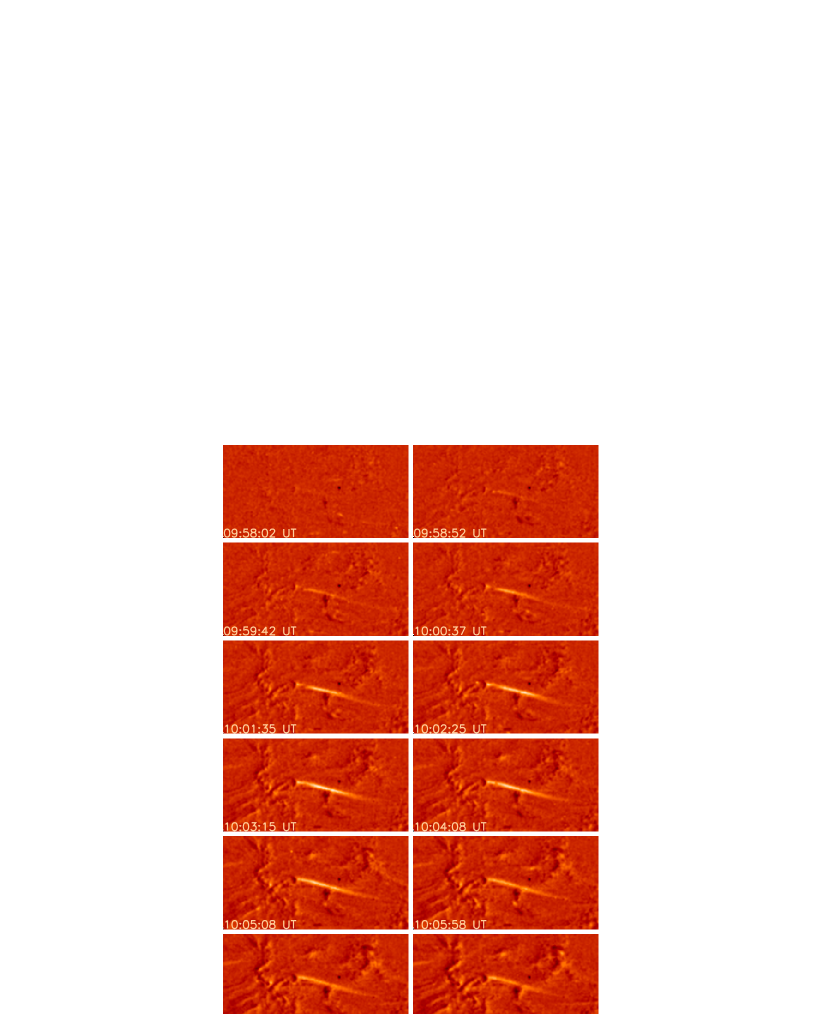
We identified three events in the SUMER data which we will call further in the text EV1, EV2 and EV3. Only EV3 was fully co-registered by SUMER and TRACE. Figure 2 demonstrates through a sequence of difference images the appearance of EV3 as a jet-like event in the TRACE images. The difference images were obtained by substracting an image taken at 09:55:49 UT. The entire lifetime of EV1 and EV2 is only seen in the SUMER data, while TRACE registered only the fading phase of these features.
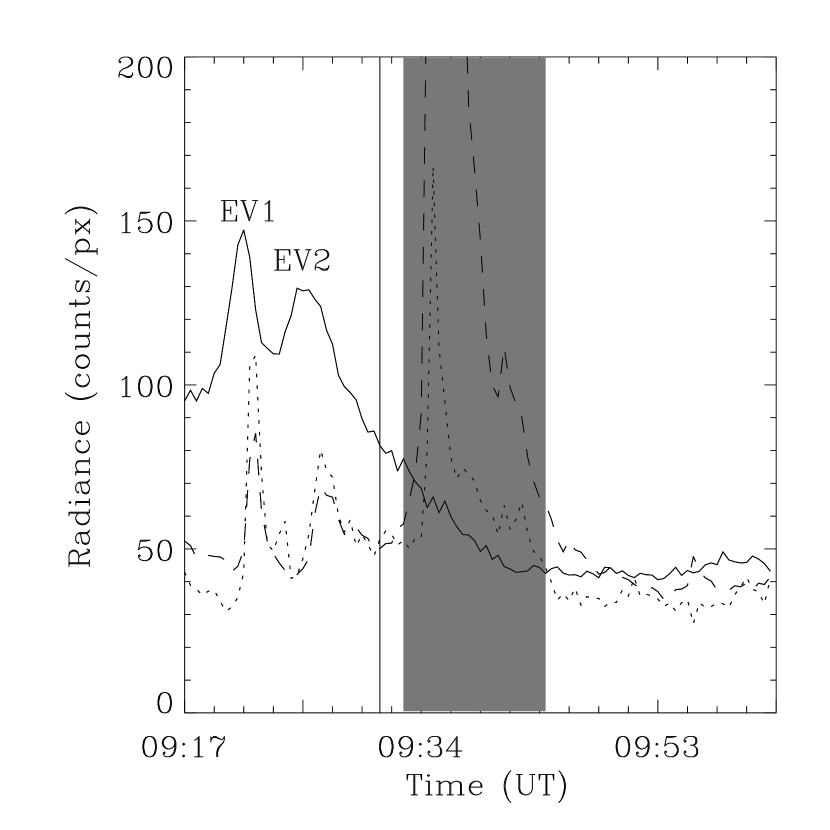
EV1 started at 09:20:29 UT (12 min before the first TRACE 171 Å image after the observing gap, see Section 2) with a sudden increase in the emission of the Mg x 625 Å line (Figure 3, left) coupled with a Doppler shift of up to 30 km s-1 to the red. This increase is seen over-imposed on the already relatively higher and red-shifted emission of the Mg x 625 Å line due to a pre-existing feature (not discussed in this paper). Around 2 min later, at 09:22:20 UT, the emission in O v 629 Å and N v 1238 Å started to increase rapidly as well, reaching a maximum around 75 s (three exposures) after the maximum in the Mg x 625 Å line. A strong red-shift is seen in the O v 629 Å line (up to 110 km s-1) and just a few km s-1 in the N v 1238 Å line.
The detailed study on the line profiles revealed that the feature started with a sudden large radiance increase of the rest component of the spectral lines and a red-shifted component. This suggests that an energy deposition took place followed by a collimated high velocity plasma flow. The heating process and the initial acceleration had a duration below the exposure time of 25 s. It took around 75 s for the three lines (Mg x, O V and Nv) to reach their maximum with the response in O v 629 Å and N v 1238 Å coming approximately 75 s (three exposures) later. That was followed by a further acceleration of the flow and simultaneous decrease of the emission at the rest component in less than a minute. We clearly see the cooling of the event as a delay in the response in O v 629 Å and N v 1238 Å (Figures 3 and 4). The feature had a stronger presence in the O v 629 Å and Mg x 625 Å lines and a modest response in the N v 1238 Å line with no signature at chromospheric temperatures, indicating a high electron density (Doyle et al. 2006a). Its lifetime was around 10 min. The Doppler shifts in the O v 629 Å line are in the range from 90 to 160 km s-1 derived from a double Gauss fit.
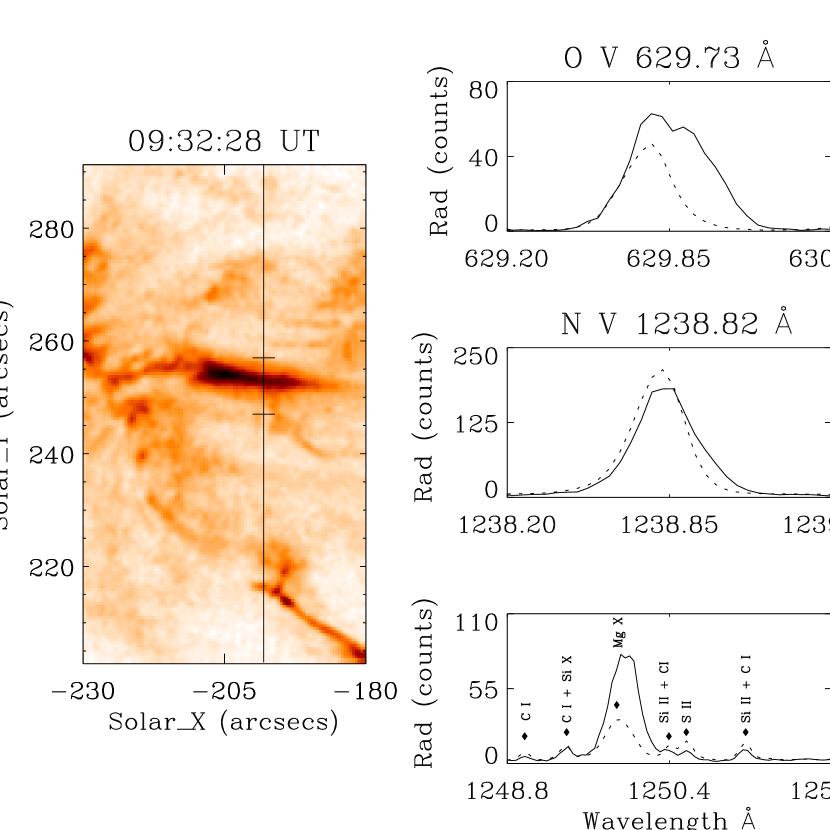
EV 2 started 5 min after EV1 around 09:25:05 UT appearing along the SUMER slit just above EV2. The maximum emission in the Mg x 625 Å line lasted during 3 exposures and the delay in the response of the transition region lines was again around 2 min. The first TRACE 171 Å image at 09:32:28 UT revealed a jet-like event (see Figure 1, left). The time of this image corresponds to the decaying phase of the features seen in the SUMER data (Figure 3, left). In the SUMER data at the start of EV2, it was still possible to separate both features along the slit. During the decaying phase, however, the events appeared as a single feature along the SUMER slit, and that is how they were seen in the first TRACE image at 09:32:28 UT (see Figure 1, left). In Figure 4 the TRACE 171 Å image taken at 09:32:28 UT and the time corresponding SUMER spectral line profiles during the events (EV1 & EV2) are shown. The features appeared as a radiance increase of the rest component of the O v 629 Å line (Figure 3) and a strong red-shifted component (Figure 4). The same is observed in the Mg x 625 Å line although the Doppler shift is smaller. No change in the emission of the chromospheric lines (Table 1) was observed. The width of EV2 is around 3″ derived from its projection along the SUMER slit.
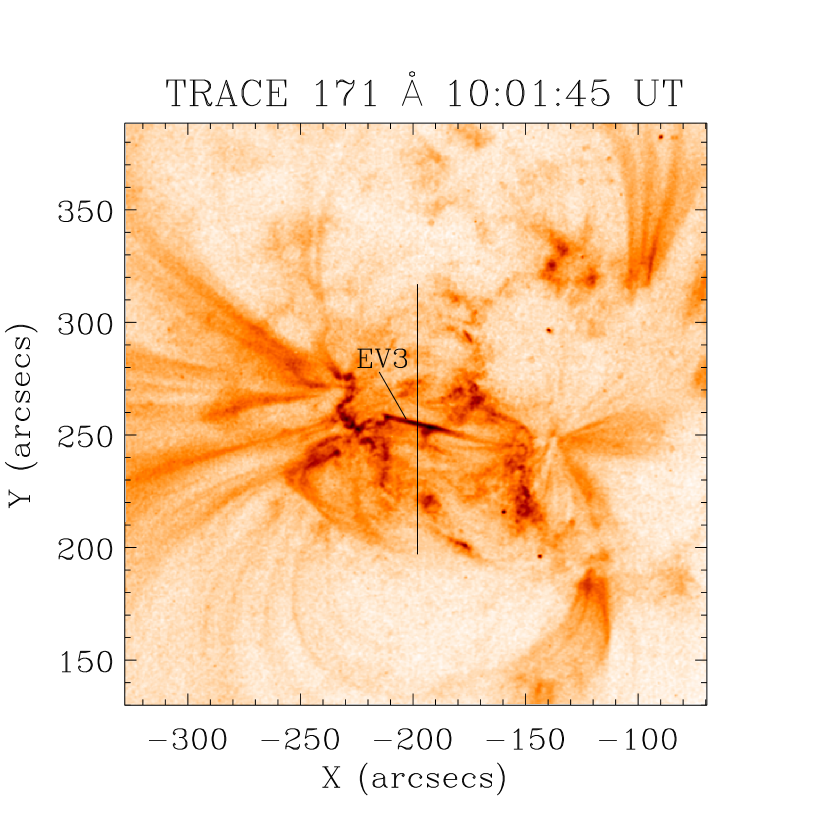
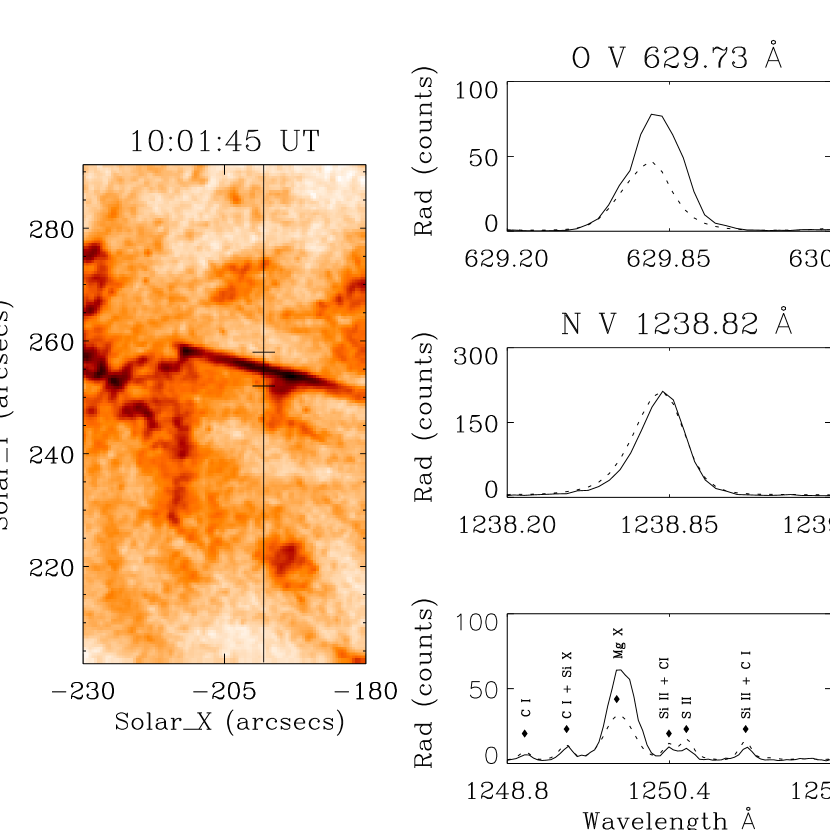
EV3 was registered during the observations starting at 09:59:52 UT with a width of 3″ (Figure 1, right). The temporal evolution of the amplitude of the radiance derived from a single Gauss fit in all three spectral lines can be seen in Figure 3 (right). In Figure 5 a TRACE 171 Å image and the time corresponding SUMER line profiles during EV3 are shown. The event showed the same temporal behaviour as the events described above and had a duration of around 15 min. As for EV1 and EV2 no response was found in the chromospheric emission.
In order to find out with more precision whether cold plasma exist during the events we studied the ratio of the continuum emission of the SUMER first and second order radiation. The first order emission (1238 Å) is above the H Lyman limit, while the second order (629 Å) is below. Second order emission will be absorbed by H i along the line-of-sight and the first order emission not (for details on the method see Innes et al. 2003). Therefore, the second- to first order ratio would show a decrease if cold material existed along the line-of-sight. The ratio did not show any changes which indicated that emission at low temperatures was not present. During all three events brightenings were observed in SXT and EIT Fe xii 195 Å data. Such brightenings were often observed in SXT data and their energetics is studied in detail by Shimizu (1995).
4 Discussion
This letter presents, to our knowledge for the first time, EUV transient features in an active region identified and analysed in on-disk SUMER data and simultaneously obtained TRACE images. These instruments provide data at highest existing (1.5″and 1″) spatial and 2 km s-1 spectral resolution (SUMER). Additionally, the combination of spectrometer and imager data obtained at high cadence (25 s and below) permitted the temporal and spatial evolution, velocities and especially temperatures of EUV active region transients to be derived with the highest possible precision. Three dynamic events were studied in spectral lines covering a temperature range from 104 to 106 K. All three features showed strong red-shifted emission in the O v 629 Å and Mg x 625 Å lines suggesting high velocity flows which propagate in a direction away from the observer, i.e. towards the solar surface. Considering the magnetic fields structure of the active region field by the loops seen in TRACE 171 Å, we suggest that the features although appearing with a jet-like structure in TRACE 171 Å images may rather represent a high velocity flow driven along a curved magnetic field, most probably a pre-existing loop. No signature of the events was found at chromospheric temperatures. Both EIT/Fe xii 195 Å and Yohkoh/SXT showed brightenings in a pixel row indicating the presence of a 1 to 3 MK plasma during the transients. The lower resolution of these instuments (6″) in comparison to TRACE (1″) do not permit the events to be identified as jets. The response in the transition region lines is delayed by around 2 min in respect to the coronal line suggesting cooling of the events. In the future hydrodynamic numerical simulations (see for detail Doyle et al. 2006b) will be performed with the results converted into observable quantities to be then compared with the present data. We believe that the capabilities of the Hinode mission will bring a better understanding on these features and, more important, the physical mechanism behind them.
References
- (1) Alexander, D. & Fletcher, L., 1999, Sol. Phys., 190, 167
- (2) Brekke, P., 1999, Sol. Phys., 190, 379
- (3) Doyle, J. G., Ishak, B., Madjarska, M. S., O’Shea, E. & Dzifćkaková, E., 2006a, A&A, 451, L35
- (4) Doyle, J. G., Taroyan, Y., Ishak, B., Madjarska, M. S. & Bradshaw, S. J., 2006b, A&A, 452, 1075
- (5) Handy, B. N., Acton, L. W., Kankelborg, C. C., et al., 1999, Sol. Phys., 187, 229
- (6) Innes, D. E., McKenze, D. E. & Wang, T., 2003, Sol. Phys., 217, 247
- (7) Jiang, Y. C., Chen, H. D., Li, K. J., Shen, Y. D. & Yang, L. H., 2007, A&A, 469, 331
- (8) Lemaire, P., Wilhelm, K., Curdt, W., et al., 1997, Sol. Phys., 170. 105
- (9) Lin, Ch.-H., Banerjee, D., O’Shea, E. & Doyle, J. G., 2006, A&A, 450, 1181
- (10) Madjarska, M. S., Doyle, J. G., Ishak, B. & Curdt, W., 2007, A&A, to be submitted
- (11) Mazzotta, P., Mazzitelli, G., Colafrancesco, S. & Vittorio, N., 1998, A&AS, 133, 403
- (12) Shibata, K., Nozawa, S. & Matsumoto, R., 1992, PASJ, 44, 265
- (13) Shimojo, M. & Shibata, K., 2000, ApJ, 542, 1100
- (14) Tsuneta, S., Acton, L., Bruner, M. et al., 1991, Sol. Phys., 136, 37
- (15) Wilhelm, K., Curdt, W., Marsch, E., et al.., 1995, Sol. Phys., 162, 189
| Ion | (Å) | log(T)max | Comment | |
|---|---|---|---|---|
| N v | 1238.82 | 5.3 | ||
| C i | 1248.00 | 4.0 | ||
| 1248.88 | blend | |||
| C i | 1249.00 | 4.0 | ||
| O iv/2 | 1249.24 | 5.2 | blend | |
| Si x/2 | 1249.40 | 6.1 | blend | |
| C i | 1249.41 | 4.0 | ||
| Mg x/2 | 1249.90 | 6.1 | ||
| O iv/2 | 1250.25 | 5.2 | blend | |
| Si ii | 1250.09 | 4.1 | ||
| Si ii | 1250.41 | 4.1 | ||
| C i | 1250.42 | 4.0 | blend | |
| S ii | 1250.58 | 4.2 | ||
| Si ii | 1251.16 | 4.1 | ||
| C i | 1251.17 | 4.0 | blend | |
| O iv/2 | 1251.70 | 5.2 | ||
| Si i | 1258.78 | 4.1 | ||
| S ii | 1259.53 | 4.2 | blend | |
| O v/2 | 1259.54 | 5.4 | ||
| Si ii | 1260.44 | 4.1 | ||
| ††footnotetext: Note: The expression /2 means that the spectral line was observed in second order. The comment ‘blend’ means that the spectral line is blending a close by line. The line formation temperatures are taken from CHIANTI v5.0 using the Mazzota et al. (1998) ionization equilibrium. |