Pareto law of the expenditure of a person in convenience stores
Abstract
We study the statistical laws of the expenditure of a person in convenience
stores by analysing around 100 million receipts. The density function of
expenditure exhibits a fat tail that follows a power law. We observe the
Pareto principle where both the top 25% and 2% of the customers
account for 80% and 25% of the store’s sales, respectively. Using the
Lorenz curve, the Gini coefficient is estimated to be 0.70; this implies a
strong economic inequality.
Keywords: Point of sale, Power law, Gini coefficient, Pareto principle.
pacs:
89.65.Gh, 05.45.DfI Introduction
For the last ten years, high-frequency databases of market prices and company’s wealth have been published. Physicists have investigated these databases in order to understand the dynamics of economy. They observed characteristics of fractal systems and chaotic behaviour in economic activities. For example, the probability density functions of market price fluctuations and company’s incomes both follow power laws [1–5].
Recently, huge point-of-sale (POS) databases containing detailed records of each purchase were published. The analysis of POS databases revealed that a probability density function of the expenditure of a person in a single shopping trip also follows a power law [6].
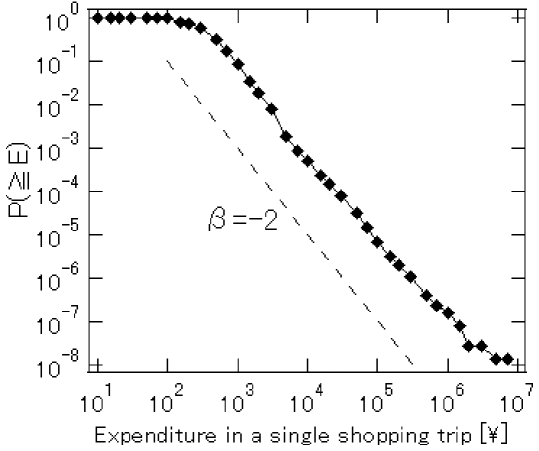
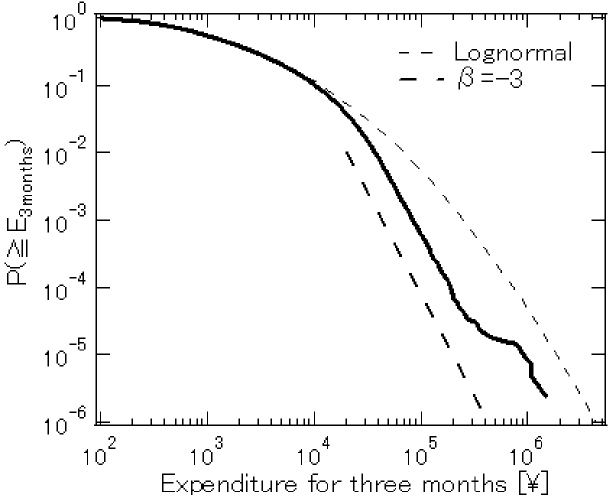
In this paper, we confirm that a density distribution function of the expenditure of a person in a single shopping trip follows a power law with an exponent of –2 by analyzing a huge POS dataset of a convenience store chain. The frequency of trips that the person makes to the store chain depends on the individual. In order to clarify the extent of dependence of the store’s sales on loyal customers, we analyze the expenditure of a person for three months. A density function of the expenditure exhibits a fat tail that follows a power law with an exponent -3. We observed that 80% of the store’s sales were accounted by approximately 20% of the customers. Often, such a 80/20 rule has been observed in economic phenomena; this was referred to as the Pareto principle. The Pareto principle is important in business strategies. We estimate the Gini coefficient by plotting the Lorenz curve for the expenditure of a person for three months and discuss the dependence of a store’s sales on loyal customers.
II Database
The convenience store is a small shop that typically sells drinks, magazines, and prepackaged foods such as rice balls and lunchboxes. Also, many stores sell toiletries and cigarettes. Often, they stock daily necessities and miscellaneous goods.
In this study, we analyzed a POS database in which a shopper’s history in a convenience store chain was recorded. The name of this chain is “am/pm Japan Co. Ltd.” This chain has around 1,000 stores in Japan. The receipt number, date, time, the Japan article number (JAN), Edy ID, etc. were recorded in the database. Every JAN identifies a particular product. The Edy card provided by bitWallet, Inc. in Japan is a prepaid rechargeable card. Every Edy card has a unique number in the following format—Edy ID. When a payment is made using the Edy card, the Edy ID gets recorded in the POS database that is stored on a server. Each customer’s history can be accessed through the recorded Edy ID; therefore, each customer’s contribution to the store’s profit can be ascertained.
We analyzed around 100 million receipts of all the customers of “am/pm Japan Co. Ltd” from January to March 2007. Out of all the receipts, 5% of them are records corresponding to shopping done using the Edy card.
III Expenditure of a person in a single shopping trip
Many people often buy lunch at a convenience store. Therefore, the average customer buys two food packets and one drink and spends around 400 yens. However, we can occasionally find high spending shoppers. For example, a young woman visited a store on December 28, 2006 at 9:28:35 AM, and bought 1,127 drinks and 2,254 sandwiches at 559,590 yens.
We show the distribution of the expenditure of a person in a single shopping trip by using about 100 million receipts in Fig. 1. The vertical axis, P (x), shows the cumulative probability in log scale, i.e., the probability of finding a person who spends more than x in a single shopping trip. It is found that the distribution has a fat tail that exhibits power law behaviour with an exponent of –2. The exponent is independent of the location of the store, the shopper’s age, and the time of the day [6].
IV Dependence of the store’s sales on loyal customers
In order to investigate the extent of dependence of the store’s sales on loyal customers, we analyzed the expenditure of a person for three months. We focussed on customers who paid using the Edy card. The expenditure of each customer for the three months can be calculated by searching the Edy ID in the POS database. Fig. 2 shows a cumulative density function of expenditure. This function can be approximated by a power law with an exponent -3 on the amount scale that is greater than yens. On the small amount scale the function follows a lognormal distribution.
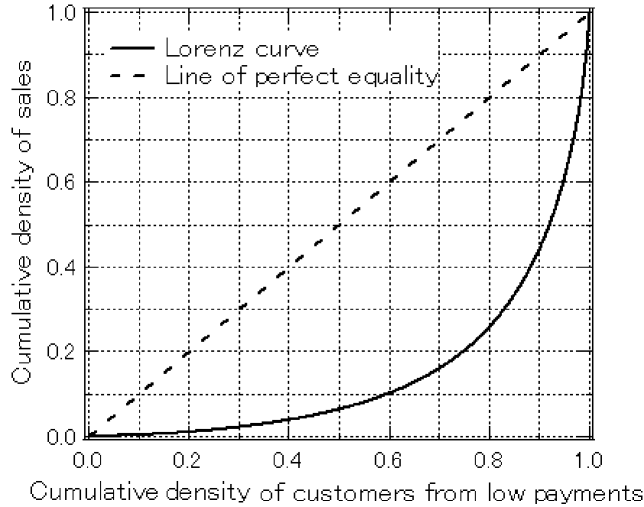
The Lorenz curve is one of the measures of social inequality in economics. We introduce the Lorenz curve that shows the bottom % of the customers and the corresponding % of the store’s sales. If every customer spends the same amount of money, the bottom N% of the customers would contribute to N% of the sales. In that case, the Lorenz curve is depicted by a straight line y = x. However, if only one customer purchased something from the store, the curve depicts a line of perfect inequality given by for all , and when .
Fig. 3 depicts the Lorenz curve of the customer’s payment and the store’s sales for three months. The curve is strongly convex downward implying that the store’s sales strongly depend on the loyal customers. We observe that both the top 25% and 2% of the customers account for 80% and 25% of the sales, respectively. This 80/20 rule is referred to as the Pareto principle. The original Pareto principle was related to wealth. It is well known that 80% of a country’s wealth is owned by 20% of the population. If the expenditure of a person in the convenience store depends on the person’s wealth, it is evident that the expenditure follows the 80/20 rule.
The Gini coefficient is often used as a measure of inequality of wealth distribution. Twice the area between the line of perfect equality, y = x, and the observed Lorenz curve gives an estimate of the Gini coefficient. The coefficient is zero when everyone’s expenditure is the same, and is one when only one person purchases everything from the convenience store chain. The Gini coefficient estimated from the Lorenz curve in Fig. 3 is 0.70. It is usually observed that the coefficient is less than 0.4 in a market economy. Therefore, the coefficient of 0.70 means that there is significant inequality in the store’s sales. From the coefficient, we can also find that the loyal customers contribute significantly to the store’s sales.
V Discussion
In this paper, we analyzed a huge point-of-sale database that has detailed records of each purchase. This data is the latest target of econophysics, following the “market price” and “company’s wealth.” It is confirmed that a density function of the expenditure of a person in a single shopping trip follows a power law with an exponent of –2. Such a power law is a commonly observed characteristic with regard to the market price and a company’s wealth.
We analyzed the expenditure of a person for three months. A cumulative density function of the expenditure exhibits a fat tail that follows a power law with an exponent -3. We investigated the extent of the dependence of the store’s sales on loyal customers by using the Lorenz curve and the Gini coefficient. We found that both the top 25% and 2% of the customers account for 80% and 25% of the store’s sales, respectively. A marketing strategy aimed at high-spending shoppers may be effective for convenience store chains because they contribute significantly to a store’s sales.
The statistical laws mentioned in this paper are often observed in various other economic phenomena. Analysis of a POS database may be useful for investigating the universal dynamics of the economic phenomena.
Acknowledgements.
This work is partly supported by Research Fellowships of the Japan Society for the Promotion of Science for Young Scientists (T. Mizuno.). The authors appreciate the cooperation of “am/pm Japan Co. Ltd” for providing the POS data.References
- (1) [1] T. Mizuno, S. Kurihara, M. Takayasu, and H. Takayasu, Physica A 324, 296–302, 2003.
- (2) [2] R. N. Mantegna and H. E. Stanley, Scaling behaviour in the dynamics of an economic index, Nature 376, 46–49, 1995.
- (3) [3] K. Okuyama, M. Takayasu, and H. Takayasu, Physica A 269, 125–131, 1999.
- (4) [4] H. Aoyama, Y. Nagahara, M-.P. Okazaki, W. Souma, H. Takayasu, and M. Takayasu, Fractals 8, 293–300, 2000.
- (5) [5] T. Mizuno, M. Takayasu, and H. Takayasu, Physica A 332, 403–411, 2004.
- (6) [6] T. Mizuno, in preparation.