22institutetext: European Southern Observatory, Karl-Schwarzschild-Str. 2, D-85748 Garching bei Munchen, Germany
33institutetext: INAF-Osservatorio Astronomico di Capodimonte, Via Moiariello 16, 80131 Napoli, Italy
RR Lyrae stars in Galactic globular clusters. VI. The Period-Amplitude relation.
Abstract
Aims. This work uses nonlinear convective models of RR Lyrae stars and evolutionary predictions of low-mass helium burning stellar structures to constrain the properties of cluster and field RR Lyrae variables. In particular, we address two problems: is the Period-Amplitude () plane of fundamental (RRab) variables a good diagnostic for the metal abundance? Is the (RR)-[Fe/H] relation of field and cluster variables linear over the whole metal abundance range of [Fe/H]2.5 to 0?
Methods. We perform a detailed comparison between theory and observations for fundamental RR Lyrae variables in the solar neighborhood and in both Oosterhoff type I (OoI) and type II (OoII) Galactic globular clusters.
Results. We show that the distribution of cluster RRab variables in the plane depends not only on the metal abundance, but also on the cluster Horizontal Branch (HB) morphology. We find that on average the observed pulsation parameter , connecting the period to the visual amplitude, increases when moving from metal-poor to metal-rich GGCs. However, this parameter shows marginal changes among OoI clusters with intermediate to red HB types and iron abundances [Fe/H], whereas its value decreases in OoII clusters with the bluer HB morphology, although these clusters are also the less metal-poor ones of the group. Moreover, at [Fe/H]=0.1 the OoI clusters present redder HB types and larger values than the OoII clusters. The RRab variables in Cen and in the solar neighborhood further support the evidence that the spread in [Fe/H], at fixed , is of the order of 0.5 dex. Using the results of synthetic HB simulations, we show that the plane can provide accurate cluster distance estimates. We find that the RRab variables in OoI and in OoII clusters with very blue HB types obey a well-defined (RR)- relation, while those in OoII clusters with moderately blue HB types present a zero-point that is mag brighter. Regarding field variables, we show that with [Fe/H]1.0 a unique (RR)- relation can be adopted, independently of the color distribution of the parent HB star population.
Conclusions. Current findings suggest that the distribution does not seem to be a robust diagnostic for the metal abundance of RRab variables. However, the same observables can be used to estimate the absolute magnitude of globular cluster and field RRab variables. Eventually, we show that over the metallicity range the (RR)-[Fe/H] relation is not linear but has a parabolic behavior.
Key Words.:
globular clusters – stars: evolution – stars: horizontal branch – stars: oscillations – stars: variables: RR Lyr1 Introduction
It has been far-back recognized that the properties of RR Lyrae variables provide firm constraints to investigate several important aspects of stellar evolution and cosmology. The calibration of the absolute visual magnitude (RR) as a function of the iron-to-hydrogen content [Fe/H] is generally used for distance determinations in the Local Group and the RR Lyrae-based distances provide an independent test for the Cepheid distance scale in nearby galaxies (Magellanic Clouds, M31, dwarf spheroidal galaxies) and for the calibration of secondary distance indicators such as the globular cluster luminosity function in more distant galaxies (see e.g. Di Criscienzo et al. 2006, and references therein). Moreover, the distance of RR Lyrae stars observed in globular clusters is a fundamental step to determine the absolute magnitude of the cluster main-sequence turn-off, which is the classical ”clock” to estimate the age of these ancient stellar systems.
Together with this traditional role for distance determinations, since the pioneering investigation by Preston (1959) it has also been suggested that the location of fundamental mode variables (RRab) in the Period-Amplitude () plane, i.e., in the so-called Bailey diagram, depends on the metal abundance. Among the more recent papers, we mention Alcock et al. (2000) who used the visual amplitude of RRab stars in the globular clusters M15 ([Fe/H]=2.1), M3 ([Fe/H]=1.6) and M5 ([Fe/H]=1.4) to get the calibration
and Sandage (2004) who determined
from field variables with spectroscopic [Fe/H] measurements. Although these Period-Metallicity-Amplitude relations present a large intrinsic indeterminacy of 0.35 dex, they were used by Alcock et al. (2000) to estimate a median metal content of [Fe/H]1.6 for a huge sample of RRab stars in the bar of the Large Magellanic Cloud (LMC), by Brown et al. (2004) to derive a mean metallicity of [Fe/H]=0.3 for the 29 RRab variables they identified in a halo field of M31, and by Kinemuchi et al. (2006) to study the properties of RR Lyrae stars in the solar neighborhood.
The suggested dependence of the Bailey diagram on the metal abundance accounts for the observational evidence that RRab stars in Oosterhoff type II globular clusters tend to have, for a given amplitude, longer periods than those in Oosterhoff type I clusters. Let us recall that according to the average period of their -type variables, the globular clusters are conventionally classified into two Oosterhoff groups: the former group (Oosterhoff type I: OoI) includes metal-intermediate clusters with 0.55 days, while the latter (Oosterhoff type II: OoII) includes metal-poor clusters with 0.65 days. However, one cannot neglect that OoII clusters show bluer horizontal branch (HB) star distributions than OoI clusters. Therefore the diagram, as already suggested by Clement & Shelton (1999), migth not depend on the metal abundance but on the evolutionary status of RR Lyrae stars.
From a theoretical point of view, it is widely accepted that the pulsation period is physically governed by the von Ritter relation ( is the stellar density and the pulsation constant) which yields that the pulsation period is a function of the pulsator mass , luminosity , and effective temperature . On this ground, since the earlier linear and adiabatic pulsation models, the relation, the so-called van Albada & Baker (1971, 1973) relation, has been at the basis of several investigations focussed on the estimate of RR Lyrae mass and luminosity. However, accurate predictions concerning the luminosity and the radial velocity variations along the pulsation cycle, and their dependence on the pulsator structural parameters, become available only with the modern nonlinear, convective approach (Stellingwerf 1984).
The purpose of the present investigation is to use the updated and detailed sets of nonlinear, convective models for fundamental (F) pulsators computed by our group (see Marconi et al. 2003 [Paper II]; Di Criscienzo, Marconi & Caputo 2004 [Paper III], and references therein) to investigate the relation for RRab variables. The theoretical scenario is discussed in Section 2, while Section 3 deals with the comparison with observations. The role of the Period-Amplitude diagram in the distance estimate of RRab variables is presented in Section 4 and the conclusions close the paper.
2 The physical meaning of the relation
The pulsation models used in the present paper have been computed with the nonlinear convective, hydrodynamical code which has already been described in previous investigations (see Paper II, Paper III, and references therein) and it will not be further discussed. We only wish to mention that the grid of models covers a wide range in stellar mass, luminosity, and chemical composition (see Table 1) and that the bolometric light curves of the models have been transformed into the observational plane by adopting the bolometric corrections and color-temperature transformations provided by Castelli et al. (1997a,b). This approach allows us to derive light-curve amplitudes and mean absolute magnitudes, either intensity-weighted or magnitude-weighted , for the various photometric bands.
| / | log | ||
|---|---|---|---|
| 0.24 | 0.0001 | 0.80 | 1.72, 1.81, 1.91 |
| 0.75 | 1.61, 1.72, 1.81 | ||
| 0.70 | 1.72 | ||
| 0.65 | 1.61 | ||
| 0.24 | 0.0004 | 0.70 | 1.61, 1.72, 1.81 |
| 0.24 | 0.001 | 0.75 | 1.71 |
| 0.65 | 1.51, 1.61, 1.72 | ||
| 0.255 | 0.006 | 0.58 | 1.55, 1.65, 1.75 |
The entire set of models pulsating in the fundamental mode shows a linear correlation between the bolometric amplitude and the pulsation period (logarithmic scale) in the sense that the amplitude decreases from short to long periods, at fixed mass and luminosity. Moreover, we found that the luminosity amplitude, at fixed period, increases as the stellar luminosity increases or as the stellar mass decreases, but to a lesser extent (see Fig. 3 in Paper II). In this context, it is worth mentioning that the pulsation limit cycle stability is also governed by the efficiency of convection as flux carrier in the stellar envelope, and in turn on the value of the mixing-length parameter adopted to close the system of convective and hydrodynamical equations. Note that the depth of the convective region increases when moving from higher to lower effective temperatures and that convection is the physical mechanism that quenches pulsation instability. As a consequence, the RR Lyrae models at constant stellar mass and luminosity show that an increase in the mixing-length parameter from =1.5 to 2.0 causes a systematic decrease ( K) in the effective temperature of the first overtone blue edge (FOBE) and the simultaneous increase in the effective temperature of both the blue edge (FBE, 100 K) and the red edge (FRE, 300 K) of fundamental pulsation. As a whole, the increase in the efficiency of the convective transport causes a narrowing of the width in temperature of the instability strip. On the other hand, the amplitude of fundamental pulsators reaches its maximum value close to the FBE and attains vanishing values close to the FRE. This yields that different assumptions concerning the mixing-length parameter affect the region of the instability strip where fundamental pulsators are pulsationally unstable, and in turn both the zero-point and the slope of the predicted Period-Amplitude relation.
Using the intensity-averaged magnitudes of fundamental pulsators with =0.0001-0.006, we find that the correlation between pulsation period, visual amplitude, magnitude, and mass (in solar units) is given by
for =1.5, and
for =2.0, where the rms dispersion of the fit is 0.025 dex. For the sake of the following discussion, let us emphasize that in these relations the pulsator mass and luminosity are free parameters.
According to these relations, the RRab distribution in the diagram is described by the pulsation parameter
or
which in turn depends on the pulsator evolutionary properties as
and

At variance with the pulsational parameters and , the values of the evolutionary ones and cannot be directly estimated from observations. However, all the synthetic horizontal branches (SHB) simulations (see, e.g., Demarque et al. 2000; Catelan et al. 2004; Cassisi et al. 2004, [Paper IV]) agree in suggesting that, for a fixed metallicity, the average mass of HB stars in the RR Lyrae region decreases when moving from red to blue HB morphologies, whereas the average luminosity presents an opposite trend. Furthermore, for a fixed HB morphology, an increase in the metal content causes a decrease in the same intrinsic parameters.
| (HB) | HB | (RR) | (RR) | ||
|---|---|---|---|---|---|
| =0.0001, =0.23 | |||||
| 0.68 | +0.960.01 | 0.700.02 | 0.350.02 | 0.0880.012 | 0.0800.012 |
| 0.70 | +0.900.02 | 0.710.03 | 0.380.01 | 0.1010.006 | 0.0940.006 |
| 0.72 | +0.830.02 | 0.730.03 | 0.410.01 | 0.1150.004 | 0.1080.006 |
| 0.74 | +0.740.02 | 0.750.03 | 0.420.01 | 0.1250.002 | 0.1190.002 |
| 0.76 | +0.620.03 | 0.770.03 | 0.440.01 | 0.1340.002 | 0.1280.002 |
| 0.78 | +0.430.03 | 0.790.03 | 0.450.01 | 0.1430.002 | 0.1380.002 |
| 0.80 | +0.150.01 | 0.810.03 | 0.460.01 | 0.1490.002 | 0.1440.002 |
| 0.82 | 0.090.02 | 0.820.02 | 0.460.01 | 0.1520.002 | 0.1480.002 |
| 0.84 | 0.190.02 | 0.840.02 | 0.460.01 | 0.1520.002 | 0.1480.002 |
| =0.0003, =0.23 | |||||
| 0.64 | +0.970.01 | 0.660.02 | 0.360.04 | 0.0840.030 | 0.0750.030 |
| 0.66 | +0.910.01 | 0.680.02 | 0.440.02 | 0.1170.008 | 0.1090.008 |
| 0.68 | +0.780.01 | 0.700.02 | 0.490.01 | 0.1420.004 | 0.1340.004 |
| 0.70 | +0.520.02 | 0.710.02 | 0.530.01 | 0.1610.002 | 0.1540.002 |
| 0.72 | +0.110.03 | 0.730.02 | 0.550.01 | 0.1700.002 | 0.1630.002 |
| 0.74 | 0.290.03 | 0.740.02 | 0.560.01 | 0.1740.002 | 0.1680.002 |
| 0.76 | 0.600.02 | 0.750.02 | 0.560.01 | 0.1760.002 | 0.1700.002 |
| 0.78 | 0.820.01 | 0.760.02 | 0.550.01 | 0.1760.002 | 0.1700.002 |
| =0.0006, =0.23 | |||||
| 0.62 | +0.970.01 | 0.650.02 | 0.370.03 | 0.0870.026 | 0.0780.026 |
| 0.64 | +0.890.01 | 0.660.02 | 0.480.02 | 0.1310.012 | 0.1220.012 |
| 0.66 | +0.700.02 | 0.680.02 | 0.530.01 | 0.1550.006 | 0.1470.006 |
| 0.68 | +0.280.03 | 0.690.02 | 0.570.01 | 0.1700.002 | 0.1620.002 |
| 0.70 | 0.240.02 | 0.700.02 | 0.580.01 | 0.1760.002 | 0.1680.002 |
| 0.72 | 0.690.02 | 0.700.02 | 0.590.01 | 0.1800.002 | 0.1720.002 |
| 0.74 | 0.910.01 | 0.710.02 | 0.590.01 | 0.1820.002 | 0.1740.002 |
| 0.76 | 0.980.01 | 0.720.02 | 0.590.01 | 0.1830.002 | 0.1760.002 |
| =0.001, =0.23 | |||||
| 0.60 | +0.980.01 | 0.640.01 | 0.410.06 | 0.099 0.040 | 0.0890.040 |
| 0.62 | +0.890.01 | 0.650.01 | 0.510.03 | 0.141 0.018 | 0.1320.018 |
| 0.64 | +0.640.02 | 0.660.01 | 0.580.02 | 0.170 0.008 | 0.1610.008 |
| 0.66 | +0.110.02 | 0.670.01 | 0.610.01 | 0.181 0.002 | 0.1720.002 |
| 0.68 | 0.440.03 | 0.670.01 | 0.620.01 | 0.188 0.002 | 0.1800.002 |
| 0.70 | 0.800.02 | 0.680.01 | 0.630.01 | 0.192 0.002 | 0.1840.002 |
| 0.72 | 0.960.01 | 0.680.01 | 0.630.01 | 0.194 0.002 | 0.1860.002 |
| =0.003, =0.23 | |||||
| 0.56 | +0.970.01 | 0.600.01 | 0.560.07 | 0.149 0.040 | 0.1380.040 |
| 0.58 | +0.840.02 | 0.610.01 | 0.680.03 | 0.198 0.020 | 0.1870.020 |
| 0.60 | +0.400.03 | 0.610.01 | 0.730.01 | 0.218 0.004 | 0.2080.004 |
| 0.62 | 0.250.03 | 0.620.01 | 0.760.01 | 0.227 0.004 | 0.2170.004 |
| 0.64 | 0.770.02 | 0.620.01 | 0.770.01 | 0.234 0.006 | 0.2230.006 |
| 0.66 | 0.970.01 | 0.620.01 | 0.780.01 | 0.236 0.008 | 0.2260.008 |
| =0.006, =0.245 | |||||
| 0.54 | +0.970.01 | 0.580.01 | 0.630.10 | 0.172 0.070 | 0.160 0.070 |
| 0.56 | +0.790.02 | 0.580.01 | 0.800.03 | 0.237 0.012 | 0.226 0.012 |
| 0.58 | +0.290.03 | 0.590.01 | 0.840.01 | 0.254 0.008 | 0.243 0.008 |
| 0.60 | 0.420.02 | 0.590.01 | 0.860.01 | 0.261 0.004 | 0.250 0.004 |
| 0.62 | 0.860.01 | 0.590.01 | 0.880.01 | 0.270 0.006 | 0.258 0.006 |
| 0.64 | 0.980.01 | 0.590.01 | 0.880.03 | 0.270 0.032 | 0.259 0.032 |
Using the SHBs computed in Paper IV for various chemical compositions, we show in Table 2 some selected predictions based on SHB simulations in which the number of predicted RR Lyrae stars approaches 2% of the global HB star population. For each assumed chemical composition and mean mass111The SHBs have been computed by assuming a gaussian random distribution of HB masses centered on (HB) and with a standard deviation . of HB stars, we give the average HB type222This parameter is the ratio (BR)/(B+V+R) among the numbers of HB stars to the blue (B), within (V) and to the red (R) of the RR Lyrae instability strip (Lee 1990). and the predicted mean values of the RR Lyrae mass, absolute magnitude, and parameter, together with the rms dispersion about the mean. Note that these mean values are derived by averaging the results of 10 different simulations.
Data listed in Table 2 (see also Fig. 1) disclose four substantial points:
-
1.
the mass range of the predicted RR Lyrae decreases with increasing metal content, when moving from very blue to very red HB type distributions;
-
2.
the parameter, at fixed metallicity, attains rather constant values from red to moderately blue HB morphology (i.e., for HB type ranging from 0.9 to +0.5), whereas it significantly decreases for the bluer populations;
-
3.
the parameter, at constant HB type, increases when moving from low to high metal abundances. However, for HB +0.9 the metallicity effect tends to vanish;
-
4.
the size of this metallicity effect varies with the metallicity range. In particular, for HB type 0 we get 0.03 for and 0.08 for .
In summary, the constraints on provided by the evolutionary predictions suggest that the distribution of RRab stars in globular clusters depends both on the cluster metal abundance and on the HB morphology.
3 Observed diagrams
3.1 Galactic globular clusters
| Name | HB | log | [Fe/H]K |
|---|---|---|---|
| Oosterhoff type II | |||
| N4590 (M68) | +0.44 | 0.201 | 2.43 |
| N6426 | +0.58 | 0.153 | 2.43 |
| N7078 (M15) | +0.67 | 0.189 | 2.42 |
| N5053 | +0.52 | 0.174 | 2.41 |
| N6341 (M92) | +0.91 | 0.195 | 2.38 |
| N5466 | +0.58 | 0.172 | 2.22 |
| N5024 (M53) | +0.81 | 0.189 | 2.02 |
| N6809 (M55) | +0.87 | 0.181 | 1.85 |
| N6333 (M9) | +0.87 | 0.203 | 1.79 |
| N7089 (M2) | +0.96 | 0.168 | 1.56 |
| Oosterhoff type I | |||
| N4147 | +0.55 | 0.282 | 1.79 |
| I4499 | +0.11 | 0.238 | 1.60 |
| N6934 | +0.25 | 0.252 | 1.59 |
| N3201 | +0.08 | 0.252 | 1.56 |
| N5272 (M3) | +0.08 | 0.257 | 1.50 |
| N7006 | 0.28 | 0.246 | 1.48 |
| N6715 (M54) | +0.75 | 0.237 | 1.47 |
| N6981 (M72) | +0.14 | 0.256 | 1.42 |
| N6229 | +0.24 | 0.270 | 1.41 |
| N6864 (M75) | 0.07 | 0.231 | 1.29 |
| N5904 (M5) | +0.31 | 0.263 | 1.26 |
| N1851 | 0.36 | 0.241 | 1.19 |
| N6121 (M4) | 0.06 | 0.275 | 1.15 |
| N6362 | 0.58 | 0.265 | 1.15 |
| N6723 | 0.08 | 0.262 | 1.11 |
| N6171 (M107) | 0.73 | 0.272 | 1.10 |
| Peculiar clusters | |||
| N5139 ( Cen) | +0.92 | 0.189 | 1.62 |
| N6441 | 0.73 | 0.132 | 0.85 |
| Name | HB | [Fe/H]K | ||
|---|---|---|---|---|
| Oosterhoff type II | ||||
| N4590 | +0.44 | 2.43 | 0.1810.026 | 0.1180.024 |
| N6426 | +0.58 | 2.43 | 0.1310.018 | 0.0680.017 |
| N7078 | +0.67 | 2.42 | 0.1840.030 | 0.1180.030 |
| N5053 | +0.52 | 2.41 | 0.1630.045 | 0.0950.036 |
| N6341 | +0.91 | 2.38 | 0.1440.026 | 0.0890.021 |
| N5466 | +0.58 | 2.22 | 0.1160.041 | 0.0630.031 |
| N5024 | +0.81 | 2.02 | 0.1370.029 | 0.0800.029 |
| N6809 | +0.87 | 1.85 | 0.1320.024 | 0.0770.018 |
| N6333 | +0.87 | 1.79 | 0.1300.017 | 0.0800.016 |
| N7089 | +0.96 | 1.56 | 0.1320.031 | 0.0730.033 |
| Oosterhoff type I | ||||
| N4147 | +0.55 | 1.79 | 0.2150.021 | 0.1640.025 |
| I4499 | +0.11 | 1.60 | 0.2090.036 | 0.1490.033 |
| N6934 | +0.25 | 1.59 | 0.2190.037 | 0.1600.031 |
| N3201 | +0.08 | 1.56 | 0.2110.042 | 0.1540.034 |
| N5272 | +0.08 | 1.50 | 0.1940.032 | 0.1420.027 |
| N7006 | 0.28 | 1.48 | 0.2220.027 | 0.1600.023 |
| N6715 | +0.75 | 1.47 | 0.2200.037 | 0.1570.032 |
| N6981 | +0.14 | 1.42 | 0.2440.035 | 0.1800.033 |
| N6229 | +0.24 | 1.41 | 0.2190.024 | 0.1640.019 |
| N6864 | 0.07 | 1.29 | 0.2010.059 | 0.1410.055 |
| N5904 | +0.31 | 1.26 | 0.2110.049 | 0.1560.048 |
| N1851 | 0.36 | 1.19 | 0.1980.040 | 0.1410.035 |
| N6121 | 0.06 | 1.15 | 0.1840.030 | 0.1420.034 |
| N6362 | 0.58 | 1.15 | 0.2180.030 | 0.1620.029 |
| N6723 | 0.08 | 1.11 | 0.2100.049 | 0.1550.042 |
| N6171 | 0.73 | 1.10 | 0.2390.043 | 0.1790.041 |
| Peculiar clusters | ||||
| N5139 | +0.92 | 1.62 | 0.1500.043 | 0.0920.052 |
| N6441 | 0.73 | 0.85 | 0.1060.025 | 0.0480.025 |
For the RR Lyrae stars in Galactic globular clusters for which the visual amplitude is available in the literature, Table 3 gives the observed HB type (Harris 2003)333http://physwww.physics.mcmaster.ca/%7Eharris/mwgc.dat), the average period of variables and the iron-to-hydrogen content [Fe/H]K on the Kraft & Ivans (2003) metallicity scale. For Cen, whose RR Lyrae stars are characterized by a wide spread in metal abundance, we list the average value ([Fe/H]=0.27) based on Rey et al. (2000) data and the HB type determined by Piersimoni et al. (2007, in preparation). As far as NGC 6441 is concerned, the HB type has been determined by Catelan (2005) although it should be mentioned that this cluster shows a very unusual HB extending from a stubby red to a very blue component (Rich et al. 1997). Moreover, the periods of the observed RRab variables are too long for the current cluster metallicity, thus hampering a safe Oosterhoff classification (see e.g. Pritzl et al. 2001).

Figure 2 shows the cluster HB type as a function of the metal content [Fe/H]K. It is worth noticing that even the selected sample of RR Lyrae-rich globular clusters presents the so-called second parameter problem: in order to account for the observed HB morphology, together with the metal abundance it is required a further intrinsic parameter. However, we also note that OoI and OoII clusters seem to follow quite different behaviors: the HB morphology of the OoI clusters becomes bluer as the metal content decreases, whereas for the latter group the HB morphology becomes bluer as the cluster becomes more metal-rich. As a consequence, the OoII clusters with very blue HB morphology, including Cen, appear to be the “natural” extension of OoI clusters to lower metal abundances.

Figure 3 shows the diagram of the observed RRab stars in OoII (top panel) and OoI (bottom panel) clusters. The variables in Cen and in NGC 6441 have not been included in this figure and will be discussed separately. The solid line in the top panel is the ridge line of variables in OoII clusters and it was drawn by adopting the predicted slope log0.189 [see Eq. (3)]. The same line is also plotted in the bottom panel to emphasize that RR Lyrae stars in OoI clusters present systematically shorter period, at fixed pulsation amplitude.
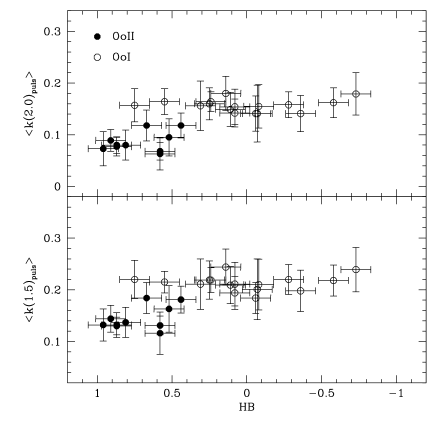

Based on the data plotted in Fig. 3, we derive the average and values listed in Table 4 together with the their standard deviations. Figures 4 and 5 show these parameters versus the cluster HB type and the metal content [Fe/H]K, respectively. In the latter figure, the OoII clusters are also selected according to the HB morphology.
As a whole, we find that:
-
•
among the OoI clusters, which have metal abundances from [Fe/H]=1.8 to 1.1 and HB types redder than +0.75, neither the nor the parameter show significant variations with [Fe/H] or HB type;
-
•
among the OoII clusters, which have metal abundances ranging from [Fe/H]=2.4 to 1.6 and HB types bluer than +0.44, both and present a mild decrease for the clusters with bluer HB morphologies, though they are also the less metal-poor ones of the group;
-
•
for [Fe/H]=0.1, where both OoI and OoII clusters are observed, the former clusters have redder HB types and larger values than the latter ones.
Bearing in mind the above discussion on the values listed in Table 2, the Bailey diagram of the RRab stars observed in Galactic globular clusters agrees with the evolutionary prescriptions and does not support the use of a unique relation for robust metal abundance determinations. The linear fit over the entire dataset plotted in the bottom panel of Fig. 5 gives [Fe/H]. This relation would predict the RRab metallicity with the unpleasant average uncertainty of 0.4 dex. The intrinsic error becomes even worse if the adopted empirical calibration relies on individual clusters. The use of OoI clusters together with OoII clusters with moderately blue HB morphology yields [Fe/H] (see the dashed line in the bottom panel of Fig. 5), while the use of OoI clusters together with OoII clusters with very blue HB morphology yields (see the dotted line) [Fe/H]. Note that the application of the former relation to RRab variables in OoII clusters with very blue HB stellar populations would underestimate by 0.7 dex the metallicity of these variables, while the application of the latter relation to RRab variables in OoII clusters with moderately blue HB stellar populations would overestimate by 0.5 dex the metallicity of the these variables.
3.2 NGC 6441 and Cen
Figure 6 shows the diagram of -type variables in NGC 6441 and Cen together with the ridge line of Oo II variables (see Fig. 3). Data plotted in this figure support the evidence that all the RRab stars in NGC 6441 behave as OoII variables (see also the and values listed in Table 4) suggesting that the RR Lyrae metal abundance is significantly lower than the current cluster value. This is at odds with the recent spectroscopic measurements by Clementini et al. (2005) confirming that the RR Lyrae stars in NGC 6441 are metal-rich with [Fe/H], on the Zinn & West (1984) scale (see also Gratton et al. 2007, and references therein) .

On the other hand, if the NGC 6441 variables are generated by the very blue HB component, we should expect small values even with large metal abundances. However, even adopting HB +0.97 the SHB simulations for =0.003 and 0.25 presented in Table 2 suggest 0.15 and 0.14 which are larger than the observed values. Since significantly depends on the pulsator luminosity, this discrepancy might imply a larger helium content, as recently suggested by Caloi & D’Antona (2007) who give 0.37. However, it is worth mentioning that star counts of HB and red giant branch stars in NGC 6441 provided by Layden et al. (1999) do not support the high helium abundance scenario. The new HB simulations with =0.30 (Caputo et al. 2007, in preparation) and the modeling of the observed light curves (Clementini & Marconi 2007, in preparation) will probably shed new lights on the unusual properties of the NGC 6441 RR Lyrae variables.


Regarding the variables in Cen, we plot in Fig. 7 the and values versus the [Fe/H]R metal abundance determined by Rey et al. (2000). We note again the quite large dispersion of the metallicity at constant , thus stressing once more the misleading use of the Bailey diagram for reliable metal abundance determinations. The comparison with the Galactic globular cluster data presented in Fig. 5, here repeated for the sake of clearness, indicates that the bulk of RRab stars in Cen behave as the variables in OoII clusters, with a minor fraction sharing the properties of the OoI variables (see also Clement & Rowe 2000). However, it is worth noticing that, consistently with the Cen HB type, the agreement with the OoII group mainly applies to clusters not very metal-poor and with very blue HB morphology ([Fe/H]2.2 and HB type +0.8, filled squares) since the values typical of the variables observed in clusters with very low metal abundance and moderately blue HB morphology (e.g., M15-like) seem to be absent. The lack of this kind of variables shows up quite clearly from Fig. 8 which shows the frequency distribution of the values in Cen (bottom) in comparison with those for OoI and OoII clusters. Note that this result, which holds also if the new metal abundances by Sollima et al. (2006) are adopted, cannot be explained by invoking a significant difference between the Kraft & Ivans (2003) and the Rey et al. (2000) metallicity scales. By using the Gratton et al. (2004) metal abundance [Fe/H]G determinations for RR Lyrae stars in NGC 1851, NGC 3201, and in NGC 4590 we get [Fe/H]0.48+0.65[Fe/H]K, while for Cen variables we derive [Fe/H]0.41+0.71[Fe/H]R. Eventually, we find [Fe/H] 0.1+1.1[Fe/H]R.


3.3 Field RRab stars
Figure 9 shows the diagram of RRab stars in the solar neighborhood for which [Fe/H] (Layden 1995,1998,2007, hereinafter [L07], private communication) and data (Nikolov, Buchantsova & Frolov 1984) are available. These stars are a mixture of OoII and OoI variables, with a further population at shorter periods than the OoI limit (see also the analysis of Kinemuchi et al. (2006) of a quite huge sample of field variables.) and [Fe/H]0.5. As a first test, we show in Fig. 10 the difference between the measured metal content [Fe/H]L and the calculated values [Fe/H]A from Eq. (1) and [Fe/H]S from Eq. (2). In both cases, the average difference is 0.3 dex, but the discrepancy for individual variables may be two or three times larger.


To repeat the procedure adopted for the variables in Galactic globular clusters, we have first verified that Eqs. (3) and (4) hold for fundamental RR Lyrae stars with 0.006. As shown in Fig. 11, our pulsation models constructed by adopting =1.5 and =0.01, 0.02 (Bono et al. 1997) suggest that the constant term in Eq. (3) changes as 0.136+0.06(log+2.22). On this ground, we determine the values plotted in Fig. 12. A glance at the data plotted in this figure discloses three relevant points:
-
•
the field stars, at constant , show a dispersion in iron abundance that might reach 0.5 dex.
-
•
The parameter steadly decreases, on average, when moving from [Fe/H] 0 to [Fe/H]2, but without any further decrease for the most metal-poor ([Fe/H]2.4) variables;
-
•
The behavior of field stars and Galactic globular clusters, in the metallicity range [Fe/H]=1.0 to 2.5, is quite similar. This finding supports the evidence for similar physical and evolutionary properties for field and cluster variables within this metallicity range.
-
•
There is a significant difference between the RRab variables in NGC 6441 and field variables with similar metal content.
4 Exploiting the diagram
4.1 Period-Amplitude-Magnitude relation for RRab stars
The circumstantial empirical and theoretical evidence discussed in the above sections brought into focus the deceptive use of the Bailey diagram of RRab stars to estimate metal abundances. Therefore we are now facing the question: is there any possibility to exploit its dependence on the evolutionary status of the variables?
It is well known that current updated HB models provide, for fixed helium and metal content, slightly different luminosity values which are due to different assumptions on input physics (see, e.g., Castellani 2003). On the contrary, the predicted mass of the RR Lyrae stars appears a more safe parameter, with an average variation of 2% among the various evolutionary prescriptions available in the recent literature. On this ground, it has already been shown in Paper II and Paper III that the coupling between the predicted relations inferred by the pulsation models, where mass and luminosity are free parameters, and the pulsator average mass suggested by SHB simulations provides a reliable “pulsational” route to the determination of the absolute magnitude of RR Lyrae stars in globular clusters with known metal content and HB morphology.

| Name | HB | [Fe/H]K | (RR) | ||||
|---|---|---|---|---|---|---|---|
| Oosterhoff type II | |||||||
| N4590 | +0.44 | 2.43 | 0.81 | 15.060.09 | 0.540.13 | 15.210.09 | 0.390.13 |
| N6426 | +0.58 | 2.43 | 0.80 | 17.750.07 | 0.420.11 | 17.900.06 | 0.270.11 |
| N7078 | +0.67 | 2.42 | 0.78 | 15.230.08 | 0.570.10 | 15.380.08 | 0.410.10 |
| N5053 | +0.52 | 2.41 | 0.81 | 16.070.10 | 0.500.11 | 16.230.10 | 0.340.11 |
| N6341 | +0.91 | 2.38 | 0.72 | 14.590.09 | 0.480.11 | 14.710.08 | 0.360.11 |
| N5466 | +0.58 | 2.22 | 0.77 | 16.060.09 | 0.400.11 | 16.190.07 | 0.270.11 |
| N5024 | +0.81 | 2.02 | 0.71 | 16.320.07 | 0.470.10 | 16.450.06 | 0.340.10 |
| N6809 | +0.87 | 1.85 | 0.69 | 13.850.07 | 0.470.11 | 13.980.05 | 0.350.11 |
| N6333 | +0.87 | 1.79 | 0.68 | 15.720.06 | 0.470.10 | 15.820.05 | 0.360.10 |
| N7089 | +0.96 | 1.56 | 0.66 | 15.460.09 | 0.480.13 | 15.590.09 | 0.360.13 |
| Oosterhoff type I | |||||||
| N4147 | +0.55 | 1.79 | 0.71 | 16.240.11 | 0.670.14 | 16.350.11 | 0.560.14 |
| I4499 | +0.11 | 1.60 | 0.70 | 16.990.08 | 0.660.10 | 17.130.07 | 0.520.10 |
| N6934 | +0.25 | 1.59 | 0.70 | 16.190.12 | 0.690.12 | 16.320.10 | 0.550.12 |
| N3201 | +0.08 | 1.56 | 0.70 | 14.080.13 | 0.670.13 | 14.210.12 | 0.540.12 |
| N5272 | +0.08 | 1.50 | 0.69 | 15.000.08 | 0.630.10 | 15.120.07 | 0.510.10 |
| N7006 | 0.28 | 1.48 | 0.70 | 18.110.14 | 0.690.15 | 18.240.14 | 0.550.15 |
| N6715 | +0.75 | 1.47 | 0.67 | 17.380.08 | 0.710.11 | 17.520.09 | 0.570.11 |
| N6981 | +0.14 | 1.42 | 0.68 | 16.100.11 | 0.760.15 | 16.240.11 | 0.620.15 |
| N6229 | +0.24 | 1.41 | 0.68 | 17.350.10 | 0.700.13 | 17.470.10 | 0.580.13 |
| N6864 | 0.07 | 1.29 | 0.67 | 17.020.15 | 0.660.16 | 17.150.18 | 0.520.16 |
| N5904 | +0.31 | 1.26 | 0.66 | 14.380.09 | 0.690.13 | 14.500.08 | 0.570.13 |
| N1851 | 0.36 | 1.19 | 0.66 | 15.400.12 | 0.650.12 | 15.520.11 | 0.530.12 |
| N6121 | 0.06 | 1.15 | 0.66 | 12.730.06 | 0.620.10 | 12.820.05 | 0.530.10 |
| N6362 | 0.58 | 1.15 | 0.66 | 14.560.06 | 0.710.10 | 14.680.05 | 0.580.10 |
| N6723 | 0.08 | 1.11 | 0.65 | 14.680.13 | 0.690.16 | 14.800.13 | 0.570.16 |
| N6171 | 0.73 | 1.10 | 0.65 | 14.910.14 | 0.760.15 | 15.040.13 | 0.630.15 |
Then, we estimate the average mass of RR Lyrae stars in the selected globular clusters using the SHBs listed in Table 2, under the hypothesis of scaled-solar chemical compositions. In order to transform the measured [Fe/H] value into the global metallicity , we adopt the solar value =0.0245 (Grevesse & Noels 1993) and =1 in the relation log=[Fe/H]1.73+log(0.638+0.362), where is the enhancement factor of -elements with respect to iron (Salaris et al. 1993). The predicted mass values, which have an intrinsic uncertainty of 2%, are listed in column (4) of Table 5 and, once inserted into Eqs. (3) and (4), they provide the visual distance moduli and and the RRab mean absolute magnitudes and given in columns (5)-(8) in the same Table.
Data plotted in Fig. 13, where the error bars are not drawn for the sake of clearness, show the direct consequence of the HB morphology-metallicity progression disclosed in Fig. 2: the RRab stars observed in OoII clusters with HB type bluer than +0.8 (filled squares) and in OoI clusters (open circles) obey a common relations between the absolute magnitude and the parameter, as given by
and
while for the RR Lyrae variables in OoII clusters with moderately blue HB morphology (filled circles) the zero-points of the above relations (dashed lines) are moderately brighter by 0.05 mag.
| [Fe/H] | (HB) | (RR) | (HB) | (RR) | log(RR) | |
|---|---|---|---|---|---|---|
| HB=+0.95 | HB=+0.95 | HB=0.95 | HB=0.95 | |||
| 0.002 | 0.96 | 0.58 | 0.620.02 | 0.69 | 0.650.03 | 0.2000.024 |
| 0.003 | 0.79 | 0.56 | 0.600.02 | 0.66 | 0.620.03 | 0.2170.021 |
| 0.004 | 0.66 | 0.55 | 0.590.02 | 0.65 | 0.610.02 | 0.2250.013 |
| 0.006 | 0.49 | 0.54 | 0.580.02 | 0.64 | 0.590.02 | 0.2340.010 |
| 0.008 | 0.37 | 0.53 | 0.560.01 | 0.63 | 0.580.01 | 0.2450.008 |
| 0.01 | 0.27 | 0.52 | 0.560.01 | 0.62 | 0.570.01 | 0.2490.007 |
| 0.02 | 0.03 | 0.51 | 0.540.01 | 0.58 | 0.550.01 | 0.2640.005 |
Regarding the field RR Lyrae stars, we do not know the morphology of the parent HB star distribution, but luckily enough we can take benefit by the well-known evidence that, for a fixed age, the predicted mass range of HB stars populating the RR Lyrae instability strip decreases with increasing the metal content. This is shown in Table 6, where the data already presented in Table 2 are implemented by new SHB results at =0.25 (Caputo et al. 2007, in preparation) based on Pietrinferni et al. (2004, 2006) HB models produced by RGB progenitor having an age of about 13 Gyr. Adopting [Fe/H]=1.73+log, a linear regression through the average values listed in the last column in this Table gives
with the intrinsic uncertainty given by log(RR)[Fe/H]. According to Eq. (3) and bearing in mind that with larger metal content than =0.006 the constant term varies as 0.136+0.06(log+2.22), we eventually derive that the absolute magnitude of RRab stars is given by
with [Fe/H]0.5 and by
with [Fe/H]0, with the magnitude total uncertainty varying as =0.070.02[Fe/H].
4.2 (RR)-[Fe/H] relation
Many calibrations of the RR Lyrae luminosity as function of the metal content have been published in the relevant literature (e.g., see Cacciari & Clementini 2003 for a summary) and the most recent ones suggest that the (RR)-[Fe/H] is nonlinear for metal abundances ranging from [Fe/H]0.5 to 2.4 (see Sandage 2006; Sandage & Tammann 2006, and references therein).


For our selected sample of Galactic globular clusters, Fig. 14 displays the -based mean absolute magnitude of RRab stars (columns (6) and (8) in Table 5) versus the cluster metallicity [Fe/H]K. The linear regression over the entire sample (solid line) yields a slope of 0.200.06 mag dex-1, regardless of the adopted mixing-length parameter, while the zero-point of the relation changes from 0.940.10 mag to 0.820.10 mag with =1.5 and 2.0, respectively. However, the data given in Table 5 clearly shows that at constant metal content the RR ab luminosity depends on the cluster HB type: e.g., the variables in NGC 7089 (HB=+0.96) are 0.2 mag brighter than those in IC 4499, NGC 6934 and NGC 3201, which show a HB type from HB=+0.08 to +0.25, yet all these clusters have nearly the same metallicity. This result is not a novelty since theoretical (see Paper IV and references therein) and observational studies (Lee & Carney 1999; Clement & Shelton 1999; Alves, Bond & Onken 2001) have already suggested that the RR Lyrae absolute magnitude depends on the cluster HB morphology and metal content.
The comparison with field RRab stars with [Fe/H]1.0 is shown in Fig. 15, where the absolute magnitudes of the field variables are determined by using Eqs. (8) and (9). It is quite clear that the linear (RR)-[Fe/H] relation provided by Galactic globular clusters is not suitable to the most metal-rich ([Fe/H]0.7) field variables. Conversely, we show in Fig. 16 that over the whole metallicity range of [Fe/H]=2.5 to 0 all the variables are nicely fitted by the quadratic relation


4.3 Which value of the mixing length parameter?
We have shown that the value of the mixing length parameter influences the zero-point of the Period-Amplitude-Magnitude relation [Eqs. (5) and (6)] and consequently the (RR)-[Fe/H] calibration (see Fig. 14).
In order to constrain the most appropriate value of the mixing-length parameter for globular cluster RRab stars, we show in Fig. 17 the magnitudes of RRab stars in Cen (Piersimoni et al. 2007, in preparation) versus the observed and parameters. By using Eqs. (5) and (6), we find a cluster intrinsic distance modulus of =13.680.10 mag and 13.800.10 mag, respectively. Unfortunately, both these estimates agree within 1 with the distance =13.75 mag based on the eclipsing binary OGLEGC-17 (Thompson et al. 2001; Kaluzny et al. 2002). Therefore, we decided to consider a further pulsational method, namely the FOBE method (Caputo 1997; Caputo et al. 2000) which provides the cluster apparent distance modulus by matching the observed distribution of the RRc variables in the -log plane with the predicted blue (hot) edge of the first-overtone instability region. The reason of this choice deals with the fact that the FOBE-based distance modulus (FOBE) is expected to decrease with increasing the mixing-length parameter (see Eq. (2) in Paper III), at variance with the apparent distance inferred from the relation.
Figure 18 shows the comparison between the two sets of distance moduli. We find that for =1.5 the (FOBE) distances are on average larger than those based on , whereas the opposite applies for =2.0. This evidence indicates that we can adopt 1.7, although the best solution discussed in Paper III is probably given by a mixing-length parameter that slightly increases when moving from the blue to the red side of the instability strip, i.e., from - to -type variables. In this context, it is worth noting that the very recent investigation by Ferraro et al. (2006) on red giant stars in globular clusters supports a value =2.0 for these cool stars and a negligible dependence on metallicity.
Finally, we note that the use of different scalings between the iron abundance and the global metallicity (-[Fe/H]) has marginal effects on the RRab absolute magnitudes listed in Table 5. As a matter of fact, by adopting =3 ([/Fe] 0.5) with =0.0245 yields, at fixed [Fe/H], smaller masses by 6%, and in turn fainter absolute magnitudes by 0.03 mag, when compared with the values listed in Table 5. The dependence on the adopted solar ratio is even smaller, and indeed by adopting =0.0165 (Asplund et al. 2004), the mass and magnitude variations for =1 are only +3% and 0.01 mag, while for =3 we estimate 3% and +0.01 mag, respectively.
5 Conclusions and final remarks
Hydrodynamical models of fundamental RR Lyrae stars computed by adopting metal content from =0.0001 to 0.006 and two different values of the mixing-length parameter (=1.5 and 2.0) provide detailed predictions concerning the pulsation parameters connecting the period with the -band amplitude. In order to investigate the distribution of cluster RRab stars in the diagram, we consider the following pulsational parameters
and
and we find that the average values and do not show significant changes among OoI clusters with metal abundances ranging from [Fe/H]=1.8 to 1.1 and intermediate to red HB types. On the other hand, the same parameters present a mild decrease among the OoII clusters with very blue HB types, even if these clusters are also the less metal-poor of the group. Moreover, in the relatively narrow metallicity range [Fe/H]=0.1, where both OoI and OoII clusters are observed, the former clusters have redder HB types and larger values than the latter ones.
A linear fit over the entire sample of globular clusters yields a [Fe/H]- relation with a large intrinsic dispersion of dex. The dispersion becomes even larger if the calibration relies on selected clusters: if we adopt a mix of OoI and OoII clusters with moderately blue HB morphology, then the metal abundance of RRab in clusters characterized by a very blue HB morphology will be underestimated by dex, whereas if we adopt a mix of OoI and OoII clusters with very blue HB morphologies the metallicity of RRab in clusters characterized by a moderately blue HB morphology will be overestimated by dex. This circumstantial evidence casts several doubts on the use of the distribution of RRab variables as a diagnostic of the metal abundance. This finding is independently supported by the sizable samples of RRab variables in Cen and and in the solar neighborhood for which are available metal abundance and band amplitudes. The distribution of these objects in the plane shows that the spread in metal abundance, at constant , is of the order of 0.5 dex.
By coupling pulsation models and synthetic horizontal branch simulations, we show that the pulsation parameter is a reliable distance indicator for globular clusters with known metal content and HB type. We wish to mention that the occurrence of a Period-Luminosity-Amplitude relation for RRab stars was originally suggested by Sandage (1981a,b) and that the present use of detailed evolutionary and pulsational predictions provides the opportunity to constrain the dependence on the globular cluster HB type and metal content. On this ground, we find that the RRab in OoI clusters and in OoII clusters with HB types bluer than +0.8 do obey to well defined - relations. In particular, we find
and
while the RRab in OoII clusters with moderately blue HB morphology present, at fixed , a zero-point that is 0.05 mag brighter. Regarding the variables in the solar neighborhood, additional pulsation models with =1.5 and 0.006 together with the predicted metallicity dependence of the mass of metal-rich ([Fe/H]1.0) RR Lyrae stars
yield
with [Fe/H]0.5 and
with [Fe/H]0.
Once the -based absolute magnitude (RR) is derived, the resulting correlation with the globular cluster metallicity [Fe/H]K has a slope of 0.200.06 mag dex-1, regardless of the adopted mixing-length parameter, while the zero-point changes from 0.940.10 to 0.820.10 mag when using pulsation models constructed by assuming a mixing length parameter =1.5 and =2.0, respectively. However, the inclusion of the metal-rich field variables yields that over the total metallicity range from [Fe/H]=2.5 to the relation becomes quadratic as
in agreement with the results presented by by Bono et al. (2003) and Sandage (2006).
Finally, in order to constrain the most appropriate value of the mixing-length parameter, we adopt the RRab stars in Cen, but the -based true distance moduli, =13.680.09 mag for =1.5 and 13.800.09 mag for =2.0, agree within 1 with the distance =13.75 mag based on the eclipsing binary OGLEGC-17 (Thompson et al. 2001; Kaluzny et al. 2002). Therefore, we adopt the FOBE method that provides cluster apparent distance moduli which decrease with increasing the mixing-length parameter. Eventually, we find that distance estimates based on the and on the FOBE method agree for an intermediate mixing-length parameter, namely 1.7.
Acknowledgements.
It is a real pleasure to thank H. Smith for several suggestions and a detailed reading of an early draft of this paper. We also warmly thank A. Layden for his valuable data on field RR Lyrae stars and his helpful comments. We also acknowledge the anonymous referee for his/her positive comments and suggestions that helped us to improve the readability of the manuscript. This work was partially supported by PRIN-INAF2005 (P.I.: A. Buzzoni), ”Galactic Stellar Populations”, by PRIN-INAF2004 (P.I.: M. Bellazzini), ”A hierarchical merging tale told by stars: motions, ages and chemical compositions within structures and substructures of the Milky Way”.References
- (1) Alcock, C., et al. 2000, AJ, 119, 2194
- (2) Alves, D. R., Bond, H. E., & Onken, C. 2001, AJ, 121, 318
- (3) Asplund, M., Grevesse, N., Sauval, A.J., Allende Prieto, C., & Kiselman, D., 2004, A&A, 417, 751A
- (4) Bono, G., Caputo, F., Cassisi, S., Incerpi, R., & Marconi, M. 1997, ApJ, 483, 811
- (5) Bono, G., Caputo, F., Castellani, V., Marconi, M., Storm, J., & Degl’Innocenti, S. 2003, MNRAS, 344, 1097
- (6) Brown, T. M., Ferguson, H. C., Smith, E., Kimble, R. A., Sweigart, A. V., Renzini, A., & Rich, R. M. 2004, AJ, 127, 2738
- (7) Cacciari, C., & Clementini, G. 2003, in Stellar Candles for the Extragalactic Distance Scale, ed. D. Alloin & W. Gieren, (Berlin: Springer-Verlag), LNP, 635, 105
- (8) Caloi, V., & D’Antona, F. 2007, A&A, 463, 949
- (9) Caputo, F. 1997, MNRAS, 284, 994
- (10) Caputo, F., Castellani, V., Marconi, M., Ripepi, V. 2000, MNRAS, 316, 819
- (11) Cassisi, S., Castellani, M., Caputo, F. & Castellani, V. 2004, A&A, 426, 641 [Paper IV]
- (12) Castellani, V. 2003, in New Horizons in Globular Cluster Astronomy, ed. G. Piotto, G. Meylan, S.G. Djorgovski, & M. Riello (San Francisco: ASP), 159
- (13) Castelli, F., Gratton, R. G., & Kurucz, R. L., 1997a, A&A, 318, 841
- (14) Castelli, F., Gratton, R. G., & Kurucz, R. L., 1997b, A&A, 324, 432
- (15) Catelan, M. 2005, in Resolved Stellar Populations, ed. D. Valls-Gabaud & M. Chavez (San Francisco, ASP), 123
- (16) Catelan, M., Pritzl, B. J. & Smith, H. A. 2004, ApJS, 154, 633
- (17) Clementini, G., Ripepi, V., Bragaglia, A., Fiorenzano, A. F. Martinez, Held, E. V., & Gratton, R. G. 2005, MNRAS, 363, 734
- (18) Ferraro, F. R., Valenti, E., Straniero, O., Origlia, L. 2006, ApJ, 642, 225
- (19) Clement, C. M., & Rowe, J. 2000, AJ, 120, 2579
- (20) Clement, C. M., & Shelton, I. 1999, ApJ, 515, L85
- (21) Demarque, P., Zinn, R., Lee, Y.-W., & Yi, S. 2000, A J, 119, 1398
- (22) Di Criscienzo, M., Caputo, F., Marconi, M., & Musella, I. 2006, MNRAS, 365, 1357
- (23) Di Criscienzo, M., Marconi, M.. & Caputo, F., 2004, ApJ, 612, 1092 [Paper III]
- (24) Gratton, R. G., Bragaglia, A., Clementini, G., Carretta, E., Di Fabrizio, L., Maio, M., Taribello, E. 2004, A&A, 421, 937
- (25) Gratton, R. G., Lucatello, S., Bragaglia, A. et al. 2007, A&A, 464, 953
- (26) Grevesse, N., & Noels, A. 1993, Physica Scripta, T47, 133
- (27) Harris, W. E. 1996, AJ, 112, 1487
- (28) Kaluzny, J., Thompson, I., Krzeminski, W., Olech, A., Pych, W., & Mochejska, B. 2002, in Cen, a Unique Window into Astrophysics, ed. F. van Leeuwen, J.D. Hughes, G. Piotto (San Francisco: ASP), 155
- (29) Kinemuchi, K., Smith, H. A., Wozniak, P. R., & McKay, T. A. 2006, AJ, 132, 1202
- (30) Kraft, R. P., & Ivans, I. I., 2003, PASP, 115, 143
- (31) Layden, A. C. 1995, AJ, 110, 2312
- (32) Layden, A. C. 1998, AJ, 115, 193
- (33) Layden, A. C., Ritter, L. A., Welch, D. L., & Webb, T. M. A. 1999, AJ, 117, 1313
- (34) Lee, Y.-W. 1990, ApJ, 363, 159
- (35) Lee, J.-W., Carney, B. W. 1999, AJ, 118, 1373
- (36) Marconi, M., Caputo, F., Di Criscienzo, M., & Castellani, M. 2003, ApJ, 596, 299 [Paper II]
- (37) Nikolov, N., Buchantsova, N., & Frolov, M. 1984, The Mean Light and Color (B-V and U-B) of 210 Field RR Lyrae Type Stars (Sofia: Astron. Council USSR Acad. Sci.)
- (38) Pietrinferni, A., Cassisi, S., Salaris, M., Castelli, F. 2004, ApJ, 612, 168
- (39) Pietrinferni, A., Cassisi, S., Salaris, M., Castelli, F. 2006, ApJ, 642, 797
- (40) Preston, G. W. 1959, ApJ, 130, 507
- (41) Pritzl, B. J., Smith, H. A., Catelan, M., & Sweigart, A. V., 2001, AJ, 122, 2600
- (42) Rey, S.-C., Lee, Y.-W., Joo, J.-M., Walker, A. R., & Baird, S. 2000, AJ, 119, 1824
- (43) Rich, R. M., et al. 1997, ApJ, 484, L25
- (44) Salaris, M., Chieffi, A., & Straniero, O. 1993, ApJ, 414, 580
- (45) Sandage, A. 1981a, ApJ, 244, L23
- (46) Sandage, A. 1981b, ApJ, 248, 161
- (47) Sandage, A. 2004, AJ, 128, 858
- (48) Sandage, A. 2006, AJ, 131, 1750
- (49) Sandage, A., & Tammann, G. A. 2006, ARA&A, 44, 93
- (50) Sollima, A., Borissova, J., Catelan, M., Smith, H. A., Minniti, D., Cacciari, C., & Ferraro, F. R. 2006, ApJ, 640, L43
- (51) Stellingwerf, R. F. 1984, ApJ, 284, 712
- (52) Thompson, I. B., Kaluzny, J., Pych, W., et al. 2001, AJ, 121, 3089
- (53) van Albada, T. S., & Baker, N. 1971, ApJ, 169, 311
- (54) van Albada, T. S., & Baker, N. 1973, ApJ, 185, 477
- (55) Zinn, R., & West, M. J. 1984, ApJS, 55, 45