H i and OH absorption in the lensing galaxy of MG J0414+0534
Abstract
We report the detection of H i 21-cm absorption in the early-type lensing galaxy towards MG J0414+0534 with the Green Bank Telescope. The absorption, with total , is resolved into two strong components, probably due to the two strongest lens components, which are separated by 0.4′′. Unlike the other three lenses which have been detected in H i, J0414+0534 does not exhibit strong OH absorption, giving a OH/H i column density ratio of (for K, K and ). This underabundance of molecular gas may indicate that the extreme optical–near-IR colour () along the line-of-sight is not due to the lens. We therefore suggest that despite the strong upper limits on molecular absorption at the quasar redshift, as traced by millimetre lines, the extinction occurs primarily in the quasar host galaxy.
keywords:
gravitational lensing – quasars: absorption lines – cosmology: observations – cosmology: early Universe – galaxies: ISM – galaxies: individual (MG J0414+0534)1 Introduction
Redshifted molecular and atomic absorption systems can provide excellent probes of the contents and nature of the early Universe. In particular, with redshifted radio and microwave lines we can investigate the gaseous content and large-scale structure, as well any possible variations in the values of the fundamental constants, at large look-back times. However, such systems are quite rare, with 65 H i 21-cm absorbers at currently known, comprising of 37 associated and 28 intervening systems. Three of these occur in gravitational lenses (Carilli et al., 1993; Chengalur et al., 1999; Kanekar & Briggs, 2003), all of which (PKS 0132–097, B2 0218+35, PKS 1830–211)111Note that there is also a possible second lensing system at towards the PKS 1830–211, detected in 21-cm (Lovell et al., 1996) but not molecular (Wiklind & Combes, 1998) absorption. have also been detected in molecular absorption, either through the 18-cm OH line (Chengalur et al., 1999; Kanekar & Chengalur, 2002; Kanekar et al., 2005) or a plethora of different molecules which absorb in the millimetre regime (Wiklind & Combes, 1995, 1998).
At , MG J0414+0534 is a heavily reddened galaxy (Lawrence et al., 1995), with a known intervening galaxy at (Tonry & Kochanek, 1999), which is responsible for the gravitational lensing (Schechter & Moore, 1993). However, the source of the reddening, whether in the lens or the host galaxy, is the subject of much debate: Tonry & Kochanek (1999) argue in favour of the host, as the lensing galaxy appears as a normal elliptical with a low dust content, while multi-component spectral analysis by Lawrence et al. (1995) places the dust in the lensing galaxy (an arrangement similar to PKS 1830–211). This may be supported by the fact that, while H i absorption with a column density of was found in the host galaxy (at ), HCN was undetected at cm-2 (Moore et al., 1999). This strong limit on the molecular gas abundance in the host suggests a correspondingly low dust content, thereby supporting the dusty lens hypothesis.
From extensive millimetre-wave observations of optically selected objects (see Curran et al. 2004 and references therein), combined with the data from the known molecular absorbers, Curran et al. (2006) concluded that there is a correlation between the OH 18-cm absorption line strength and the optical–near-IR () colour. This suggests that the reddening of these background sources is indeed due to dust, as traced by the molecular abundance. For the systems searched, molecular fractions of unity are reached for (figure 1 of Curran et al. 2006). MG J0414+0534 has (Lawrence et al., 1995), and since molecular absorption was not found in the host galaxy, the lensing galaxy is the ideal place to search for molecular absorption. In this Letter we report the results of our search for H i and OH absorption at towards J0414+0534.
2 Observations and Data Reduction
We observed the redshifted H i 21-cm line at 725 MHz toward J0414+0534 with the Green Bank Telescope222The National Radio Astronomy Observatory is a facility of the National Science Foundation operated under cooperative agreement by Associated Universities, Inc. (GBT) on 22 October, 2006 and 15 February, 2007. The four 18 cm OH lines were observed simultaneously with the 21-cm line during the 2006 observations. These were conducted in a single 200 MHz bandpass centered on 810 MHz in 5 min position-switched scans with spectral records recorded every 5 sec and a winking calibration diode firing during every other record. The total on-source integration time was 3,280 sec. The autocorrelation spectrometer used 3-level sampling in two (subsequently averaged) linear polarizations. Bandpasses were divided into 32,768 channels and hanning smoothed to 16,384 independent channels for a rest-frame velocity resolution of 5.0 km s-1 in H i and 4.2–4.5 km s-1 in the OH lines.
The 2007 observations were conducted in both 12.5 MHz and 50 MHz bandpasses in 5 min position-switched scans with spectral records recorded every 1.5 sec and a winking calibration diode firing during every other record. The total on-source integration times were 2,866 sec and 2,686 sec in the two bandpasses, respectively. The autocorrelation spectrometer used 9-level sampling in two (subsequently averaged) linear polarizations. Bandpasses were divided into 32,768 channels and hanning smoothed to 16,384 independent channels. The 12.5 MHz bandpass observations were 4-channel Gaussian smoothed such that both final spectra had a rest-frame velocity resolution of 1.26 km s-1.
For all observations, records were individually calibrated and bandpasses flattened using the calibration diode and the corresponding off-source records. Scans and polarizations were subsequently averaged, and a 5th-order polynomial baseline was fit over a 3 MHz range (three times that shown in Fig. 1) and subtracted. Systematic flux calibration errors in these data are of order . All data reduction was performed in gbtidl.
The bandpasses were heavily contaminated by radio frequency interference (RFI) and were far from flat, with the widest bandpass observations exhibiting the poorest baselines. At 725 MHz, the DC levels of individual scans showed significant fluctuations and the levels removed with baseline subtraction in the three final spectra spanned Jy. At 850 MHz, the continuum level of 4.24 Jy was not deemed to be reliable and so at this frequency we adopt the flux density of 3.28 Jy, obtained from Westerbork Synthesis Radio Telescope (WSRT) observations of this source (see Fig. 3). Applying a spectral index of and using the WSRT value, gives a flux density of 3.91 Jy at 725 MHz, close to our median value, which we adopt.
3 Results and Discussion
3.1 Observational results
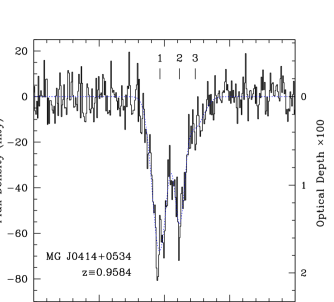
In Figs. 1 and 3 we show the reduced spectra of the H i and OH observations, respectively, where we see that for the H i detection a two component fit is required, with possibly a third required for the weak redshifted wing.
| Line | FWHM | Depth | ||||||
|---|---|---|---|---|---|---|---|---|
| 1 | 724.823(1) | 0.959658(4) | +193(31) | 27(1) | 68(2) | 0.0176(5) | 0.50(2) | |
| 2 | 724.749(2) | 0.959858(6) | +223(31) | 18(2) | 51(7) | 0.0131(18) | 0.25(4) | |
| 3 | 724.692(18) | 0.960013(49) | +247(31) | 31(14) | 14(2) | 0.0036(5) | 0.12(6) | |
| Total | 724.792(2) | 0.959743(6) | +205(31) | 49(2) | 82(6) | 0.0212(16) | 0.88(2) |
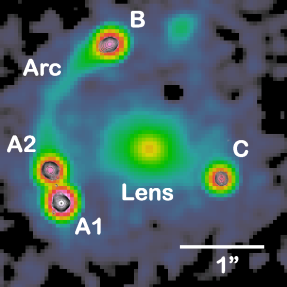
In Fig. 2, we show the -band image of J0414+0534, overlaid with high resolution radio contours. A1, A2, B & C are the lensed images of the background quasar, with the arc being the more extended galaxy hosting this. The arc exhibits no radio emission and is less obscured than the nuclear region hosting the AGN (see Sect. 3.2). The two main H i absorption peaks are probably due to A1 & A2, with the wide shallow absorption (3 in Table/Fig. 1), possibly associated with these main components or with the weaker B or C components. Due to their projected distance333 km s-1 Mpc-1, and . of up to kpc from the main components, while maintaining a velocity difference of (Table 1), it is unlikely that B or C are responsible for the redshifted wing apparent in the profile.
It is surprising that a passive early-type galaxy such as the lens galaxy would exhibit such high column densities (Table 1) in its outskirts. The significant velocity offset between the H i and the optical galaxy is suggestive of gas infalling to the lens galaxy (although the gas could be on the far side of the lens and be flowing away from the galaxy). There are several galaxies seen in the surrounding field (Angonin-Willaime et al., 1994) [albeit with no measured redshift], so there is also the possibility of a group interaction generating the gas streams.
If we assume, however, that the H i is bound to the lensing galaxy in an inclined disk, and that the absorption arises just from components A1 & A2, we can set restrictions on the location of the absorbing gas. The radio emission from these components lies at a projected distance of 10.1 kpc from the lens galaxy’s centre, just beyond the Einstein radius (Trotter et al., 2000). Falco et al. (1997) showed that this lens follows a deVaucouleurs surface brightness profile with an ellipticity of 0.20(2) and a position angle of 71∘(5). We find that there is no disk inclination that can reproduce the observed velocity gradient unless the position angle of the lens differs substantially () from that of the putative disk.
Assuming gravitational motion, we estimate the mass enclosed by the H i components 1 and 2 (as source images A1 and/or A2) from
where and are the projection angles of the gas velocity vector and source image-lens distance, respectively444 for velocity and distance vectors lying in the plane of the sky.. Hence, modulo unknown projection corrections, from the optical redshift of the lens M⊙ and M⊙, cf. the M⊙ obtained from the Einstein ring radius of Ros et al. (2000). The dominant statistical uncertainty is the optical redshift of the lens (rest frame , Sect. 1) and the dominant systematic uncertainties are the unknown projections of the H i velocity vectors and the lens-gas separation. These could easily boost the enclosed mass values by an order of magnitude if the plane of motion is close to face-on. Note that the total lens mass obtained from models by Ferreras et al. (2005) within 29.0 kpc (well beyond the Einstein radius) is M⊙. If the gas resides in a dark matter halo with a flat rotation curve, then our mass estimates would be a factor of larger at this radius. It is likely that is small and ; in this case, we require only that to match our mass estimates to those of Ferreras et al. (2005).

| Line | |||||||
|---|---|---|---|---|---|---|---|
| 1612 MHz | 822.0–823.4 | 0.9580–0.9614 | 4.4 | 2.6 | |||
| 1665 MHz | 848.6–850.1 | 0.9591–0.9625 | 4.3 | 4.1 | |||
| 1667 MHz | 850.7–851.3 | 0.9586–0.9600 | 4.3 | 5.2 |
3.2 The source of the reddening
Our 1667 MHz OH limit (Table 2), gives a velocity integrated optical depth limit of , per each 4.3 channel. However, the known 1667 MHz line profiles are generally much wider than this, therefore in order to obtain a meaningful column density limit, the optical depth limit must be integrated over a similar range. Since the line has not been detected, we have no knowledge of its width, although we do find a correlation between the H i and OH line widths for the known systems (Fig. 4). So from our H i detection, we estimate the OH line width to be FWHM .
Using this value significantly reduces (by a factor of 9) the sensitivity in terms of column density, although some is recovered by the fact that our data are at a much higher resolution than that required to detect such a wide line. Therefore for a comparable estimate of our limit, we multiply the velocity integrated optical depth by , giving the limit for a single channel “smoothed” to FWHMOH. This gives (), resulting in a normalised OH line strength of .
Curran et al. (2006) found a correlation between the normalised OH line strength and the colour (see Fig. 5). If this is reliable, the very low strength for J0414+0534 suggests that the dust causing the large amount of reddening is not coincident with the H i we see in absorption, and so is not located in the lens. The low HCN abundance, cm-2 (for K), at (Moore et al., 1999) appears to argue against the presence of significant quantities of dust in the host galaxy. However, this may not be the case. We note that a non-detection of a millimetre line does not necessarily imply an extremely low molecular abundance: Until the detection of OH absorption in the gravitational lens towards the “quintuple quasar” PKS 0132–097 (PMN J0134–0931), the HCO+–to–OH column density ratio of for Galactic clouds (Lucas & Liszt, 1996) was found to hold for all four of the known redshifted OH absorbers (Kanekar & Chengalur, 2002). However, although Kanekar et al. (2005) detected OH at a column density of , HCO+ was undetected to at a level. For a channel spacing of 5 , this gives cm-2 (for and K), i.e. .
For the four known millimetre absorbers, (Wiklind & Combes, 1995, 1996a, 1996b, 1997) and so a similar limit to that in 0132–097 could allow OH column densities of , or a normalised OH line strength of (cf. Fig. 5), in the nucleus of J0414+0534. The fact that a decimetre (OH) absorption could be detected, while millimetre (HCN) is not (as in 0132–097), could be due to geometry: A molecular cloud has a much larger chance of occulting the lower frequencies, since the emission region is larger, in fact close to the same size as the 21-cm emission region. However, for the more compact millimetre emission, the same molecular cloud has a much smaller likelihood of intervening this, and so, although OH may be readily detected, millimetre transitions are not necessarily seen along our line-of-sight.
From the lack of OH absorption in the lens we therefore suggest that most of the extinction does not occur here, but is intrinsic to the nuclear regions of the quasar host. This supports the results of:
-
•
Falco et al. (1997), who find that the optical arc, due to the more extended background galaxy (Fig. 2), is significantly bluer () than the A1/A2 & B images of the central AGN. Furthermore, Angonin-Willaime et al. (1999) find A2 to be the most obscured component. Although this could be due to the lens, the bluer arc again suggests that the differential extinction occurs across the AGN and its host galaxy.
-
•
Tonry & Kochanek (1999), who find that if the dust were in the lens, its distribution would have to be very uniform over the kpc span of the lensed images. Furthermore, a high extinction by the lens galaxy would double the galaxy’s luminosity, to the point were it would be an anomaly.
-
•
Elíasdóttir et al. (2006), who, from an analysis of the extinction curves, find the extinction to be high for an early-type galaxy and add the further possibility that some of the extinction is due to an, as yet, unidentified foreground object.
Note also that CO emission has also been detected at the host redshift, indicating a molecular gas mass of up to M⊙, where is the lensing magnification factor (Barvainis et al., 1998). Finally, the 21-cm velocity integrated optical depth in the host is times higher than in the lensing galaxy (giving , cf. , Table 1 and Moore et al. 1999, respectively). If the neutral gas in the lens and host share similar spin temperatures and covering factors, this would imply that , indicating denser gas, although in the absence of any knowledge of these two parameters such a conclusion is uncertain.
4 Summary
We have detected H i 21-cm, but not OH 18-cm, absorption in the gravitational lens towards MG J0414+0534. The H i profile is resolved into three components, at least two of which we believe are due to the lens components A1 & A2. From this, we estimate that the mass of the lens enclosed by the components is M⊙, consistent with previous results at low inclinations.
Although there was no detection, upon demonstrating a correlation between the full-width half maxima of the H i and OH profiles of other high redshift absorbers,we estimate that any OH associated with this system would have a FWHM . The optical depth limit of per 4.3 for the 1667MHz OH line, therefore translates into a minimum detectable OH column density of , giving a normalised OH line strength of .
According to the correlation of the molecular fraction with the optical–near-IR colour for the known redshifted molecular absorption systems (Curran et al., 2006), this extremely low ratio supports much of the published literature, which does not favour the lens as the cause of the extreme red colour of the background quasar. Although no molecular absorption at millimetre wavelengths was detected in the host, this does not preclude this as the source of the reddening, since, as in the case of PKS 0132–097, geometrical effects may be at play. This could be tested by searching for OH absorption in the host of J0414+0534.
Acknowledgments
We would like to thank the reviewer for their prompt and helpful report and Nissim Kanekar for the velocity integrated OH optical depths towards PKS 0132–097. This research has made use of the NASA/IPAC Extragalactic Database (NED) which is operated by the Jet Propulsion Laboratory, California Institute of Technology, under contract with the National Aeronautics and Space Administration. This research has also made use of NASA’s Astrophysics Data System Bibliographic Services.
References
- Angonin-Willaime et al. (1999) Angonin-Willaime M.-C., Vanderriest C., Courbin F., Burud I., Magain P., Rigaut F., 1999, A&A, 347, 434
- Angonin-Willaime et al. (1994) Angonin-Willaime M.-C., Vanderriest C., Hammer F., Magain P., 1994, A&A, 281, 388
- Barvainis et al. (1998) Barvainis R., Alloin D., Guilloteau S., Antonucci R., 1998, ApJ, 492, L13
- Carilli et al. (1998) Carilli C. L., Menten K. M., Reid M. J., Rupen M. P., Yun M. S., 1998, ApJ, 494, 175
- Carilli et al. (1992) Carilli C. L., Perlman E. S., Stocke J. T., 1992, ApJ, 400, L13
- Carilli et al. (1993) Carilli C. L., Rupen M. P., Yanny B., 1993, ApJ, 412, L59
- Chengalur et al. (1999) Chengalur J. N., de Bruyn A. G., Narasimha D., 1999, A&A, 343, L79
- Curran et al. (2004) Curran S. J., Murphy M. T., Pihlström Y. M., Webb J. K., Bolatto A. D., Bower G. C., 2004, MNRAS, 352, 563
- Curran et al. (2007) Curran S. J., Tzanavaris P., Pihlström Y. M., Webb J. K., 2007, MNRAS, submitted
- Curran et al. (2006) Curran S. J., Whiting M., Murphy M. T., Webb J. K., Longmore S. N., Pihlström Y. M., Athreya R., Blake C., 2006, MNRAS, 371, 431
- Elíasdóttir et al. (2006) Elíasdóttir Á., Hjorth J., Toft S., Burud I., Paraficz D., 2006, ApJS, 166, 443
- Falco et al. (1997) Falco E. E., Lehár J., Shapiro I. I., 1997, AJ, 113, 540
- Ferreras et al. (2005) Ferreras I., Saha P., Williams L. L. R., 2005, ApJ, 623, L5
- Kanekar & Briggs (2003) Kanekar N., Briggs F. H., 2003, A&A, 412, L29
- Kanekar et al. (2005) Kanekar N., et al., 2005, PhRvL, 95, 261301
- Kanekar & Chengalur (2002) Kanekar N., Chengalur J. N., 2002, A&A, 381, L73
- Kanekar et al. (2003) Kanekar N., Chengalur J. N., de Bruyn A. G., Narasimha D., 2003, MNRAS, 345, L7
- Katz et al. (1997) Katz C. A., Moore C. B., Hewitt J. N., 1997, ApJ, 475, 512
- Lawrence et al. (1995) Lawrence C. R., Elston R., Januzzi B. T., Turner E. L., 1995, AJ, 110, 2570
- Lovell et al. (1996) Lovell J. E. J., et al., 1996, ApJ, 472, L5
- Lucas & Liszt (1996) Lucas R., Liszt H., 1996, A&A, 307, 237
- Moore et al. (1999) Moore C. B., Carilli C. L., Menten K. M., 1999, ApJ, 510, L87
- Ros et al. (2000) Ros E., Guirado J. C., Marcaide J. M., Pérez-Torres M. A., Falco E. E., Muñoz J. A., Alberdi A., Lara L., 2000, A&A, 362, 845
- Schechter & Moore (1993) Schechter P. L., Moore C. B., 1993, AJ, 105, 1
- Tonry & Kochanek (1999) Tonry J. L., Kochanek C. S., 1999, AJ, 117, 2034
- Trotter et al. (2000) Trotter C. S., Winn J. N., Hewitt J. N., 2000, ApJ, 535, 671
- Wiklind & Combes (1995) Wiklind T., Combes F., 1995, A&A, 299, 382
- Wiklind & Combes (1996a) Wiklind T., Combes F., 1996a, Nat, 379, 139
- Wiklind & Combes (1996b) Wiklind T., Combes F., 1996b, A&A, 315, 86
- Wiklind & Combes (1997) Wiklind T., Combes F., 1997, A&A, 328, 48
- Wiklind & Combes (1998) Wiklind T., Combes F., 1998, ApJ, 500, 129