Preliminary measurement of at KLOE
Abstract
A preliminary measurement of at the KLOE experiment is discussed. The result, is based on 1.7 fb-1 of luminosity integrated on the -meson peak at the Frascati collider DANE, corresponding to 8000 observed events. Perspectives on the methods planned to improve both the statistical and the systematic errors are briefly outlined.
, , , , , , , , , , , , , , , , , , , , , , , , , , , , , , , , , , , , , , , , , , , , , , , , , , , , , , , , , , , , , , , , , , , , , , , , , , , , , , , , , ,
1 Corresponding author: Mario Antonelli INFN - LNF, Casella postale 13, 00044 Frascati (Roma), Italy; tel. +39-06-94032728, e-mail mario.antonelli@lnf.infn.it
2 Corresponding author: Tommaso Spadaro INFN - LNF, Casella postale 13, 00044 Frascati (Roma), Italy; tel. +39-06-94032698, e-mail tommaso.spadaro@lnf.infn.it
1 Introduction
A strong interest for a new measurement of the ratio has recently arisen, triggered by the work of Ref. 1. The SM prediction of benefits from cancellation of hadronic uncertainties to a large extent and therefore can be calculated with high precision. Including radiative corrections, the total uncertainty is less than 0.5 per mil [2]. Since the electronic channel is helicity-suppressed by the structure of the charged weak current, can receive contributions from physics beyond the SM, for example from multi-Higgs effects inducing an effective pseudoscalar interaction. It has been shown in Ref. 1 that deviations from the SM of up to few percent on are quite possible in minimal supersymmetric extensions of the SM and in particular should be dominated by lepton-flavor violating contributions with tauonic neutrinos emitted. Using the present KLOE dataset of 2.5 fb-1 of luminosity integrated at the -meson peak, we show that an accuracy of about 1 % in the measurement of might be reached.
In order to compare with the SM prediction at this level of accuracy, one has to treat carefully the effect of radiative corrections, which contribute several percent to the width. In particular, the SM prediction of Ref. [2] is made considering all photons emitted by the process of internal bremsstrahlung (IB) while ignoring any contribution from structure-dependent direct emission (DE). Of course both processes contribute, so in the analysis we will consider DE as a background which can be distinguished from the IB width by means of a different photon energy spectrum.
2 Experimental setup
DANE, the Frascati factory, is an collider working at GeV. mesons are produced, essentially at rest, with a visible cross section of 3.1 b and decay into pairs with a BR of %.
Kaons get a momentum of 100 MeV/ which translates into a low speed, 0.2. and decay with a mean length of 90 cm and can be distinguished by their decays in flight to one of the two-body final states or . Observation of a in an event signals, or tags, the presence of a and vice versa; highly pure and nearly monochromatic beams can thus be obtained and exploited to achieve high precision in the measurement of absolute BR’s.
The analysis of kaon decays is performed with the KLOE detector, consisting essentially of a drift chamber, DC, surrounded by an electromagnetic calorimeter, EMC. A superconducting coil provides a 0.52 T magnetic field. The DC [3] is a cylinder of 4 m in diameter and 3.3 m in length, which constitutes a fiducial volume for and decays extending up to and , respectively. The momentum resolution for tracks at large polar angle is %. The distribution of c.m. momenta reconstructed from identification of one-prong decay vertices in the DC shows a peak around the expected value with a resolution of 1–1.5 MeV, thus allowing clean tagging.
The EMC is a lead/scintillating-fiber sampling calorimeter [4] consisting of a barrel and two endcaps, covering 98% of the solid angle. The EMC is readout at both ends by photomultiplier tubes. The PM signals provide the energy deposit magnitude. Their timing provide the arrival times of particles and the three-dimensional positions of the energy deposits are determined from the signal at the two ends. The readout granularity is cm2, with 2440 “cells” arranged in layers five-deep. Cells close in time and space are grouped into a “calorimeter cluster.” For each cluster, the energy is the sum of the cell energies, and the time and position are calculated as energy-weighted averages over the fired cells. The energy and time resolutions are and 54 ps ps, respectively. The timing capabilities of the EMC are exploited to precisely reconstruct the position of decay vertices of to ’s from the cluster times of the emitted photons, thus allowing precise measurements of the lifetime.
In early 2006, the KLOE experiment completed data taking, having collected fb-1 of integrated luminosity at the peak, corresponding to 3.6 billion pairs. The preliminary result presented here is based on the analysis of 1700 pb-1.
A Monte Carlo (MC) data set was produced on a run-by-run basis, with luminosity scale factors equal to 1 for the main decay channels and 100 for decay channels with BR’s less than 10-4.
3 Event selection
Given the decay length of 90 cm, the selection of one-prong decays in the DC required to tag has an efficiency smaller than 50%. In order to keep the statistical uncertainty on the number of counts below 1%, we decided to perform a “direct search” for and decays, without tagging. Since we measure a ratio of BR’s for two channels with similar topology and kinematics, we expect to benefit from some cancellation of the uncertainties on tracking, vertexing, and kinematic identification efficiencies. Small deviations in the efficiency due to the different masses of electrons and muons can be evaluated using MC.
Selection starts requiring the presence of a one-prong decay vertex of a kaon track in a fiducial volume (FV) in the DC consisting of a track with laboratory momentum between 70 and 130 MeV, which can be extrapolated backward to a region near the interaction point, and a secondary track of relatively high momentum (between 180 and 270 MeV). The FV is defined as a cylinder parallel to the beam axis with length of 80 cm, and inner and outer radii of 40 and 150 cm, respectively. Quality cuts are applied using -like variables for the tracking of kaon and secondary particle and for the vertex fit. These requirements are referred to as the “one-prong selection” in the following.
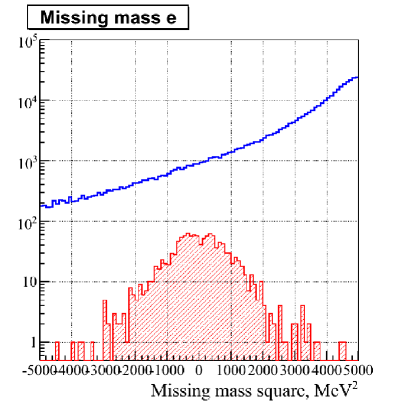
A powerful kinematic variable used to distinguish and decays from the background is calculated from the momenta of the kaon and the secondary particle measured in DC: assuming zero neutrino mass one can obtain the squared mass of the secondary particle, or lepton mass (). The distribution of is shown in Fig. 1 for MC events before and after quality cuts are applied. While the one-prong selection is enough for clean identification of a sample, further rejection is needed in order to identify events: the background, which is dominated by badly reconstructed events, is reduced by a factor of 10 by the quality cuts, but still remains 10 times more frequent than the signal in the region around the electron mass peak. The one-prong selection efficiency is for both channels, and the ratio of efficiencies for and is evaluated from MC to be: . A correction to this estimate accounting for possible differences in the tracking performance between data and MC is discussed in Sec. 5.

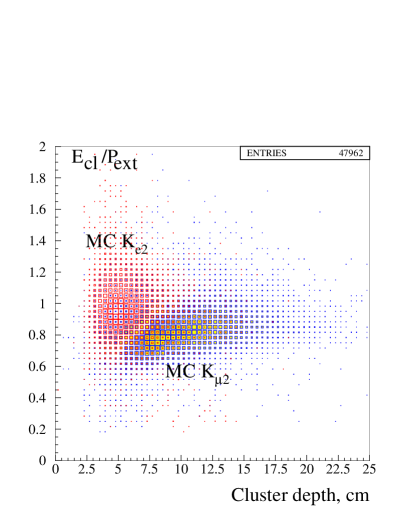
Information from the EMC is used to improve background rejection. The secondary track is extrapolated to a position on the EMC surface with momentum and associated to nearest calorimeter cluster satisfying the impact-parameter cut cm, where . For electrons, the associated cluster is close to the EMC surface so that its position projected along the track is only a few cm. Moreover, for electrons the cluster energy is a measurement of the particle momentum . Therefore the following condition is required in the plane vs (see Fig. 2):
| (1) |
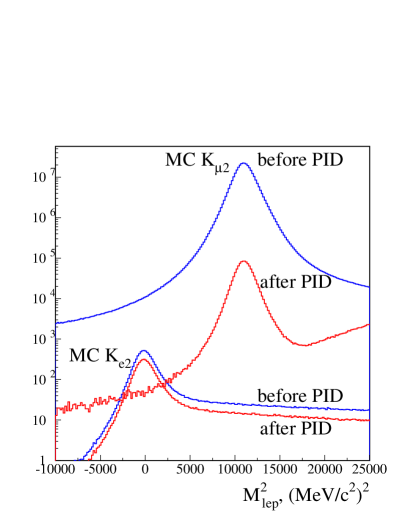
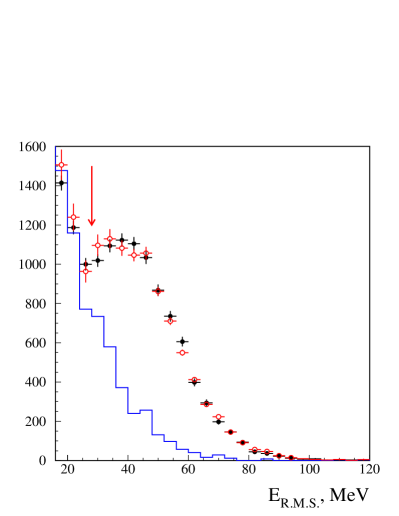
Electron clusters can be further distinguished from (or ) clusters by exploiting the granularity of the EMC: electrons shower and deposit their energy mainly in the first plane of EMC, while muons behave like minimum ionizing particles in the first plane while they deposit a sizable fraction of their kinetic energy from the third plane onward when they are slowed down to rest (Bragg peak). The particle identification (PID) was therefore based on the asymmetry of energy deposits between the second and the first planes hit, on the spread of energy deposits on each plane, on the position of the plane with the maximum energy, and on the asymmetry of energy deposits between the last and the next-to-last planes. Muon clusters with the signature , or cm, or are rejected.
The PID technique described above selects events with an efficiency and a rejection power for background of about 300. These numbers have been evaluated from MC. The effect of the improvement in background rejection obtained with PID is visible by comparing distributions before and after the PID is applied; see Fig. 3.

4 Event counting
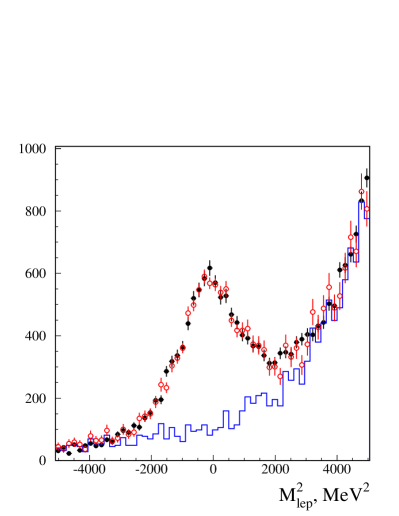
A likelihood fit to the two-dimensional vs distribution was performed to get the number of signal events. Distribution shapes for signal and background were taken from MC; the normalizations for the two components are the only fit parameters. The number of signal events obtained from the fit is . Projections of the fit results onto the two axes are compared to real data in Fig. 4.
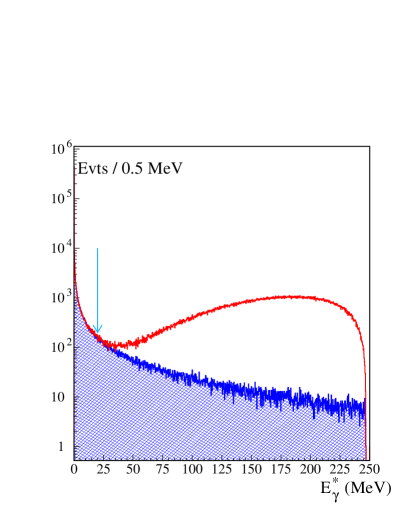
The primary generators for and decays include radiative corrections and allow for the emission of a single photon in the final state [5]. events with photon energy in the kaon rest frame MeV were considered as signal: as shown in Fig. 5, the DE contribution is indeed negligible in this range. The fraction of the IB component lying in the chosen energy range is determined from MC to be .
While evaluating the shape for , the present PDG value has been used for the ratio of IB and DE contributions: [6]. The fit has been repeated with different values of this ratio, varied within its range of uncertainty. This procedure gave a 0.45% error on the number of signal counts.
The number of events in the same data set is extracted from a similar fit to the distribution, where no PID cuts are applied in this case. The fraction of background events under the muon peak is estimated from MC to be less than one per mil. The number of events is 499 251 58435403.
5 Evaluation of
The following formula has been used to evaluate the ratio :
| (2) |
where and are the number of and observed events; and are the efficiencies for the one-prong selection for and decays, evaluated from MC; the correction to their ratio accounts for possible differences between the data and the MC prediction. The PID efficiency for events has been evaluated from MC, while a correction has been evaluated to account for possible discrepancies between data and MC in the description of PID variables. Trigger efficiencies were instead evaluated directly from data. The estimates of the above efficiencies and corrections are briefly discussed in the following section. Finally, is the fraction of the IB component accepted in the selection of events and has been evaluated from MC.
5.1 Evaluation of the efficiency for one-prong selection
The MC estimates for have been checked using a control sample of events. This sample has been selected by requiring a tagging two-body kaon decay in the DC and by identifying a secondary muon cluster coming from a decay of the other kaon. In this sample, the kaon decay vertex and the laboratory momentum of the emitted muon are evaluated using the information from the tag and from the selected cluster with resolutions of 5 cm and 13 MeV, respectively. We evaluated from this sample for both data and MC, as a function of the laboratory momentum of the secondary particle and the position of the one-prong vertex. Convoluting the data/MC ratio with the and kinematics, we get a correction for the ratio . Only 10 pb-1 have been used to obtain this estimate. The quoted statistical error will be reduced to a negligible level after processing of the entire statistics.
5.2 Evaluation of the efficiency for PID
In order to check the reliability of the MC for the efficiency estimate, a control sample (CS) of decays has been selected and used to compare data with MC. Using 600 pb-1 of integrated luminosity about 200k events with a purity of 99.7% have been selected. The ratio of data and MC PID efficiencies has been evaluated as function of the electron momentum and impact angle on the EMC, separately for the barrel and endcap parts of the EMC.
The correction for PID is where the first error is due to the statistics of the CS and the second is due to the incomplete kinematic coverage of the CS.
5.3 Evaluation of trigger efficiency ratio
The trigger efficiencies for and are evaluated from data, by comparing two almost independent trigger algorithms based on DC and EMC information. The correlation between these two triggers is topological in nature, and has been evaluated from MC. The dependence of the ratio of trigger efficiencies on the data taking period has been studied: the evaluated trigger efficiency ratio is stable well below the 1% level, and is independent of the run conditions. The ratio between the trigger efficiencies for the and processes is where again the first and second errors are statistical and systematic, respectively.
5.4 Result
Using the number of observed and events and all corrections as in Eq. 2, we get the preliminary result
| (3) |
This value is compatible within the error with the SM prediction,
6 Prospects for improvement
Three sources contribute to the present statistical uncertainty of 1.9%: fluctuation in the signal counts (1.1%), fluctuation in the background to be subtracted (0.7%), and statistical error on the MC estimate of the background (1.4%). The dominant source is the latter, because the selection efficiency for badly reconstructed events is lower in MC than in data, so that the MC background under the peak (the solid histogram of Fig. 4) had to be scaled by a factor of 4 to match the level of background in data.
Three improvements will be used to lower the statistical uncertainty on : first, a factor of 30% more data still have to be analyzed; second, MC production in progress will increase the MC statistics by a factor of two; third, various improvements will be performed to the selection algorithm in order to increase the background rejection power, at least by a factor of two.
The uncertainty on the PID efficiency is 1.75% and is the dominant contribution to the present systematic error. The CS statistics will be improved by a factor of four and additional studies of PID methods are needed to reduce the purely systematic contribution from 1.5% down to less than 1%. The current uncertainty on the one-prong selection efficiency is 0.9% and is dominated by the statistics of the control sample used (only 10 pb-1). Using additional statistics this error will be pushed down to below 0.5%. Additional studies of the data/MC agreement on trigger variables for reconstructed events are needed in order to increase the statistics of signal events for trigger efficiency evaluation.
Significant progress toward the 1% goal is expected to come from the use of an additional sample of events in which the kaon decays before the inner DC wall. These events can be selected using tag information, by extrapolating the kaon trajectory known from the tagging kaon from the IP to the point of closest approach with a secondary track reconstructed in the first layers of the DC. This method has been used and provides an additional 37% of events. The systematic studies on this selection algorithm have yet to be completed.
References
- [1] A. Masiero, P. Paradisi, and R. Petronzio, Phys. Rev. D74 (2006) 011701.
- [2] M. Finkemeier, Phys. Lett. B 387 (1996) 391.
- [3] KLOE Collaboration, M. Adinolfi, et al., Nucl. Instr. and Meth. A488 (2002) 51.
- [4] KLOE Collaboration, M. Adinolfi, et al., Nucl. Instr. and Meth. A482 (2002) 363.
- [5] C. Gatti, Eur. Phys. J. C45 (2005) 417, and references therein.
- [6] W.-M. Yao et. al., J. Phys. G 33 (2006) 1.