Low Star Formation Rates for Early-Type Galaxies in the Very Deep GOODS-MIPS Imaging: Implications for their Optical/Near-Infrared Spectral Energy Distributions11affiliation: Based on observations with the Hubble Space Telescope, obtained at the Space Telescope Science Institute, which is operated by AURA, Inc., under NASA contract NAS 5-26555 22affiliation: This work is based in part on observations made with the Spitzer Space Telescope, which is operated by the Jet Propulsion Laboratory, California Institute of Technology under NASA contract 1407.
Abstract
We measure the obscured star formation in early-type galaxies. This constrains the influence of star formation on their optical/near-IR colors, which, we found, are redder than predicted by the model by Bruzual & Charlot (2003). From deep ACS imaging we construct a sample of 95 morphologically selected early-type galaxies in the HDF-N and CDF-S with spectroscopic redshifts in the range . We measure their fluxes from the deep GOODS-MIPS imaging and derive the IR luminosities and star formation rates. The fraction of galaxies with detections () is . Of the 15 galaxies with significant detections at least six have an AGN. Stacking the MIPS images of the galaxies without significant detections and adding the detected galaxies without AGN we find an upper limit on the mean star formation rate (SFR) of , and on the mean specific SFR of . Under the assumption that the average SFR will decline at the same rate as the cosmic average, the in situ growth in stellar mass of the early-type galaxy population is less than between and the present. We show that the typically low IR luminosity and SFR imply that the effect of obscured star formation (or AGN) on their rest-frame optical/near-IR SEDs is negligible for of the galaxies in our sample. Hence, their optical/near-IR colors are most likely dominated by evolved stellar populations. This implies that the colors predicted by the Bruzual & Charlot (2003) model for stellar populations with ages similar to those of early-type galaxies () are most likely too blue, and that stellar masses of evolved, high-redshift galaxies can be overestimated by up to a factor of .
Subject headings:
galaxies: evolution—galaxies: active—galaxies: elliptical and lenticular—galaxies: fundamental parameters—galaxies: photometry—galaxies: starburst— infrared: galaxies1. INTRODUCTION
A convenient way to estimate stellar masses of galaxies is through modeling their spectral energy distributions (SEDs) with stellar population models (e.g., Worthey, 1994; Vazdekis et al., 1996; Bruzual & Charlot, 2003; Maraston, 2005). This is the most efficient method to quantify the stellar mass function at high redshift (e.g., Kauffmann et al., 2004; Drory et al., 2004; Förster Schreiber et al., 2004; Rudnick et al., 2006; Borch et al., 2006). The robustness of this method relies on the reliability of the assumed model parameters, such as the star formation history. The correctness of the models, given the star formation history and other parameters, is an obvious requirement as well.
With the advent of the Infrared Array Camera (IRAC, Fazio et al., 2004) on the Spitzer Space Telescope (Werner et al., 2004) the rest-frame near-infrared (near-IR) has become a commonly used part of the SED to infer stellar masses of galaxies. However, especially in the near-IR different stellar population models differ from each other (Maraston, 2005), which indicates that there might be systematic biases in such mass estimates. In van der Wel et al. (2006a) we used IRAC imaging of a sample of early-type galaxies at in the GOODS-South field with dynamically measured masses in order to infer the evolution of the rest-frame near-IR of early-type galaxies between and the present. We compared this with the evolution of the rest-frame optical and the predictions from several stellar population models. We found that the near-IR of the galaxies are lower (or, the rest-frame colors redder) than predicted by, for example, the model by Bruzual & Charlot (2003) for a range of model parameters. This indicates that stellar mass estimates inferred from near-IR photometry suffer from significant systematic uncertainties (van der Wel et al., 2006b).
The most straightforward interpretation of this result is that the model colors are too blue, but this depends on the assumption that the stellar populations of early-type galaxies are simple and can be well described by a single burst stellar population. If we add a significant population of young, heavily obscured stars ( in mass), then we would reconcile the observations with the Bruzual & Charlot model (van der Wel et al., 2006b). Moreover, such a high level of obscured star formation could account for the observed increase of the stellar mass density of red sequence galaxies between and the present (Bell et al., 2004; Faber et al., 2005; Borch et al., 2006; Brown et al., 2006). Hence, determination of the star formation rate is interesting and relevant in its own right. Recently, Rodighiero et al. (2007) showed through pan-chromatic SED modeling that, indeed, a significant fraction of the early-type galaxy population at shows signs of hidden activity.
In this paper we construct a sample of morphologically selected early-type galaxies with spectroscopic redshifts at , and measure (upper limits of) their fluxes with the Multiband Imaging Photometer for Spitzer (MIPS, Rieke et al., 2004) on the Spitzer Space Telescope (Sec. 2). We use these to constrain their star formation rates (SFRs) and the increase of their stellar masses with cosmic time in Sec. 3. Then we proceed, in Sec. 4, to test the hypothesis that the rest-frame optical/near-IR colors of early types are significantly affected by obscured star formation or Active Galactic Nuclei (AGN), and can explain the observed red colors. We summarize our conclusions in Sec. 5. Throughout the paper we adopt the concordance cosmology, .
2. SAMPLE SELECTION AND MULTI-WAVELENGTH PHOTOMETRY
We select galaxies with spectroscopic redshifts and early-type morphologies from Hubble Space Telescope/Advanced Camera for Surveys (HST/ACS) imaging from the Great Observatories Origin Deep Survey (GOODS, Giavalisco et al., 2004) in the Chandra Deep Field-South (CDF-S) and the Hubble Deep Field-North (HDF-N). Several spectroscopic surveys conducted in the CDF-S (Le Fèvre et al., 2004; Mignoli et al., 2005; van der Wel et al., 2005; Vanzella et al., 2006) are combined to give 381 spectroscopic redshifts in the range . Similarly, the compilation from Wirth et al. (2004) and the fundamental plane study by Treu et al. (2005) are combined to give 404 redshifts in the same redshift range in the HDF-N.
Early-type galaxies are morphologically distinguished from late-type galaxies by fitting Sersic models to the F850LP (hereafter, ) GOODS images of all galaxies using the technique developed by van Dokkum & Franx (1996). The best fitting -parameter was determined for every galaxy, with an integer, 1, 2, 3 or 4. The asymmetry , the fraction of the total flux not situated in the point-symmetric part of the light distribution, was also determined for each object. The criteria used to select early-type galaxies are , , , and . The latter three criteria are chosen upon visual inspection of the images and the residuals of the fits. The limit excludes galaxies that are poorly fit by any model, and the requirement excludes galaxies that are very compact and for which the shape of the light distribution cannot be reliably inferred. The majority of the galaxies satisfying these criteria have early-type morphologies as visually determined, but a small number of Sa galaxies with clear spiral structure and compact galaxies with small-scale irregularities, most likely mergers, are rejected upon visual inspection. The sample contains 95 early-type galaxies with E+S0+S0/a morphologies, with in the classification scheme of Postman et al. (2005). Total -band magnitudes are derived from the fitted profiles. PSF-matched ACS and GOODS IRAC images are used to measured rest-frame colors within diameter apertures, as described by van der Wel et al. (2006a). Even though the used spectroscopic surveys are neither complete nor necessarily representative for the galaxy population, there is no reason to assume that our morphologically selected sample has a bias in favor of or against early-type galaxies with obscured star formation or AGN. Therefore, we can assume that our sample is representative for early types as far as their IR properties are concerned.

We use the GOODS MIPS images111http://data.spitzer.caltech.edu/popular/goods/Documents/goods_dr3.html to obtain photometry for our sample of 95 early-type galaxies. Six galaxies turn out to be located in areas with exposure times less than 10% of the deepest parts of the images. We henceforth exclude these objects from the analysis, such that we have a final sample of 89 early-type galaxies. The publicly available catalogs from the GOODS team222http://www.stsci.edu/science/goods/ are used as a reference to verify our own photometry, which we push deeper than than the flux limit from the GOODS catalogs. This limit is a trade-off between completeness and the number of spurious detections, but since we already know the positions of our objects, deeper photometry is justified. Deeper photometry is necessary because Bell et al. (2005) already concluded that the vast majority of early-type galaxies at are not detected down to , an upper limit that is too conservative for our goals.
We determined the two-dimensional background across the image with the Sextractor software (Bertin & Arnouts, 1996), using the global background setting. We subtracted this background to obtain an image with background set to zero. Following, e.g., Papovich et al. (2004) and Zheng et al. (2006), we produce composite PSF-images for both fields, comprised of isolated stars (identified in the ACS images), which we use to create model images of MIPS sources at the positions of the galaxies in our sample and objects in their vicinity. The IRAC images are used as a reference to identify these sources and pinpoint their positions333The GOODS ACS, IRAC and MIPS images are registered to the same world coordinate system with high accuracy, with virtually no systematic offset () and a rms of in the difference between the centroid positions of bright MIPS sources and their IRAC counterparts, such that uncertainties therein do not affect our measurements. The total flux of an object is inferred from the PSF fitting model. By default, the positions of the sources are left as free parameters, however, in case of obviously erroneous results, we fix the positions at the IRAC positions. This is necessary for very low sources. In all cases, IRAC and ACS images are used to visually identify the counterpart of sources. This procedure gives robust flux measurements for 83 out of 89 galaxies in our sample, of which 15 have a significant fluxes, with a signal-to-noise ratio of at least two. For six galaxies we cannot produce reliable measurements because the centers of the low objects cannot be defined sufficiently accurate to identify their counterparts with any confidence. We label these objects as ’possibly misidentified’.
The photometric error is dominated by noise and the uncertainty in the background level. In addition we include a 5% error due to the uncertainty in the aperture correction and a 2% error due to the uncertainty in the absolute photometric calibration.
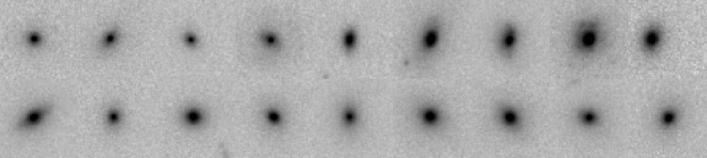
10 of the galaxies with the brightest MIPS counterparts are also found in the GOODS catalogs. The total fluxes as listed in the GOODS catalogs agree within with the values that we derive, except for one confused object for which we determined an accurate flux measurement with the deconvolution method described above. As an a posteriori verification of our morphological classification methodology we show ACS -band cutout images of nine of these galaxies in Fig. 1, together with nine randomly selected galaxies without significant MIPS counterparts: even the IR-bright galaxies in our sample are genuine early types, as far as their optical morphologies are concerned. We conclude that our morphological selection criteria described above are sufficiently stringent to exclude all late-type galaxies.
We list the measured fluxes in Table 1, and in Fig. 2a we show the redshift distribution of our sample. The mean redshift is . The shaded regions in Fig. 2a show the galaxies with MIPS counterparts. The lightly shaded regions indicate the six galaxies with possibly misidentified MIPS counterparts. The fraction of galaxies in our sample with MIPS counterparts (typically ) is . If we adopt the brighter flux limit of , the limit used for the GOODS MIPS catalogs, we find . In Fig. 2b we show the flux distribution. The typical flux of the objects with significant detections is , and ranges from up to almost . As mentioned above, most galaxies in the sample have no significant counterparts. For those galaxies the flux levels, i.e., the photometric error, are shown.
3. CONSTRAINTS ON THE STAR FORMATION RATE
We use to constrain the bolometric infrared luminosity and SFR. Papovich et al. (2006) have shown that this is feasible with reasonable accuracy. First, given , we compute for and for . With the conversions from Chary & Elbaz (2001) (Equations 4 and 5) we estimate the associated values for the bolometric infrared luminosity . We introduce a -correction by interpolating between the values for inferred from and to obtain at the observed redshift of each object. The -correction is generally small (typically 10%) since all redshifts are in the range . Finally, assuming a Salpeter IMF, is converted into a SFR as (Kennicutt, 1998).
The systematic uncertainties in the derived and SFR are considerable. According to Chary & Elbaz (2001) the uncertainty in the transformation of into is of order 50%. Furthermore, as noted by Papovich et al. (2006), the models by Dale & Helou (2002) yield that are lower by a factor of 2-3 for the most luminous objects (). For less luminous objects, like the objects in our sample, the differences are smaller, therefore we adopt a systematic uncertainty of 50%. Finally, the conversion of into SFR is uncertain by about 30%, such that the total uncertainty in the derived SFR is a factor of two.
We have 15 galaxies with significant and secure detections, six of which have X-ray counterparts (Alexander et al., 2003), with total X-ray luminosities in the range , which most certainly means that these galaxies harbor type 2 AGN. This is corroborated by the fact that in all cases at least half of is due to hard X-rays.
Assuming that the flux of the other nine galaxies is due to dust heated by star formation, we find SFRs ranging from 5 to 80 . The IRAC colors of the two galaxies with SFR exceeding 50 are consistent with the colors of a star-forming galaxy, and, moreover, in the rest-frame UV F435W and F606W ACS filters these galaxies clearly show irregular morphologies. We stress, however, that, according to their rest-frame optical morphologies, these galaxies are genuine early-type galaxies with of the -band flux accounted for by a smooth De Vaucouleurs profile (see Fig. 1).
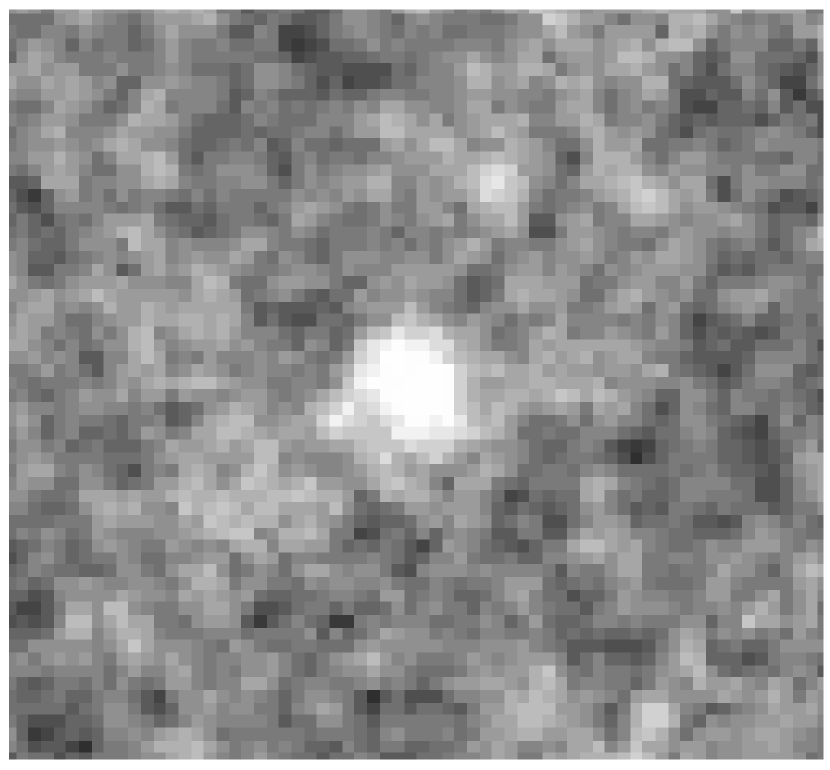
In order to constrain the SFR of the galaxies without significant individual detections we stack their MIPS images. We omit the galaxies with X-ray counterparts. The stacked image shown in Figure 3 is created by co-adding the individual images, clipping the pixels (outside a 6” radius aperture centered on the fiducial position of the co-added object) at to mask surrounding objects (see also, e.g., Burgarella et al., 2006). Then we proceed to determine the total flux within a diameter aperture. To compute the total flux, we subtract the background (the median in a concentric annulus between and ) and multiply by the aperture correction 1.697. The uncertainty is determined by the noise properties of the stacked image, the systematic uncertainties in the zero point calibration and aperture correction, and an additional uncertainty of 5% due to sub-pixel variations in the source positions of the individual images (Zheng et al., 2006). The measured flux is per galaxy. This corresponds to a SFR of for a galaxy at the average redshift of the sample (), which should be regarded an upper limit to the true SFR. Some of the flux will be due low-luminosity AGN, and, in addition, low levels of silicate emission can be expected from circumstellar dust around Asymptotic Giant Branch stars (see, e.g., Bressan et al., 1998; Piovan et al., 2003; Bressan et al., 2006). It is beyond the scope of this paper to constrain the various contributions of the measured flux.
The average SFR of the galaxies without significant detections (those used to create the stacked image) and the nine galaxies with significant detections but without X-ray counterparts is . This is an order of magnitude lower than the SFR of the typical MIPS source at (Pérez-González et al., 2005). Also, of the star formation is accounted for by of the galaxies, which suggests either interlopers or that such obscured star-formation events in early-type galaxies are short lived.
Next, we estimate an upper limit on the specific SFR. We assume that , which is the typical as was determined by recent fundamental plane studies (van der Wel et al., 2005; Treu et al., 2005). The inferred masses are typically in the range of . We find an upper limit for the average specific SFR of , that is, a growth in stellar mass of 5% per Gyr. This is two orders of magnitude lower than the specific SFR of a typical MIPS source at , which has a stellar mass of (Pérez-González et al., 2005). We can use the specific SFR to crudely constrain the growth in stellar mass of the early-type galaxy population between and the present. In the case that the SFR remains constant for the population as a whole, i.e., that obscured bursts of star formation are as prevalent in the local universe as they are at , the stellar mass would increase by . It is quite unlikely that the average SFR in early types has remained constant over the past 7.5 Gyr, as many studies have shown that the SFR has decreased by an order of magnitude since (e.g., Madau et al., 1996; Wolf et al., 2003; Le Floc’h et al., 2005; Bell et al., 2005; Pérez-González et al., 2005; Zheng et al., 2006). If we assume that the SFR declines exponentially and by a factor of 10 between and the present, the growth in stellar mass is . We stress that these numbers are upper limits due to the various other potential contributors to the measured IR flux. Most likely, the true in situ growth of the stellar mass of the early-type galaxy population is still lower.
These upper limits are consistent with the residual stellar mass growth of estimated by Gebhardt et al. (2003) and the residual star formation of derived by Koo et al. (2005) for early-type galaxies and bulges in the Groth Strip Survey. Treu et al. (2005) find significant young stellar populations in low-mass early-type galaxies () at redshifts in the HDF-N, which suggests a considerable growth in stellar mass () between and the present. For more massive galaxies, they find that the growth in stellar mass is negligible. The upper limits that we derive here are marginally consistent with a mass increase of more than , but then we have to assume that all the observed -flux is due to star formation, which is probably unrealistic. The specific SFRs for galaxies more and less massive than (the median mass) are and , respectively. This difference is not statistically significant since the co-added fluxes only differ from each other on the level. Still, if anything, the specific SFR of high-mass early types is higher than that of low-mass early types, but, in addition to the low significance of the measurement, we should keep in mind that high mass galaxies are more likely to have AGN that might contribute to the flux. To reconcile these results with the large fraction of young stars in low-mass early types (Treu et al., 2005), these young stellar populations must have formed in other galaxies that later became part of an early type, or at a time when the galaxies had not yet attained their early-type morphologies.
We conclude that the in situ SFR of the early-type galaxy population at is low, and can only account for an increase in the stellar mass density of early-type galaxies by between and the present. Additional mergers and/or morphological transformations of galaxies are required to explain the observed increase in stellar mass density of red galaxies by a factor of two (Bell et al., 2004; Faber et al., 2005; Borch et al., 2006; Brown et al., 2006).
4. THE EFFECT OF STAR FORMATION ON THE OPTICAL/NEAR-IR COLOR
Now we explore the question whether star formation affects the rest-frame optical/near-IR colors of the galaxies in our sample, or whether light from evolved stellar populations dominates that part of their SEDs, as is usually assumed. In order to do so, we use the (upper limits on the) specific star-formation rate derived in the previous section, and compare this with the rest-frame color (see Fig. 4). The median color of the galaxies without significant fluxes is . The median of the 15 galaxies with significant fluxes is 0.2 mag redder, whereas the uncertainty in the color is only mag. This implies that obscured activity can indeed affect the colors of galaxies.
We compare the colors of the galaxies in our sample with the expected color of a galaxy with an evolved stellar populations. We estimate this expected color as follows. Given the measured evolution of (Treu et al., 2005; van der Wel et al., 2005), the Bruzual & Charlot (2003) model (with solar metallicity and a Salpeter IMF) predicts a certain amount of evolution in . Therefore, from the color of local early types (van der Wel et al., 2006a), we can derive the expected color for early types. We find . We note that the colors of the galaxies with measured dynamical (van der Wel et al., 2006a) do not deviate from those of the larger sample presented in this paper.
The median observed color is 0.2 mag redder than the expected color (see Fig. 4). In particular, the galaxies without significant counterparts are redder than . The question is how much room the upper limits on their fluxes leave for attenuation of the color by obscured star formation. With the star-formation rates derived in Sec. 3 we can constrain this scenario.
In Fig. 4 we show two-component Bruzual-Charlot models, consisting of an evolved stellar population with (see above) and a 200 Myr old stellar population with a constant star formation rate (solar metallicity, Salpeter IMF). Varying the age of the young population with constant star formation between 50 and 500 Myr does not significantly change the models shows in Fig. 4. Besides the specific SFR, the attenuation (increasing from bottom to top) is the only other variable. Only the young component is attenuated: of the evolved component with is assumed to be zero. We assume the Calzetti et al. (2000) extinction law.

As expected, models with low predict blue colors for high SFRs, whereas models with high predict red colors. Models with highly obscured star formation can reach colors that match those of the galaxies in our sample. However, the associated SFRs of those models are only observed for a handful of objects that have significant MIPS detections. For the majority of the galaxies in our sample, the observed SFRs are much lower than expected on the basis of these models. This implies these models are inconsistent with the red colors of the galaxies in our sample. As indicated in Sec. 3, the measured SFRs are systematically uncertain on the level of a factor of two or so. The discrepancy with the model SFRs is much larger than this (an order of magnitude for most galaxies).
Besides obscured SFR, obscured AGN could potentially also redden the color of a galaxy. However, the vast majority of the galaxies in our sample do not show evidence for nuclear activity in the IR or in X-ray (see also Rodighiero et al., 2007). It is highly unlikely that AGN affect the colors of the majority of the galaxies without leaving a trace at other wavelengths that are commonly used to identify AGN. The most straightforward conclusion is that the Bruzual & Charlot (2003) model predicts colors that are too blue for stellar populations in the age range of those of early-type galaxies at (, assuming solar metallicity).
5. SUMMARY
From MIPS imaging we derived constraints on the IR luminosities of a sample of 89 morphologically selected early-type galaxies at with the purpose to identify obscured star formation or AGN activity. We find that 15 () have () counterparts. The X-ray luminosities of six of these indicate that an obscured AGN is responsible for the IR emission. These findings are consistent with recent work by Rodighiero et al. (2007) who study obscured activity in a sample of morphologically selected early-type galaxies.
We derive an upper limit on the flux of the galaxies without significant individual detections by stacking their MIPS images. When we add this sample to the galaxies with significant detections but without luminous AGN we find as the upper limit of the average star formation rate. If we assume that the SFR of the early-type population as a whole is constant between and the present, this implies that the increase in stellar mass density of the early-type galaxy population through in situ star formation is at most . More realistically, if we assume that the average SFR declines by an order of magnitude between and the present, i.e., if we assume that it follows the evolution of the average cosmic SFR, we find . This amount is too small to explain the observed increase by a factor of (Bell et al., 2004; Faber et al., 2005; Borch et al., 2006; Brown et al., 2006).
of the galaxies account for as much as of the integrated IR luminosity, i.e., the majority of the galaxies are quiescent in terms of star formation and AGN activity (see also, Bell et al., 2005). The low IR luminosities of the galaxies imply that the optical/near-IR colors of early-type galaxies are dominated by their evolved stellar populations, and are most likely not significantly affected by obscured star formation or AGN (see Sec. 4). Hence, the conclusions from van der Wel et al. (2006a) and van der Wel et al. (2006b) hold: the rest-frame colors of the stellar populations of early-type galaxies are most likely redder than predicted by the stellar population model from Bruzual & Charlot (2003), and, consequently, stellar masses of evolved galaxies at high redshift that are inferred from optical/near-IR photometry are overestimates by up to a factor of two relative to stellar mass estimates at low redshift.
References
- Alexander et al. (2003) Alexander, D. M. et al. 2003, AJ, 126, 539
- Bell et al. (2004) Bell, E. F. et al. 2004, ApJ, 608, 752
- Bell et al. (2005) Bell, E. F. et al. 2005, ApJ, 625, 23
- Bertin & Arnouts (1996) Bertin, E., & Arnouts, S. 1996, A&AS, 117, 393
- Borch et al. (2006) Borch, A. et al. 2006, A&A, 453, 869
- Bressan et al. (1998) Bressan, A., Granato, G. L., & Silva, L. 1998, A&A, 332, 135
- Bressan et al. (2006) Bressan, A. et al. ApJ, 639, L55
- Brown et al. (2006) Brown, M. et al. 2006, ApJ, in press, astro-ph/0609584
- Bruzual & Charlot (2003) Bruzual, G., & Charlot, S. 2003, MNRAS, 344, 1000
- Burgarella et al. (2006) Burgarella, D. et al. 2006, A&A, 450, 69
- Calzetti et al. (2000) Calzetti, D., Armus, L., Bohlin, R. C., Kinney, A. L., Koornneef, J., & Storchi-Bergmann, T. 2000, ApJ, 533, 682
- Chary & Elbaz (2001) Chary, R., & Elbaz, D. 2001, ApJ, 556, 562
- Dale & Helou (2002) Dale, D. A., & Helou, G. 2002, ApJ, 576, 159
- Drory et al. (2004) Drory, N., Bender, R., Feulner, G., Hopp, U., Maraston, C., Snigula, J., & Hill, G. J. 2004, ApJ, 608, 742
- Förster Schreiber et al. (2004) Förster Schreiber, N. M. et al. 2004, ApJ, 616, 40
- Faber et al. (2005) Faber, S. M. et al. 2005, ApJ, submitted, astro-ph/0506044
- Fazio et al. (2004) Fazio, G. G. et al. 2004, ApJS, 154, 10
- Gebhardt et al. (2003) Gebhardt, K. et al. 2003, ApJ, 597, 239
- Giavalisco et al. (2004) Giavalisco, M. et al. 2004, ApJ, 600, L93
- Kauffmann et al. (2004) Kauffmann, G. et al. 2004, MNRAS, 353, 713
- Kennicutt (1998) Kennicutt, R. C. 1998, ARA&A, 36, 189
- Koo et al. (2005) Koo, D. C. et al. 2005, ApJS, 157, 175
- Le Fèvre et al. (2004) Le Fèvre, O. et al. 2004, A&A, 428, 1043
- Le Floc’h et al. (2005) Le Floc’h, E. et al. 2005, ApJ, 632, 169
- Madau et al. (1996) Madau, P., Ferguson, H. C., Dickinson, M. E., Giavalisco, M., Steidel, C. C., & Fruchter, A. 1996, MNRAS, 283, 1388
- Maraston (2005) Maraston, C. 2005, MNRAS, 362, 799
- Mignoli et al. (2005) Mignoli, M. et al. 2005, A&A, 437, 883
- Papovich et al. (2004) Papovich, C. et al. 2004, ApJS, 154, 70
- Papovich et al. (2006) Papovich, C. et al. 2006, ApJ, 640, 92
- Pérez-González et al. (2005) Pérez-González, P. G. et al. 2005, ApJ, 630, 82
- Piovan et al. (2003) Piovan, L., Tantalo, R., & Chiosi, C. 2003, A&A, 408, 559
- Postman et al. (2005) Postman, M. et al. 2005, ApJ, 623, 721
- Rieke et al. (2004) Rieke, G. H. et al. 2004, ApJS, 154, 25
- Rodighiero et al. (2007) Rodighiero, G. et al. 2007, MNRAS, accepted, astro-ph/0701178
- Rudnick et al. (2006) Rudnick et al. 2006, ApJ, accepted, astro-ph/0606536
- Treu et al. (2005) Treu, T. et al. 2005, ApJ, 633, 174
- van der Wel et al. (2006a) van der Wel, A., Franx, M., van Dokkum, P. G., Huang, J., Rix, H.-W., & Illingworth, G. 2006a, ApJ, 636, L21
- van der Wel et al. (2005) van der Wel, A., Franx, M., van Dokkum, P. G., Rix, H.-W., Illingworth, G. D., & Rosati, P. 2005, ApJ, 631, 145
- van der Wel et al. (2006b) van der Wel, A., Franx, M., Wuyts, S., van Dokkum, P. G., Huang, J., Rix, H.-W., & Illingworth, G. 2006b, ApJ, 652, 97
- van Dokkum & Franx (1996) van Dokkum, P. G., & Franx, M. 1996, MNRAS, 281, 985
- Vanzella et al. (2006) Vanzella, E. et al. 2006, A&A, 454, 423
- Vazdekis et al. (1996) Vazdekis, A., Casuso, E., Peletier, R. F., & Beckman, J. E. 1996, ApJS, 106, 307
- Werner et al. (2004) Werner, M. W. et al. 2004, ApJS, 154, 1
- Wirth et al. (2004) Wirth, G. D. et al. 2004, AJ, 127, 3121
- Wolf et al. (2003) Wolf, C., Meisenheimer, K., Rix, H.-W., Borch, A., Dye, S., & Kleinheinrich, M. 2003, A&A, 401, 73
- Worthey (1994) Worthey, G. 1994, ApJS, 95, 107
- Zheng et al. (2006) Zheng, X. Z., Bell, E. F., Rix, H.-W., Papovich, C., Le Floc’h, E., Rieke, G. H., & Pérez-González, P. G. 2006, ApJ, 640, 784
| ID | B-K | z | |||
|---|---|---|---|---|---|
| Jy | |||||
| J123641.30+621618.4 | 9.8 | 3.47 | 0.85 | ||
| J123604.28+621050.3 | 10.3 | 3.27 | 0.85 | ||
| J123745.19+621655.8 | 10.2 | 3.92 | 0.85 | ||
| J123648.61+621553.0 | 10.6 | 3.35 | 0.85 | ||
| J123706.52+621818.7 | 10.2 | 3.86 | 0.86 | ||
| J123714.48+621530.1 | 10.4 | 3.76 | 0.86 | ||
| J123647.37+621628.4 | 10.5 | 3.41 | 0.87 | ||
| J123714.24+621958.9 | 10.2 | 3.50 | 0.89 | ||
| J123702.92+621428.1 | 9.4 | 2.69 | 0.90 | ||
| J123646.13+621246.8 | 10.0 | 3.22 | 0.90 | ||
| J123648.34+622010.2 | 10.3 | 3.68 | 0.91 | ||
| J123748.67+621313.2X | 10.5 | 4.02 | 0.91 | ||
| J123601.81+621126.8 | 10.6 | 3.88 | 0.91 | ||
| J123609.58+620845.1 | 10.7 | 3.72 | 0.91 | ||
| J123728.95+621127.8 | 10.3 | 3.50 | 0.94 | ||
| J123645.96+621101.3 | 10.2 | 3.61 | 0.94 | ||
| J123720.37+621523.9X | 10.6 | 3.78 | 0.94 | ||
| J123712.70+621546.5 | 10.2 | 3.06 | 0.94 | ||
| J123722.37+621543.7 | 10.3 | 3.48 | 0.94 | ||
| J123734.36+622031.0 | 10.6 | 3.80 | 0.94 | ||
| J123652.32+621537.5 | 10.4 | 3.74 | 0.94 | ||
| J123654.28+621655.5 | 10.5 | 3.78 | 0.94 | ||
| J123640.15+621656.0X | 10.3 | 3.24 | 0.94 | ||
| J123618.94+620844.8 | 10.6 | 3.69 | 0.94 | ||
| J123600.63+621147.8 | 10.3 | 3.61 | 0.95 | ||
| J123630.05+620924.2X | 10.4 | 4.11 | 0.95 | ||
| J123656.64+621220.5 | 10.3 | 3.49 | 0.95 | ||
| J123652.55+620920.1 | 10.4 | 3.46 | 0.95 | ||
| J123644.86+620844.7 | 10.2 | 3.22 | 0.97 | ||
| J123745.15+621322.9 | 10.9 | 3.72 | 0.97 | ||
| J123651.81+620900.2 | 10.2 | 3.40 | 0.97 | ||
| J123637.32+620831.2X | 10.2 | 3.16 | 0.97 | ||
| J123620.68+620906.9 | 10.6 | 3.69 | 1.01 | ||
| J123650.30+622004.9X | 10.2 | 3.68 | 1.01 | ||
| J123644.39+621133.5X | 11.1 | 3.82 | 1.01 | ||
| J123619.23+620923.2 | 10.5 | 3.31 | 1.01 | ||
| J123615.32+621135.0X | 10.5 | 3.71 | 1.02 | ||
| J123620.28+620844.6 | 10.9 | 3.77 | 1.02 | ||
| J123622.06+620851.0 | 10.5 | 3.59 | 1.02 | ||
| J123630.69+620929.3 | 10.5 | 3.62 | 1.02 | ||
| J123640.02+621207.7 | 10.3 | 3.18 | 1.02 | ||
| J123658.09+621639.4 | 10.4 | 3.45 | 1.02 | ||
| J123715.46+621212.2 | 10.4 | 3.68 | 1.02 | ||
| J123653.52+622018.9X | 10.0 | 3.71 | 1.02 | ||
| J123556.74+621406.6 | 10.3 | 3.37 | 1.03 | ||
| J123700.66+622103.2 | 10.5 | 3.43 | 1.04 | ||
| J123714.39+621221.5X | 10.0 | 3.35 | 1.08 | ||
| J123611.24+620903.4X | 10.6 | 4.01 | 1.14 | ||
| J123613.50+621118.8 | 11.0 | 3.31 | 1.14 | ||
| J123659.83+621934.5 | 10.3 | 3.54 | 1.14 | ||
| J123727.86+622035.1 | 10.6 | 3.52 | 1.15 | ||
| J033250.33-275246.8 | 10.2 | 4.13 | 0.85 | ||
| J033243.14-274242.0 | 10.3 | 5.44 | 0.86 | ||
| J033238.36-274128.4 | 10.1 | 3.22 | 0.87 | ||
| J033208.65-274501.8 | 10.5 | 3.56 | 0.87 | ||
| J033235.45-274421.1 | 10.1 | 3.43 | 0.89 | ||
| J033224.39-274624.3 | 10.3 | 3.65 | 0.90 | ||
| J033232.04-274451.7 | 10.4 | 3.59 | 0.90 | ||
| J033206.48-274403.6 | 10.3 | 3.83 | 0.96 | ||
| J033223.26-275101.8 | 10.4 | 3.62 | 0.96 | ||
| J033222.93-275434.3 | 10.8 | 3.65 | 0.96 | ||
| J033227.70-274043.7 | 10.4 | 3.66 | 0.97 | ||
| J033256.92-274634.1 | 9.4 | 2.59 | 0.98 | ||
| J033214.68-274337.1 | 9.8 | 3.12 | 0.98 | ||
| J033239.60-274909.6 | 10.8 | 3.58 | 0.98 | ||
| J033254.23-274903.8 | 10.5 | 3.73 | 0.98 |
| ID | B-K | z | |||
|---|---|---|---|---|---|
| Jy | |||||
| J033224.08-275214.6 | 9.7 | 3.33 | 1.01 | ||
| J033229.93-275252.4 | 9.7 | 3.59 | 1.02 | ||
| J033212.46-274729.2 | 10.3 | 3.44 | 1.02 | ||
| J033217.77-274714.9 | 10.3 | 2.95 | 1.02 | ||
| J033219.02-274242.7 | 10.1 | 3.54 | 1.02 | ||
| J033210.12-274333.3 | 10.3 | 3.81 | 1.02 | ||
| J033210.04-274333.1 | 10.7 | 3.81 | 1.02 | ||
| J033244.29-275009.7 | 10.1 | 3.28 | 1.04 | ||
| J033211.61-274554.2 | 10.5 | 3.64 | 1.04 | ||
| J033217.91-274122.7 | 10.5 | 3.78 | 1.04 | ||
| J033219.77-274204.0 | 9.7 | 3.26 | 1.04 | ||
| J033231.37-275319.2 | 10.9 | 3.69 | 1.14 | ||
| J033227.86-273858.2 | 10.3 | 3.38 | 1.08 | ||
| J033301.27-275307.2 | 9.9 | 2.76 | 1.08 | ||
| J033222.82-274518.4 | 9.8 | 2.80 | 1.09 | ||
| J033216.17-275241.4 | 10.2 | 3.52 | 1.09 | ||
| J033219.30-275219.3X | 10.4 | 3.64 | 1.10 | ||
| J033237.19-274608.1 | 10.9 | 3.60 | 1.10 | ||
| J033231.22-274532.7 | 10.0 | 3.22 | 1.10 | ||
| J033225.20-275009.4 | 10.1 | 3.41 | 1.10 | ||
| J033245.15-274940.0 | 10.5 | 3.40 | 1.12 | ||
| J033223.61-275306.3 | 10.4 | 3.43 | 1.12 | ||
| J033218.52-275508.3 | 10.1 | 3.00 | 1.14 |
Note. — IDs, MIPS fluxes, luminosities, -band luminosities, rest-frame colors and redshifts of the 89 galaxies in our final sample. values are given for objects with non-significant detections. The corresponding luminosities are calculated with that value. Objects with X-ray counterparts are labeled with .