Intervening Metal Systems in GRB and QSO sight-lines:
The Mgii and Civ Question11affiliation: Based on observations collected at the European Southern Observatory, Chile; proposal no. 75.A-0385, 75.A-0603, 77.D-0661
Abstract
Prochter et al. 2006 recently found that the number density of strong intervening Mgii absorbers detected in gamma-ray burst (GRB) afterglow spectra is nearly 4 times larger than in QSO spectra. We have conducted a similar study using Civ absorbers. Our Civ sample, consisting of a total of 19 systems, is drawn from 3 high resolution and high to moderate S/N VLT/UVES spectra of 3 long-duration GRB afterglows, covering the redshift interval . The column density distribution and number density of this sample do not show any statistical difference with the same quantities measured in QSO spectra. We discuss several possibilities for the discrepancy between Civ and Mgii absorbers and conclude that a higher dust extinction in the Mgii QSO samples studied up to now would give the most straightforward solution. However, this effect is only important for the strong Mgii absorbers. Regardless of the reasons for this discrepancy, this result confirms once more that GRBs can be used to detect a side of the universe that was unknown before, not necessarily connected with GRBs themselves, providing an alternative and fundamental investigative tool of the cosmic evolution of the universe.
1 Introduction
The advent of Gamma-ray burst (GRB) exploration in the last 10 years has changed our view of the universe. These highly energetic events have been found over a very large interval of redshift, from the local to (Kawai et al. 2006). They are so bright that when one of these events occurs, the most remote structures can be temporarily “illuminated” and studied in unprecedented detail (Vreeswijk et al. 2005; Chen et al. 2005). At , the optical (UV rest frame) afterglows of long duration GRBs are revealing properties of the forming universe never detected before, such as the existence of a population of metal enriched, star-forming and relatively small galaxies (Berger et al. 2006; D’Elia et al. 2006; Fynbo et al. 2006; Prochaska et al. 2006; Savaglio et al. 2006).
In a recent work, Prochter et al. (2006; hereafter P06) used GRBs to probe the galaxy halos distributed along GRB sight-lines, similarly to what has been done for decades using QSOs. In their study, they identified 14 strong (equivalent width larger than 1 Å) intervening Mgii absorbers in the sight-lines of 14 long duration GRBs. The total path-length is and the mean redshift is z = 1.1, for a mean number density . Surprisingly, only an incidence of 3.8 similar Mgii absorbers is expected for quasars (QSOs) of the same path-length. Dust extinction, gravitational lensing, different beam sizes, and systems belonging intrinsically to the GRB source were ruled out as possible explanations for this difference. Following such a result, Porciani et al. (2007) proposed that the different behavior of Mgii in GRB and QSO sight-lines might be a combination of dust extinction bias, gravitational lensing, and absorbers being misidentified as intervening.
Particularly intriguing is the recent discovery of absorption variability in Mgii and Feii intervening systems along GRB 060206 sight-line, over a time interval of a few hours (Hao et al. 2007). These authors support a scenario according to which the variability is expected if the size of the absorbing clouds is of the order of the GRB beam size (i.e. cm-2) that expands faster than light (Loeb & Perna 1998), due to the large Lorentz factor. In addition, micro-lensing could also add to the possible cause of variability in this case, as described by Lewis & Ibata (2003).
In an effort to understand the reason of the Mgii discrepancy, we have considered intervening Civ absorbers in the lines of sight to GRB and QSO sources. It is important to note that the aforementioned effects act in a different way in Civ intervening systems in GRB and QSO sight-lines. For instance, Civ is found at much larger impact parameters relative to Mgii, making gravitational lensing less effective. This also implies that the strength of Mgii absorption does not correlate to an increase in the strength of Civ absorption (York et al. 2006). Moreover, Civ absorbers do not trace dust to nearly the same extent as Mgii absorbers. Effects from a partial covering factor of QSO background sources (due to a large QSO beam size; Frank et al. 2007) are ruled out for both Civ and Mgii absorbers, as this was never detected in high-resolution and reasonable S/N spectra.
Both Mgii and Civ are easily detected due to their relatively high cosmic abundance, large oscillator strength, and their appearance as doublets. Civ absorbers, a highly ionized species111The ionization potential of Civ is 64.5 eV, compared to 15.0 eV for Mgii., are common features in the large galactic halo (Chen et al. 2001), while strong Mgii absorbers are found at low impact parameters ( 15 kpc; Lanzetta et al. 1990). Strong Mgii systems with a rest equivalent width (Wr) in excess of 0.6 Å are often associated with damped Lyman- (DLA) systems (Rao et al. 2006; York et al. 2006). A direct comparison between the properties of Civ and Mgii absorbers is complicated by the fact that Civ can be effectively detected in the optical for , while Mgii is detected at lower redshifts ().
Our Civ and Mgii survey in GRBs include optical spectra of 5 GRB afterglows taken with the high resolution (R 42000) UV-optical echelle spectrograph UVES at VLT (Vreeswijk et al. 2007). Civ absorbers in 3 sight-lines are compared with those found in QSOs that cover very similar redshifts (Boksenberg et al. 2003). The cumulative number of absorbers as a function of redshift as well as the column density distribution are used to compare the incidence of Civ systems in sight-lines of the GRBs and QSOs. Our Mgii sample is used to confirm the result obtained with equivalent widths.
2 The Data
GRB optical afterglow spectra of 5 GRBs were taken using the high resolution spectrograph UVES. These are: GRB 050730 at = 3.967 (Chen et al. 2005b; D’Elia et al. 2007), GRB 050820 at = 2.612 (Ledoux et al. 2005; Prochaska et al. 2005; ), GRB 050922C at = 2.198 (Jakobsson et al. 2005; Jakobsson et al. 2006; Piranomonte et al. 2007), GRB 060418 at = 1.489 (Dupree et al. 2006; Vreeswijk et al. 2007), and GRB 060607 at = 3.082 (Ledoux et al. 2006). The spectra were normalized by fitting a polynomial function to the continuum. The spectra of GRBs 050820, 050922C, and 060607 were used for the Civ sample with a total absorption path-length of and a mean redshift of . The two other GRB spectra – GRB 060418, 050730 – were excluded from the sample, due to lack of Civ redshift coverage and poor S/N. For the Mgii analysis, we used all these spectra, as the EWs are robust measurements when the S/N is not very high. The spectra used in the Civ survey all have high S/N and resolution (Table 1 and Fig. 1).
The QSO Civ sample (Boksenberg et al. 2003) has a very similar and of 2.26 and 2.65, respectively. A total of 20 Civ systems were identified in the GRB sample, and a total of 40 systems in the QSO sample. The factor of two difference in the number of systems is due to the higher S/N and thus lower detection limits of the QSO sample. Information specific to particular GRBs or QSOs are found in Table 1.
The software ESO-MIDAS and the context FITLYMAN were used to derive the column density, , by simultaneously fitting Voigt profiles to both lines of the Civ doublet. If a system contained multiple components, the column density used was the sum of the column densities of the components.
2.1 Civ Selection techniques
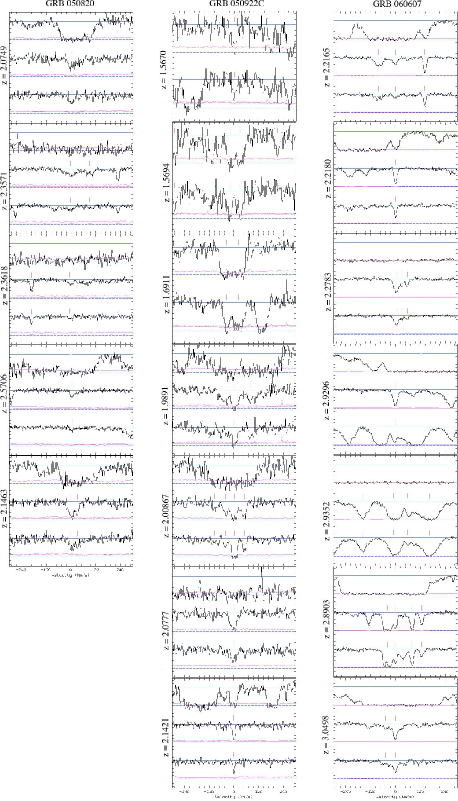
The Civ systems usually are well defined and have multiple absorption features with a velocity distribution structure of up to a few hundred km s-1 (Ellison et al. 2000; Boksenberg et al. 2003; Songaila 2005; Songaila 2006). One or more Civ ‘cloudlets’ can compose a Civ system. Individual systems (i.e. belonging to one physical entity such as a galaxy) are usually separated from each other by more than a few hundred km s-1, and are often associated with Ly- absorption. In two cases, several Civ absorption features that share the same Ly- absorption, were classified as two distinct systems. All other Civ absorption features associated with distinct Ly- absorption are considered individual systems. The velocity spread of these Civ absorption features would have been in excess of 600 km s-1 if classified as one system. The column density of the Civ system is the sum of the column densities of all of its constituent ‘cloudlets’. Velocity profiles of all identified systems are found in Fig. 1. Table 2 presents the redshift, column density , and Doppler parameter of all Civ systems detected in the GRB sample
In this study, only Civ systems outside of the Lyman- forest (i.e., ) are included in the sample. No systems within km s-1 (corresponding to a physical separation of 5.5 Mpc at ) of the redshift of the GRB of QSO were included to prevent any unknown differential effects between the GRB and QSO host environment. A total of 3 Civ systems were excluded from the QSO sample, and 1 system from the GRB sample.
2.2 Completeness limit
Since the S/N in the spectra vary, we derived the lowest detection limit in our GRB sample. A completeness limit of 1 Å rest equivalent width (Wr 1 Å) was used by P06 for the Mgii sample. In this study, column density is used as the parameter to determine completeness. A theoretical rest equivalent width limit of 3 is derived from the various error spectra for the weaker line of the doublet (Civ). Since the ratio of the stronger to the weaker line is 2:1, for small absorptions (i.e. in the linear part of the curve of growth), this corresponds to a detection limit of 6 for the stronger line (Civ). When combined with the fact that Civ systems are identified by the presence of both of these lines, our Civ detection limit is conservative and is .
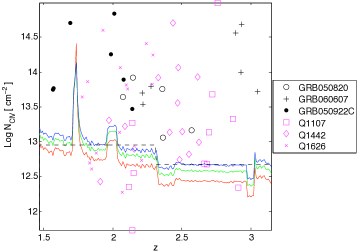
This value is converted to a column density limit for a given doppler parameter , from the linear portion of the empirical curve of growth of Civ. The final column density limit for the survey is the maximum column density limit among the 6 spectra of the 3 GRBs (Fig. 2). Limits were calculated using km s-1 (colored lines from bottom to top in Fig. 2). We notice that the mean Doppler parameter in the sample is km s-1, and that large values are typically associated with large Civ column density, which are easy to detect.
As our S/N does not vary much for , and for (apart from a couple of two small redshift bins) we have chosen for the final analysis, a conservative limit close to the km s-1 line, described by a step function, with cm-2 and cm-2, in the lower and higher redshift bin, respectively (dashed line in Fig. 2). As the average resolutions of the GRB and QSO spectra are within 5% of each other and are all well above the value to resolve the Civ doublet, it is not necessary to compensate for different resolutions when comparing the different spectra (Table 1).
The black and the pink points in Fig. 2 represent the measured GRB Civ and QSO Civ column densities, respectively.
2.3 The QSO sample
Our QSO sample comes from a larger sample of quasars used by Boksenberg et al. (2003). We use their identification of Civ systems and column densities, and we derived cumulative numbers and column density distribution from their tables. The resolution and redshift range of the QSO sample is very similar to the GRB sample. However, the S/N is significantly higher in the QSO sample (Table 1).
3 Methods
3.1 Mg II absorbers in the GRB sight-lines
To verify if the over-density of Mgii systems along GRB sight-lines is not due to the inhomogeneity of P06’s sample, we have performed the same analysis on our homogeneous sample of UVES spectra using exactly the same search criteria. We notice that two UVES afterglow sight-lines are not in the P06’s sample: GRB 050922C and GRB 060607. Table 3 shows the GRB sight-lines used, the starting and ending redshift of the potential Mgii system, the redshifts of the identified Mgii systems, and the rest-frame equivalent width that we measured.
The total redshift path covered by the UVES sample is =6.75 with a mean redshift of = 1.3. We find 6 Mgii systems with a rest-frame equivalent width larger than unity. This corresponds to a number density , consistent with the found by P06, at a mean redshift .
Although our redshift path is smaller than that of P06, our sample of UVES spectra is homogeneous and of much higher quality, and provides a preliminary confirmation of the Mgii excess observed in GRB sight-lines. As the sample will grow, a more sophisticated analysis will be possible, such as the one we present in the following sections on the Civ systems.
3.2 Cumulative number of Civ systems vs z
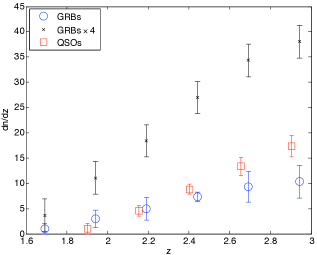
The cumulative number of Civ systems as a function of redshift is shown in Fig. 3 for the QSO and GRB samples. A bin size of was used and error bars were calculated assuming a Poisson distribution, where , with the number of Civ systems. In addition to providing an easy visual comparison with the results obtained by P06 , this method has the potential to amplify systematic differences in the number of Civ systems that are too small to notice on a redshift bin by bin basis.
Fig. 3 shows no significant difference between the GRB and QSO samples. The detection limit discussed in §2.2 was applied to both the GRB and QSO subsamples. To demonstrate that an excess of times detected in Mgii systems would be easily detected in our Civ study, we multiply by four the cumulative number of Civ systems measured in the GRB sample (plotted as crosses in Fig. 3).
In addition, the data were split into two subsamples based on column densities, for cm-2 and cm-2. This corresponds to the median column density of the full Civ sample. Though in §1 we mentioned that there has not been a relationship established between Civ and Mgii systems, we split the sample to test if there is any difference in Civ systems based on their absorption strength. Again, there is no detectable difference in the number density of Civ systems for GRB or QSO sight-lines, although small number statistics play a more significant role for the subsamples than in the full sample.
3.3 Column Density Distribution
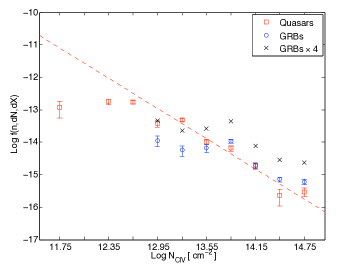
The number of Civ systems per column density interval and absorption path-length , in GRBs is compared with the same function derived from QSOs. The absorption path-length is defined as:
| (1) |
We selected a column density interval of cm-2, while , corresponds to the mean redshift of the sample. The redshift bin is the total redshift interval covered by all sources, from to , as described in §2.1.
Using the column density distribution to compare the incidence of Civ systems allows one to account for multiple redshift coverage as well as compare systems in spectra with different S/N, without discarding any data due to different completeness limits. In addition, the column density distribution provides an easy comparison of the incidence of strong and weak absorbers alike in different lines of sight.
In Fig. 4 we show the results. The sample completeness is demonstrated by the flattening of the power-law distribution, which happens at and , for the GRB and QSO samples, respectively. The two column density distributions above these limits are best fit with a power-law of the form , where for the QSOs, and for the GRBs.
As in the case of the cumulative number, the Civ column density distributions in GRB and QSO sight-lines are consistent. We also show that an excess of would show a clear deviation of the two distributions.
4 Results
We have studied the statistical difference between intervening absorbers in GRB and QSO sight-lines. Our Mgii sample confirms the overdensity detected by P06 in GRB sight-lines. On the other hand, there is no statistical difference in the number of Civ systems, considering both the cumulative number and the column density distribution. Mgii and Civ do not behave the same way. We consider the effects of dust extinction, gravitational lensing, and absorbers associated with the circumburst environment in the following subsections. We note that the redshift intervals covered by the Civ and Mgii absorbers are different, for the former and for the latter.
4.1 Dust Extinction
It has been suggested that QSO surveys are biased against strong absorbers distributed along the sight-lines because dust can obscure the background source (Fall & Pei 1993; Smette et al. 2005 astro-ph/0504657). The dust extinction in Civ absorbers is negligible. To estimate this, we consider that the typical column density in the observed GRB and QSO samples of intervening Civ is cm-2. It is reasonable to believe that the carbon is marginally depleted in dust grains (Savage & Sembach 1996). We assume that most of the carbon in these gas clouds is in Civ form, and that the dust-to-metals ratio is as in the Large Magellanic Cloud (Bohlin et al. 1978). Following Savaglio & Fall (2004), we estimate dust extinction by making the basic assumption that it is proportional to the total column density of metals. A correction must be applied in the case of a refractory and/or ionized heavy element species is considered. However, no correction is necessary if the heavy element considered is not depleted in dust and the ionization correction is negligible. Using LMC dust-to-metals ratio and CIV column density yields an upper limit to the visual and UV dust extinction of and , respectively, for cm-2. One should recall that the LMC dust-to-metals ratio is generally small compared to other regions of the dense ISM in the Milky Way, and that CIV is a high-ionization species and thus a large ionization correction is necessary to get the total carbon column density. If carbon is only 10% in Civ form and the dust-to-metals ratio is 10 times higher than in the LMC (perhaps as in the Galactic cool ISM), the extinction would be 100 times larger, but still negligible, even in the UV.
The picture could be different for the Mgii absorbers selected by P06. The dust depletion of magnesium in the Galaxy is anywhere between 70% to 95%, from the warm diffuse to the cool diffuse ISM (Savage & Sembach 1996). The selection by P06 of Å corresponds to approximately a Mgii column density limit of cm-2. For cm-2, the dust extinction is reasonably negligible, assuming a LMC extinction law. However, the dust extinction grows linearly with the metal column density, if the dust-to-metals ratio is constant (Savaglio & Fall 2004). For Å (half of the Mgii absorbers in P06’s and the present UVES samples) we derive cm-2, and thus , in the case of warm diffuse or cool diffuse ISM, respectively.
Though dust cannot explain the difference for the Å absorbers, the detection can be more complicated for stronger absorbers with Å, which is more than half of P06’s sample. This is particularly true if these absorbers are characterized by a dust depletion as in the Galactic cool ISM.
There has been extensive debate on the topic of dust extinction in QSOs. Ellison et al. 2004 found no significant selection biases associated with the SDSS QSO data, in the CORALS survey. However the sample at includes all Mgii absorbers with Å, which are mostly not affecting the background source. Indeed, Nestor et al. (2006) found that the column density distribution of weak Mgii absorbers is different than that for strong absorbers, which could suggest an evolving dust extinction bias with column density. York et al. (2006), found a negligible extinction of () 0.001 for sight-lines with Mgii systems with W 1.5 Å, in agreement with our expectations. The extinction is slightly higher above this limit. Vladilo & Peroux (2005) find that dust extinction becomes significant ( mag) as the column density of Znii approaches cm-2, which in turn corresponds to a Mgii Wr 3 Å (Turnshek 2005; Vladilo 2005). Though 3 Å is an unusually strong absorption, it is unclear at what Mgii EW between Å and Å does dust extinction start to affect surveys. Interestingly, Wild et al. (2005; 2006) found that strong Caii absorbers at are missed by the SDSS, due to dust obscuration. The EW of Mgii associated with these CaII absorbers is typically above 2 Å.
It is intriguing that Ellison et al. (2006) found evidence of large dust depletion in intervening Mgii absorbers along GRB 060418. For one of the absorbers, at , a 2200 Å bump, typical in the Galactic extinction, was clearly detected for the first time at high redshift. This has yet to be found in QSO spectra.
Though most surveys suggest there is no selection bias associated with dust extinction in QSO spectra, this statement is valid for the total population of QSO absorbers, which are dominated by weak absorbers. And these do not affect the background light. Though the purpose of this survey is not to quantify the amount of dust extinction in QSO or GRB lines of sight, both the results obtained by P06 and us do not exclude these arguments.
4.2 Gravitational Lensing
A similar selection bias can occur when the background source is magnified through gravitational lensing. The amount of magnification depends on the source beam size with respect to the Einstein radius of the lens, where the amplification is larger for a smaller source beam size (Chang & Refsdal 1979). If it is indeed the case that GRB beams are smaller than QSO beams, gravitational magnification could be stronger for GRBs than for QSOs.
However, a larger amplification of GRBs is not enough (see for example Smette, Claeskens & Surdej 1997). The optical depth for lensing (macro or micro-lensing) is maximal if the redshift of the lens is (it decreases to half the maximum roughly within ) for backgrounds sources (GRB or QSO) at . For background sources at or less, the optical depth is maximal at . Therefore, if lensing is really at play, then most Mgii absorbers would follow this. This is not the case of the Mgii absorbers. About 60% (10 out of 16) of the GRBs studied by P06 and us are at , and for these the foreground Mgii absorbers are mostly at . For the remaining 40% of the GRB sample, all but one have and .
Porciani et al. (2007) tentatively found that afterglows with more than one Mgii absorber are on average 1.7 times brighter than their counterparts. This is based on the optical luminosity measured 12 hours after the burst (Nardini et al. 2006). We performed a similar check using the -band absolute magnitudes calculated one day after the burst by Kann, Klose & Zeh (2006) and Kann & Klose (in preparation). This is available for 8 of the 14 GRB sight-lines in P06’s Mgii sample. More appropriately, we considered the number density (number of Mgii absorbers per unit redshift) for each sight-line, instead of the total number of Mgii absorbers. We do not detect any correlation between the brightness of the GRB and the number density of Mgii absorbers. This test does not confirm the magnification hypothesis, though alone it cannot exclude it.
Porciani et al. (2007) suggest that up to 30% of Swift GRBs could be micro-lensed, making optical spectra easier to take. Micro-lensing could also give rise to time variability, following a scenario similar to the one considered by Lewis & Ibata (2003), which would explain this effect found for Feii and Mgii absorbers, by Hao et al. (2007). Though a survey of Civ would be less affected by macro-lensing due to foreground galaxies than a survey of Mgii, this is not the case for microlensing (microlenses are randomly distributed, whereas macrolensing becomes increasing significant with decreasing impact parameters). For this reason, it is unclear what significance these results have upon the hypothesis that gravitational lensing plays a role in the number density of Civ.
4.3 Absorbers associated with the GRB host environment
It is generally accepted that metals that are ejected at semi-relativistic speeds from QSO or GRB sources would have distinctively broad profiles. These features can be found in QSOs up to km s-1 away from the source, and are known as Broad Absorption lines (BALs; Hamann et al. 1993). However, there has been no evidence that suggests that the same process occurs in GRBs. In fact, BALs are mostly detected in high-ionization absorption lines, which are naturally expected for gas clouds very close to a very luminous source. Therefore, if it is detected for Mgii absorbers, it should be even stronger for Civ. Moreover, as relativistic speeds are expected, the absorptions features should be very large in the velocity space. This is clearly seen in BALs, but not at all present in normal intervening Mgii or Civ absorbers.
The scenario proposed by Porciani et al. (2007), where a supernova remnant associated with the GRB and its environment, with multiple high velocity Mgii ’clouds’, would give a Mgii number excess is not supported by our results. It is true that this effect might be less significant in Civ absorbers, because the intrinsic number density of intervening systems is large and the contamination can only be small. Whereas, there are generally few Mgii absorption systems per sight-line, this misidentification can significantly affect statistics. This scenario must only occur once or twice among the Mgii 14 GRB sample to significantly affect results. However, such high-velocity absorbers would require velocities of the gas of half the speed of light to be misidentified as an ’intervening absorber’. This is not typically observed in SN remnants. Intrinsic broadening of the absorbing features is also expected to be much larger than those observed.
5 Summary
An excess of Mgii intervening absorbers along high- GRB sight-lines relative to similar absorbers found in high- QSO spectra was recently found. These Mgii absorbers trace galaxies intersecting bright background point sources. The total number of absorbers in GRB sight-lines is nearly 4 times higher, in the interval (Prochter et al. 2006).
We have performed a similar study using an additional sample of Mgii absorbers, and confirm the previous results. We additionally investigate intervening Civ absorbers and adopted a more detailed analysis. We have compared the number density and column density distribution in 3 GRB sight-lines at with the same quantities in QSO sight-lines in a similar redshift interval. There is no detectable difference in the incidence of Civ systems in the two samples, contrary to what found for Mgii.
Observationally, the main differences between the Civ and Mgii absorbers are the larger impact parameter, the lesser dust extinction, the higher ionization level, the higher redshift, and the larger number density of the former with respect to the latter sample. We expect one or more of these factors to be directly or indirectly responsible for the discrepancy.
We exclude the possibilities that some of the intervening Mgii or Civ absorbers are intrinsically associated with the GRBs, or that these absorbers have a partial covering factor in QSO spectra. We have shown that the scenario in which statistics being affected through the misidentification of intrinsic systems as intervening systems is unlikely, especially in a survey of Civ absorbers.
Out of the possible effects, dust extinction could cause part of the difference in Mgii absorbers. This is due to the fact that QSO studies are generally performed on the bright population, whereas GRBs are primarily selected because of their gamma-ray signal. However, we have shown that dust gives a sizable effect only for the strong Mgii absorbers, those with Å, which is half of the total sample used by P06. This is true for normal dust, however, with a dust-to-metals ratio similar to the Milky Way. If the dust-to-metals ratio is larger that what was previously thought for at least a fraction of high- galaxies, the effects of dust extinction would become more pronounced.
In the future, better statistics both for Civ and Mgii absorbers in GRB spectra will help to solve the issue. Feii absorbers could be used to probe the same galaxy regions as Mgii absorbers. The advantages of using Feii are its larger redshift range (for a higher number statistics), and its less complicated access to column density. The column density is a more meaningful parameter than the equivalent width, used for Mgii. A further test is to study the mean Ly absorption in the diffuse IGM, which is well studied from QSO spectra, and relatively easy to measure in GRB spectra, provided that statistical methods are used, such as the IGM optical method (Fan et al. 2006).
GRB afterglow studies have already demonstrated that there is a population of absorbers, identified as GRB-DLAs and intrinsic to the GRB host, that were very hard to detect before and that show on average very strong absorption features (Savaglio et al. 2003; Berger et al. 2006; Fynbo et al. 2006). It is not known whether the existence of this population is intrinsic to the GRB itself or common in the high- universe. The study of intervening absorbers presented in this work may show that GRBs are probing the high- universe better than QSO studies, regardless of the nature of the GRB itself. The results of our work are not conclusive, but they do imply that there may be fundamental assumptions about the structure of the universe and our methods to probe it that need to be reconsidered.
References
- Berger et al. (2006) Berger, E., Penprase, B. E., Cenko, S. B., Kulkarni, S. R., Fox, D. B., Steidel, C. C., & Reddy, N. A. 2006, ApJ, 642, 979
- Bohlin et al. (1978) Bohlin, R. C., Savage, B. D., & Drake, J. F. 1978, ApJ, 224, 132
- Boksenberg et al. (2003) Boksenberg et al. , 2003, submitted: ApJS.
- Chang & Refsdal (1979) Chang, K., & Refsdal, S. 1979, Nature, 282, 561
- Chen et al. (2001) Chen, H.-W., Lanzetta, K. M., Webb, J. K., & Barcons, X. 2001, ApJ, 559, 654
- Chen et al. (2005) Chen, H.-W., Prochaska, J. X., Bloom, J. S., & Thompson, I. B. 2005a, ApJ, 634, L25
- Chen et al. (2005) Chen, H.-W., Thompson, I., Prochaska, J. X., & Bloom, J. 2005b, GRB Coordinates Network, 3709, 1
- Chen et al. (2006) Chen, H.-W., Prochaska, J. X., & Bloom, J. S. 2006, American Institute of Physics Conference Series, 836, 534
- Chen et al. (2006) Chen, S. L., Li, A., & Wei, D. M. 2006, ApJ, 647, L13
- D’Elia et al. (2006) D’Elia, V., et al. 2006, ArXiv Astrophysics e-prints, arXiv:astro-ph/0609825
- D’Elia et al. (2007) D’Elia, V., Piranomonte, S., Ward, P., Fiore, F., Meurs, E. J. A., Norci, L., & Vergani, S. D. 2007, ArXiv Astrophysics e-prints, arXiv:astro-ph/0701558
- Dupree et al. (2006) Dupree, A. K., Falco, E., Prochaska, J. X., Chen, H.-W., & Bloom, J. S. 2006, GRB Coordinates Network, 4969, 1
- Ellison et al. (2000) Ellison, S. L., Songaila, A., Schaye, J., & Pettini, M. 2000, AJ, 120, 1175
- Ellison et al. (2004) Ellison, S. L., Churchill, C. W., Rix, S. A., & Pettini, M. 2004, ApJ, 615, 118
- Ellison (2005) Ellison, S. L. 2005, IAU Colloq. 199: Probing Galaxies through Quasar Absorption Lines, 281
- Ellison et al. (2006) Ellison, S. L., et al. 2006, MNRAS, 372, L38
- Fall & Pei (1993) Fall, S. M., & Pei, Y. C. 1993, ApJ, 402, 479
- Fan et al. (2006) Fan, X., et al. 2006, AJ, 132, 117
- Frank et al. (2006) Frank, S., Bentz, M. C., Stanek, K. Z., Dietrich, M., Mathur, S., Peterson, B. M., & Atlee, D. W. 2006, ArXiv Astrophysics e-prints, arXiv:astro-ph/0605676
- Fynbo et al. (2006) Fynbo, J. P. U., et al. 2006, A&A, 451, L47
- Hamann et al. (1993) Hamann, F., Korista, K. T., & Morris, S. L. 1993, ApJ, 415, 541
- Hao et al. (2007) Hao, H., et al. 2007, ApJ, 659, L99
- Jakobsson et al. (2005) Jakobsson, P., Fynbo, J. P. U., Paraficz, D., Telting, J., Jensen, B. L., Hjorth, J., & Castro Cerón, J. M. 2005, GRB Coordinates Network, 4017, 1
- Jakobsson et al. (2006) Jakobsson, et al. 2006, A&A, 460 J13
- Kann et al. (2006) Kann, D. A., Klose, S., & Zeh, A. 2006, ApJ, 641, 993
- Kawai et al. (2006) Kawai, N., et al. 2006, Nature, 440, 184
- Lanzetta & Bowen (1990) Lanzetta, K. M., & Bowen, D. 1990 ApJ, 321, 357
- Lewis & Ibata (2003) Lewis, G. F., & Ibata, R. A. 2003, MNRAS, 340, 562
- Loeb & Perna (1998) Loeb, A., & Perna, R. 1998, ApJ, 495, 597
- Ledoux et al. (2005) Ledoux, C., et al. 2005, GRB Coordinates Network, 3860, 1
- Ledoux et al. (2006) Ledoux, C., Vreeswijk, P., Smette, A., Jaunsen, A., & Kaufer, A. 2006, GRB Coordinates Network, 5237, 1
- Nardini et al. (2006) Nardini, M., Ghisellini, G., Ghirlanda, G., Tavecchio, F., Firmani, C., & Lazzati, D. 2006, A&A, 451, 821
- Nestor et al. (2006) Nestor, D. B., Turnshek, D. A., & Rao, S. M. 2006, ApJ, 643, 75
- Piranomonte et al. (2007) Piranomonte, S., D’Elia, V., Ward, P., Fiore, F., & Meurs, E. J. A. 2007, ArXiv Astrophysics e-prints, arXiv:astro-ph/0701563
- Porciani et al. (2007) Porciani, C., Viel, M., & Lilly, S. J. 2007, ArXiv Astrophysics e-prints, arXiv:astro-ph/0701153
- Prochaska et al. (2005) Prochaska, J. X., Bloom, J. S., Wright, J. T., Butler, R. P., Chen, H. W., Vogt, S. S., & Marcy, G. W. 2005, GRB Coordinates Network, 3833, 1
- Prochaska et al. (2006) Prochaska, J. X., et al. 2006, ArXiv Astrophysics e-prints, arXiv:astro-ph/0611092
- Prochter et al. (2006) Prochter, G. E., et al. 2006, ApJ, 648, L93
- Rao et al. (2006) Rao, S. M., Turnshek, D. A., & Nestor, D. B. 2006, ApJ, 636, 610
- Savage & Sembach (1996) Savage, B. D., & Sembach, K. R. 1996, ARA&A, 34, 279
- Savaglio (2006) Savaglio, S. 2006, New Journal of Physics, 8, 195
- Savaglio & Fall (2004) Savaglio, S., & Fall, S. M. 2004, ApJ, 614, 293
- Savaglio et al. (2003) Savaglio, S., Fall, S. M., & Fiore, F. 2003, ApJ, 585, 638
- Smette et al. (1997) Smette, A., Claeskens, J.-F., & Surdej, J. 1997, New Astronomy, 2, 53
- Smette et al. (2005) Smette, A., Wisotzki, L., Ledoux, C., Garcet, O., Lopez, S., & Reimers, D. 2005, IAU Colloq. 199: Probing Galaxies through Quasar Absorption Lines, 475
- Songaila (2005) Songaila, A. 2005, AJ, 130, 1996
- Songaila (2006) Songaila, A. 2006, AJ, 131, 24
- Spergel et al. (2006) Spergel, D. N., et al. 2006, ArXiv Astrophysics e-prints, arXiv:astro-ph/0603449
- Turnshek et al. (2005) Turnshek, D. A., Rao, S. M., Nestor, D. B., Belfort-Mihalyi, M., & Quider, A. M. 2005, IAU Colloq. 199: Probing Galaxies through Quasar Absorption Lines, 104
- Vladilo & Péroux (2005) Vladilo, G., & Péroux, C. 2005, A&A, 444, 461
- Vladilo (2005) Vladilo, G. 2005, IAU Colloq. 199: Probing Galaxies through Quasar Absorption Lines, 325
- Vreeswijk et al. (2005) Vreeswijk, P., Ellison, S., Ledoux, C., Wijers, R., Hjorth, J., & The Grace Collaboration 2005, ASP Conf. Ser. 344: The Cool Universe: Observing Cosmic Dawn, 344, 79
- Vreeswijk et al. (2006) Vreeswijk, P. M., et al. 2007, ArXiv Astrophysics e-prints, arXiv:astro-ph/0611690
- Wild & Hewett (2005) Wild, V., & Hewett, P. C. 2005, MNRAS, 361, L30
- Wild et al. (2006) Wild, V., Hewett, P. C., & Pettini, M. 2006, MNRAS, 367, 211
-
York et al. (2006)
York, D. G. et al.
2006, MNRAS, 367, 945 - (57)
| Source | No. Civ systems | FWHM | S/Na | ||
|---|---|---|---|---|---|
| (km s-1) | |||||
| GRB 050820 | 2.612 | 1.836-2.582 | 5 | 6.3 | 6 – 18 –18 |
| GRB 050922C | 2.198 | 1.511-2.168 | 7 | 6.8 | 7– 12 – 12 |
| GRB 060607 | 3.082 | 2.205-3.052 | 7 | 6.9 | 58 – n/a – 61 |
| Q1626+6433 | 2.320 | 1.607-2.290 | 15 | 6.6 | 88 – 128 – 137 |
| Q1442+2931 | 2.661 | 1.875-2.631 | 14 | 6.6 | 113 – 107 – 121 |
| Q1107+4847 | 2.966 | 2.114-2.936 | 11 | 6.6 | 90 – 94 – 81 |
a S/N over three pixels outside the Lyman forest sampled near the three wavelengths 1270,1380,1500 in the rest frame of the GRB or QSO.
| System | ||||
|---|---|---|---|---|
| (km s-1) | ||||
| GRB 050820 | ||||
| 1 | 2.0749 | 13.64 | 22.1 | |
| 2 | 2.1463 | 13.43 | 23.3 | |
| 13.33 | 6.1 | |||
| 3 | 2.3571 | 13.43 | 23.3 | |
| 12.83 | 6.5 | |||
| 13.21 | 5.9 | |||
| 4 | 2.3618 | 13.05 | 17.4 | |
| 5 | 2.5706 | 13.12 | 14.5 | |
| GRB 050922C | ||||
| 1 | 1.5670 | 13.78 | 14.7 | |
| 2 | 1.5694 | 14.20 | 14.1 | |
| 14.20 | 18.2 | |||
| 3 | 1.6911 | 14.44 | 25.3 | |
| 14.61 | 20.9 | |||
| 4 | 1.9891 | 14.26 | 13.1 | |
| 13.55 | 12.7 | |||
| 5 | 2.0087 | 13.60 | 15.7 | |
| 17.20a | 5.6 | |||
| 13.73 | 11.3 | |||
| 6 | 2.0778 | 13.89 | 17.9 | |
| 7 | 2.1421 | 13.47 | 5.1 | |
| GRB 060607 | ||||
| 1 | 2.2165 | 13.59 | 28.4 | |
| 13.21 | 15.5 | |||
| 2 | 2.2180 | 13.55 | 6.6 | |
| 3 | 2.2783 | 13.64 | 13.8 | |
| 12.95 | 8.2 | |||
| 13.01 | 8.6 | |||
| 4 | 2.8903 | 14.12 | 5.6 | |
| 14.27 | 11.7 | |||
| 13.75 | 7.8 | |||
| 13.95 | 8.0 | |||
| 13.42 | 9.8 | |||
| 5 | 2.9296 | 13.71 | 12.0 | |
| 6 | 2.9352 | 14.14 | 27.4 | |
| 14.54 | 28.8 | |||
| 14.68 | 35.7 | |||
| 7 | 3.0498 | 13.19 | 20.2 | |
| 13.70 | 11.1 | |||
| a Heavily saturated. |