TeV Gamma-Ray Sources from a Survey of the Galactic Plane with Milagro
Abstract
A survey of Galactic gamma-ray sources at a median energy of 20 TeV has been performed using the Milagro Gamma Ray Observatory. Eight candidate sources of TeV emission are detected with pre-trials significance in the region of Galactic longitude and latitude . Four of these sources, including the Crab nebula and the recently published MGRO J2019+37, are observed with significances after accounting for the trials involved in searching the 3800 square degree region. All four of these sources are also coincident with EGRET sources. Two of the lower significance sources are coincident with EGRET sources and one of these sources is Geminga. The other two candidates are in the Cygnus region of the Galaxy. Several of the sources appear to be spatially extended. The fluxes of the sources at 20 TeV range from of the Crab flux to nearly as bright as the Crab.
1 Introduction
A survey of the entire Northern Hemisphere sky for sources of TeV gamma rays has been performed using the Milagro Gamma Ray Observatory (Atkins et al., 2004). This paper reports on observations of sources in the region of Galactic longitude and latitude . This survey is at a higher energy of TeV and in a different region than the survey performed by the HESS atmospheric Cherenkov telescope (ACT) above 200 GeV. The HESS survey covered and and resulted in the detection of 14 new sources (Aharonian et al., 2006b). At even lower energies, EGRET on the Compton Gamma Ray Observatory detected 80 sources above 100 MeV (Hartman et al., 1999) and 28 sources above 1 GeV (Lamb and Macomb, 1997) within 10 deg of the Galactic plane. Fourteen of these GeV sources are in the region surveyed by Milagro. Most of the EGRET sources and several of the TeV sources are unidentified without counterparts at lower energies. However, the improved localizations of HESS have led to identification of supernova remnants (SNR)(Aharonian et al., 2004a), pulsar wind nebulae (PWN) (Aharonian et al., 2005a), and molecular clouds (Aharonian et al., 2006a) as emitters of TeV gamma rays.
In the Milagro data, four sources (including the Crab) are detected with post-trials significance greater than 4, and four additional lower significance candidates are identified. Six of these eight TeV excesses are coincident with the locations of EGRET sources. Many of these sources have stringent upper limits at TeV energies, such as those from the Whipple observatory (Fegan et al., 2005). However, these upper limits weaken for extended sources by the ratio of the radius of the source to the angular resolution. The angular resolution of Milagro is approximately an order of magnitude larger than ACTs, but is less than half that of EGRET, resulting in little reduction in sensitivity for sources up to diameter. The TeV flux, spatial morphology, and potential counterparts of these new sources are discussed below.
2 Analysis
The analysis was performed on 2358 days of data collected by Milagro during the operational period from July 19, 2000 through Jan 1, 2007. Data from the last 3 years of operation were collected after the completion of the outrigger array, which substantially increased the sensitivity of Milagro, particularly at high energies. The Milagro data were analyzed using the method described in Abdo, A. et al. (2007), in which the events are weighted based on the gamma/hadron separation parameter (). The signal and background maps are smoothed with the point spread function (PSF), which varies based on the number of hits in the events. The statistical significance of the excess or deficit is computed using eqn. 17 in Li and Ma (1983).
The Milagro detector is located at latitude N, where the Galactic center and the central Galactic bulge are outside the field of view. In this survey of the Northern Galactic plane, only events with zenith angle less than are included, which covers declinations north of . In Galactic coordinates, this region is longitude and latitude , which subtends 9.2% of the entire sky and covers more than half of the Galactic plane. The energy threshold and sensitivity of Milagro vary with zenith angle. Table 1 shows the median energy and relative sensitivity of the instrument as a function of declination for an assumed differential photon power law spectrum of spectral index .
The background at a given location in celestial coordinates is found use the method described in Atkins et al. (2003) with the modification that the events are weighted. The signal map is searched for excesses over the background map with a statistical significance . When a source candidate is found, the region in the vicinity of the candidate is removed to prevent double counting, and the search is repeated. With this automated procedure, two nearby sources may be identified as a single source candidate or a single extended source may be broken up into multiple candidates.
The event excess in the vicinity of each source candidate is fit to a two-dimensional Gaussian to determine the location, spatial extent and flux. The average angular resolution111To be consistent with HESS and EGRET, the angular resolution is described by the radius that contains 68% of the signal events from a point source. In previous publications, the sigma of the Gaussian function was referenced, which is . of these weighted events is and has been measured with observations of the Crab. Astrophysical sources are better described by a top hat function than a Gaussian; however, a Gaussian approximates a top hat of less than a few degrees diameter that is convolved with the Milagro PSF. Therefore, the Gaussian sigma is used to constrain the diameter of the top hat function that best fits the angular extent of the source.
The excess above the assumed isotropic background is calculated from the volume of the fit two-dimensional Gaussian. This calculation results in a larger uncertainty than implied by the significance of the detection, but properly accounts for the flux of extended sources. The excess is converted to a flux with a Monte Carlo simulation of extensive air showers using CORSIKA (Heck et al., 1998) and of the Milagro detector using GEANT4 (Agostinelli, S. et al., 2003). The source fluxes are computed assuming a differential photon spectrum of a power law with spectral index with no cutoff. This is the average spectrum for Galactic sources observed by HESS (Aharonian et al., 2006b). The flux is quoted at 20 TeV, which is approximately the median energy of the gamma rays from the sources detected by Milagro, as seen in table 1. The median energy of Milagro varies with source spectra and declination, however the uncertainty in the flux at 20 TeV is relatively insensitive to the assumed spectrum and varies by only when varies from to .
3 Results
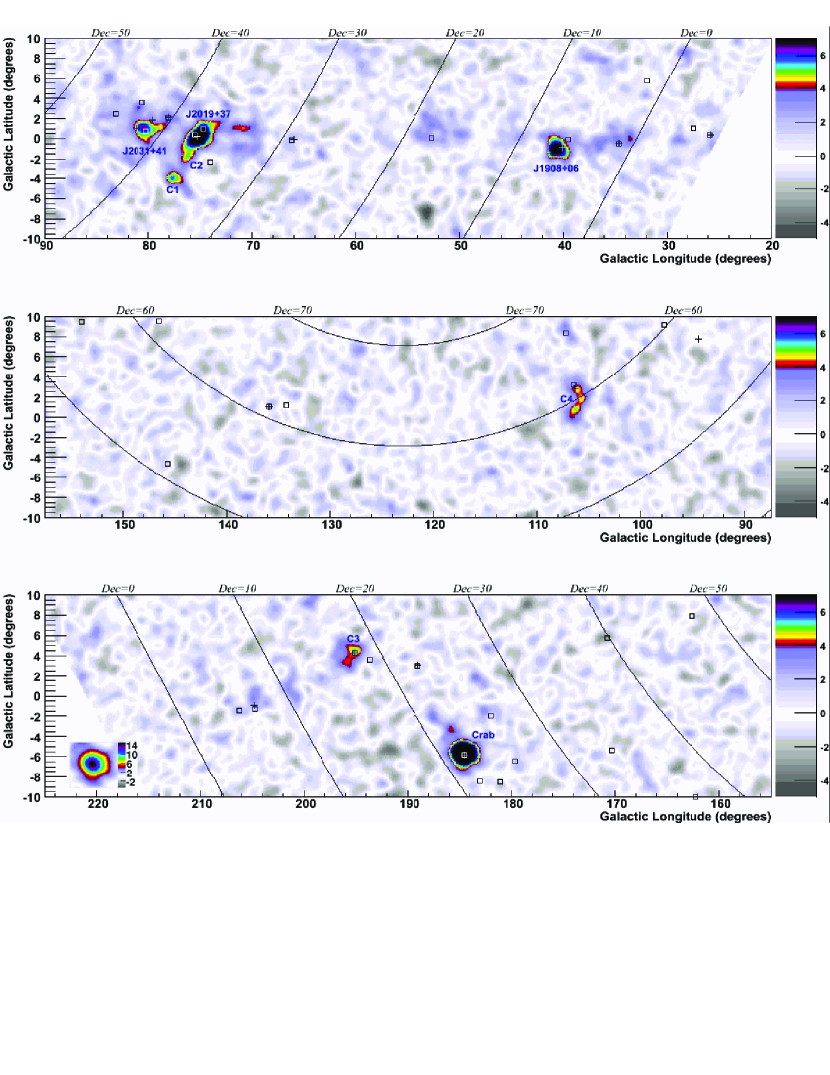
Figure 1 shows a PSF-smoothed map of the Galactic plane, with the color scale indicating the statistical significance of the Milagro excess or deficit at each point. Table TeV Gamma-Ray Sources from a Survey of the Galactic Plane with Milagro gives the locations, fluxes, statistical significances, angular extents, and counterparts for the eight source candidates identified with a pre-trials significance in the PSF-smoothed map of . Because several of the candidates are extended beyond the PSF of Milagro, the maximum pre-trials significance for a search with a larger bin of size is also given in Table TeV Gamma-Ray Sources from a Survey of the Galactic Plane with Milagro. However, the post-trials significances are not based on this a posteriori observation, but are calculated from the PSF-smoothed pre-trials significances. A Monte Carlo simulation is used to account for the trials involved in searching this 3800 square degree region. This simulation predicts that 4% of such searches would result in at least one source with pre-trials significance anywhere in the region due to background fluctuation. The list of eight candidates includes the Crab and MRGO 2019+37, which was previously reported (Abdo, A. et al., 2007). Excluding these previously known gamma-ray sources, six new candidates are identified. The two most significant of these, MGRO J1908+06 and MGRO J2031+41, exceed after accounting for trials. Therefore, the four most significant sources in Table 1 are considered definitive TeV gamma-ray source detections. The remaining four source candidates, labeled as C1-C4, have post-trials significances less than and are regarded as lower confidence detections.
The non-isotropic Galactic diffuse gamma-ray background will contribute to the observed flux of a source. Diffuse emission is particularly bright in the Cygnus region, where five of the eight candidate sources are located. The GALPROP model (Strong et al., 2004) predicts that the TeV gamma-ray diffuse emission flux is 3 to 7 times lower than the observed flux in the large Cygnus region defined as and (Abdo, A. et al., 2007). For individual sources near high concentrations of matter, the diffuse emission will be a larger fraction of the quoted flux. However, due to uncertainties in the model predictions, the diffuse emission was not subtracted from the source fluxes.
The Crab Nebula, a standard reference source for TeV astronomy, is detected at 15.0. The flux derived from the Milagro data is consistent, within errors, with the flux results obtained from atmospheric Cherenkov telescopes (Aharonian et al., 2004b). The fit location is from the pulsar location, which is consistent with the statistical error.
MGRO J2019+37 is one of five Milagro sources in the Cygnus region of the Galactic plane. It is the most significant source detection by Milagro after the Crab and was discussed in depth in Abdo, A. et al. (2007). More data have been analyzed since the publication of that paper, so the flux and significance in Table TeV Gamma-Ray Sources from a Survey of the Galactic Plane with Milagro have been updated.
MGRO J1908+06 is observed with a pre-trials significance of 8.3, with a flux that is 80% of the Crab flux. This location is the closest of the eight candidates to the inner Galaxy, where the diffuse emission is expected to increase. This source is coincident with GEV J1907+0557 and with the bright radio, shell-type, SNR G40.5-0.5(Green, 2006). GEV J1097+0557 was observed for 87 hours by the HEGRA TeV Observatory, resulting in an upper limit for a point source of 2.6% of the Crab flux at 700 GeV (Aharonian et al., 2005b). The Milagro data are consistent both with a point source and with an extended source with diameter up to . The Milagro data are consistent both with a point source and with an extended source of diameter up 2.6∘. The Milagro flux and HEGRA upper limit taken together imply a harder spectrum than other Galactic sources detected in this energy range by HESS. However, if the source is extended, the HEGRA upper limit would be increased, allowing for a spectrum typical of other TeV sources. The Tibet Air Shower Observatory has a similar energy threshold and angular resolution as Milagro, and reports a location within of MGRO J1908+06 as one of eight locations in their survey of the Northern Hemisphere sky that is above 4.5(Amenomori et al., 2005).
MGRO J2031+41 is observed with a pre-trials significance of 6.6 and is located in the area with the largest concentration of molecular and atomic gas in the Cygnus region. Its location is consistent with EGRET sources GEV J2035+4214 and 3EG J2033+4118 and with TEV J2032+413 (Aharonian et al., 2005d). The flux of TeV J2032+413 is measured up to 10 TeV, and is only about one third of the Milagro flux when extrapolated to 20 TeV. The low energy counterpart for TEV J2032+413 is unclear, but several possibilities have recently been postulated (Butt et al., 2006; Anchordoqui et al., 2007). The spatial extent of the Milagro detection, at , is much larger than the few arcminute extent of TEV J2032+413. There must be another source or sources contributing to the Milagro excess.
There are two source candidates in the Cygnus region – C1 and C2 – that are less significant and have no obvious EGRET, PWN, or SNR counterparts. C1 is located farthest from the Galactic plane at b = . C2 may be an extension of MGRO J2019+37 but is away. C2 is not well fit by a two dimensional Gaussian. For this source, the bin in the PSF-smoothed map with the highest excess is used to determine the best location, and the flux is obtained from the excess in a angular bin.
C3 is positionally consistent with Geminga, which is the brightest EGRET source in the Northern Hemisphere sky. Geminga is a pulsar that is only 160 pc away and is 300,000 years old (Caraveo et al., 1996). The 5.1 source detected by Milagro is consistent with the pulsar location and is extended with a diameter of . The significance increases to in a bin. The significance of the Milagro excess at the location of the pulsar is 4.9 in the PSF-smoothed map. Only pulsed emission was detected by EGRET, but a PWN has been observed in X-rays (Caraveo et al., 2003) that delineates the bow shock created by the pulsar’s motion. The diameter of the excess implies an pc source extent, which is consistent with the observations by HESS of more distant PWN (Aharonian et al., 2005a). Upper limits on the TeV flux from Geminga of mCrab (Aharonian et al., 1999; Akerlof et al., 1993; Vishwanath et al., 1993) assumed the emission was from a point source and were set at a much lower energy than this observation. If the spectral index is or harder, or if the source is extended, the Milagro detection is consistent with the previously reported limits.
C4 is the least significant source in table TeV Gamma-Ray Sources from a Survey of the Galactic Plane with Milagro at 5.0. However, as seen in Figure 1, the source appears very elongated and the significance increases to with the larger bin. The source location is consistent with 3EG J2227+6122, GEV J2227+6106, and the SNR G106.6+2.9 with the accompanying Boomerang PWN. This PWN is predicted by Bednarek & Bartosik (2005) to be the third brightest TeV PWN in the Northern sky, surpassed only by the Crab and PWN G75.2+0.1, which both have high significance Milagro counterparts.
4 Discussion
A survey of of the Galactic plane at TeV has been performed with Milagro with a sensitivity from 3 to 6 (TeV-1cm-2s. Eight sources are identified with pre-trials significance above the isotropic cosmic ray background. All four of the high confidence sources and two of the lower significance candidates are associated with EGRET GeV sources, of which there are only 14 in the search region. Four of these six sources appear extended, and the significance of the other two lower significance sources increases substantially with a larger bin of size . The significance for a true point source would be expected to decrease slowly for larger bin sizes due to the addition of gamma rays beyond the edge of the optimal bin. On the other hand, the significance of a statistical fluctuation of background would be expected to decrease inversely proportional to the bin radius. The remaining two lower confidence source candidates are within the Cygnus region, where the diffuse emission is high and there is a large concentration of EGRET sources. The differential photon spectrum that connects the fluxes observed by EGRET at 1 GeV with those observed at 20 TeV by Milagro is described by a power law with spectral index , except for Geminga which is steeper. This spectrum implies a break from the harder spectra observed for most of these sources by EGRET above 100 MeV. Four of these sources are associated with PWNe, of which only 11 are known in this region (Roberts, 2004), and one is associated with a SNR. Other members of these classes of sources have also been detected by HESS. The angular extents of the Milagro sources are large, as would be expected if the sources are nearby, like Geminga. The enhanced sensitivity of GLAST should allow these objects to be resolved at energies above a few GeV. In addition, a Milagro energy spectrum analysis is being developed that will measure spectra of these sources up to 50 TeV. The morphology at different energies provides important clues about the energy of the particles producing the radiation and the energy loss mechanisms of these particles. Combining spatial resolution over a broad range of energies is key to understanding the Galactic sources that emit the highest energy gamma rays.
References
- Abdo, A. et al. (2007) Abdo, A. A., et al. 2007, ApJ, 658, L33
- Agostinelli, S. et al. (2003) Agostinelli, S., et al. 2003, NIM A 506 2003, 250
- Aharonian et al. (2006a) Aharonian, F., et al. 2006, Nature, 439, 695
- Aharonian et al. (2006b) Aharonian, F., et al. 2006, ApJ, 636, 777
- Aharonian et al. (2005a) Aharonian, F. A., et al. 2005, A&A, 442, L25
- Aharonian et al. (2005b) Aharonian, F., et al. 2005, A&A, 439, 635
- Aharonian et al. (2005d) Aharonian, F., et al. 2005, A&A, 431, 197
- Aharonian et al. (2004a) Aharonian, F. A., et al. 2004, Nature, 432, 75
- Aharonian et al. (2004b) Aharonian, F., et al. 2004, ApJ, 614, 897
- Aharonian et al. (1999) Aharonian, F., et al. 1999, A&A, 346, 913
- Akerlof et al. (1993) Akerlof, C. W., et al. 1993, A&A, 274, L17
- Amenomori et al. (2005) Amenomori, M., et al. 2005, ApJ, 633, 1005
- Anchordoqui et al. (2007) Anchordoqui, L. A., et al 2007, Phys. Rev. D, 75, 063001
- Atkins et al. (2004) Atkins, R., et al. 2004, ApJ, 608, 680
- Atkins et al. (2003) Atkins, R., et al. 2003, ApJ, 595, 803
- Bednarek & Bartosik (2005) Bednarek, W., & Bartosik, M. 2005, Journal of Physics G Nuclear Physics, 31, 1465
- Butt et al. (2006) Butt, Y. M., et al. 2006, arXiv:astro-ph/0611731
- Caraveo et al. (1996) Caraveo, P. A.,et al. 1996, ApJ, 461, L91
- Caraveo et al. (2003) Caraveo, P. A., et al. 2003, Science, 301, 1345
- Esposito et al. (1996) Esposito, J. A., et al. 1996, ApJ, 461, 820
- Fegan et al. (2005) Fegan, S. J., et al. 2005, ApJ, 624, 638
- Green (2006) Green D. A., 2006, ‘A Catalogue of Galactic Supernova Remnants (2006 April version)’, Astrophysics Group, Cavendish Laboratory, Cambridge, United Kingdom
- Hartman et al. (1999) Hartman, R. C., et al. 1999, ApJS, 123, 79
- Heck et al. (1998) Heck, D. et al., Report FZKA 6019, 1998
- Lamb and Macomb (1997) Lamb, R. C., & Macomb, D. J. 1997, ApJ, 488, 872
- Li and Ma (1983) Li, T.-P., and Ma, Y.-Q. 1983, ApJ, 272, 317
- Roberts (2004) Roberts, M.S.E., 2004,
- Strong et al. (2004) Strong, A.W., Moskalenko, I.V., & Reimer, O. 2004, ApJ, 613, 962
- Vishwanath et al. (1993) Vishwanath, P. R., et al. 1993, A&A, 267, L5
| Dec. | Fluxaa Flux sensitivity for a point source in units of TeV-1s-1cm-2 quoted at 20 TeV for a detection. | Energy Range (TeV)bb Energy below which the indicated percentage of weighted events are included in the analysis. | |
|---|---|---|---|
| Sens. | Median | 10%-90% | |
| 0 | 6.5 | 40 | 9-150 |
| 10 | 4.4 | 27 | 6-110 |
| 20 | 3.6 | 22 | 5-82 |
| 30 | 3.2 | 19 | 4-77 |
| 40 | 3.1 | 19 | 4-77 |
| 50 | 3.2 | 23 | 5-82 |
| 60 | 3.5 | 26 | 6-100 |
| 70 | 4.5 | 38 | 8-140 |
| Object | Location | ErroraaThe table lists statistical errors only. The systematic pointing error is . | Significance()bbThe post trials significances account for the trials incurred in searching the 3800 square degree region. | FluxccThe table lists statistical errors only. The systematic flux error is 30%. at 20 TeV | Extent | Counterparts | ||
|---|---|---|---|---|---|---|---|---|
| Radius | pre- | post- | Diameter | (References) | ||||
| (deg) | trials | trials | (deg) | |||||
| Crab | 0.11 | 15.0 | 14.3 | 11.5 | - | Crab | ||
| MGRO J2019+37 | 0.19 | 10.4 | 9.3 | 8.5 | ddFor this high significance detection, the extent was computed using only large events. See Abdo, A. et al. (2007) for details. | GEV J2020+3658, | ||
| PWN G75.2+0.1, (1) | ||||||||
| MGRO J1908+06 | 0.24 | 8.3 | 7.0 | 6.3 | GEV J1907+0557, | |||
| SNR G40.5-0.5 | ||||||||
| MGRO J2031+41 | 0.47 | 6.6 | 4.9 | 6.4 | GEV J2035+4214, | |||
| TEV J2032+413 (2,3) | ||||||||
| C1 | 0.24 | 5.8 | 3.8 | 3.4 | - | |||
| C2 | eeGaussian fit of excess failed for this candidate. | 5.1 | 2.8 | 4.5 | eeGaussian fit of excess failed for this candidate. | - | ||
| C3 | 0.40 | 5.1 | 2.8 | 5.9 | Geminga | |||
| C4 | 0.52 | 5.0 | 2.6 | 6.3 | GEV J2227+6106 | |||
| SNR G106.6+2.9 | ||||||||
References. — (1) Abdo et al. 2007, (2) Butt et al. 2003, (3) Anchordiqui et al. 2007.