On the Incidence of C IV Absorbers Along the Sightlines to Gamma-Ray Bursts
Abstract
We report on the statistics of strong ( Å) C IV absorbers at toward high-redshift gamma-ray bursts (GRBs). In contrast with a recent survey for strong Mg II absorption systems at , we find that the number of C IV absorbers per unit redshift does not show a significant deviation from previous surveys using quasi-stellar objects (QSOs) as background sources. We find that the number density of C IV toward GRBs is , and . These numbers are consistent with previous C IV surveys using QSO spectra. Binning the entire dataset, we set a 95 c.l. upper limit to the excess of C IV absorbers along GRB sightlines at twice the incidence observed along QSO sightlines. Furthermore, the distribution of equivalent widths of the GRB and QSO samples are consistent with being drawn from the same parent population. Although the results for Mg II and C IV absorbers along GRB sightlines appear to contradict one another, we note that the surveys are nearly disjoint: the C IV survey corresponds to higher redshift and more highly ionized gas than the Mg II survey. Nevertheless, analysis on larger statistical samples may constrain properties of the galaxies hosting these metals (e.g. mass, dust content) and/or the coherence-length of the gas giving rise to the metal-line absorption.
1 Introduction
After extensive studies on absorption line systems in spectra of quasi-stellar objects (QSOs) it has been widely accepted that the majority of systems discovered are intervening and that they trace the cosmological expansion of the universe. Various surveys have been conducted that focus on the cosmological evolution of metal absorption systems for distinct atomic transitions. A standard observational measure is the number of absorbers per unit redshift, , which includes the cosmological evolution in the physical pathlength and evolution intrinsic to the absorbers themselves (e.g., Lanzetta et al., 1987; Sargent et al., 1988; Steidel, 1990).
Since the production of heavy elements takes place in the stars which mainly group into galaxies, it is natural to relate metal absorbers to galaxies (although this has proven difficult to test, especially at high redshift; e.g., Churchill et al., 2004; Tripp & Bowen, 2005). Therefore, studying the evolution of metal absorbers may impact our understanding of both galaxy evolution and the physics of the intergalactic medium (IGM).
Recently, Prochter et al. (2006b) have found a significant overabundance (a factor of ) of strong (rest-frame equivalent width of Mg II 2796, Å) Mg II absorbers in lines-of-sight toward gamma-ray bursts (GRBs) when compared to the statistics drawn from lines-of-sight toward QSOs. This result is striking because a key hypothesis of this experiment is that intervening absorbers are independent of the background source. Several physical effects have been proposed to explain the overabundance: (1) dust within the Mg II absorbers may obscure faint QSOs, (2) the Mg II gas may be intrinsic to the GRBs, (3) the GRBs may be gravitationally lensed by these absorbers, and (4) the absorbers are small enough that different ‘beam sizes’ between GRBs and QSOs may affect the statistics (Prochter et al., 2006b; Frank et al., 2006; Hao et al. , 2007). Prochter et al. (2006b) and Porciani et al. (2007) have argued that none of these explanations is likely to explain the full effect but it may be possible for several to contribute together to resolve the discrepancy.
In this paper, we revisit high-resolution GRBs spectra and look for C IV absorbers to obtain the first statistics of such absorbers in this type of lines-of-sight. Because the C+3 ion has a much higher ionization potential than Mg+, the C IV doublet is likely to trace more diffuse and hotter gas. Therefore, C IV systems may represent a different ”population” of larger ”cross section” absorbers and the study of their statistics may help address the problem opened by the Prochter et al. (2006b) result.
2 Data
We have drawn our spectral sample from echelle observations summarized in Table 1. We have restricted our analysis to the sightlines with at least coverage redward of the Ly forest (i.e. ) and to spectra with moderate to high signal-to-noise ratio ( pix-1). The sample is comprised of echelle spectra of the following GRB afterglows: GRB021004, GRB050730, GRB050820, GRB050922C and GRB060607. The data was obtained with the MIKE/Las Campanas (Bernstein et al., 2003), UVES/VLT (Dekker et al., 2000) and HIRES/Keck (Vogt et al., 1994) echelle spectrographs allowing high spectral resolution of . The UVES data were retrieved from the ESO archive and processed with the standard UVES pipeline. For each GRB the individual spectra acquired with a given instrument were reduced, coadded and normalized with standard techniques. We refer the reader to the following papers for a full discussion of the observations (Fiore et al., 2005; Chen et al., 2005; Prochaska et al., 2007; Piranomonte et al., 2007; Ledoux et al., 2006).
3 C IV Absorption Systems toward GRBs
3.1 Equivalent Widths
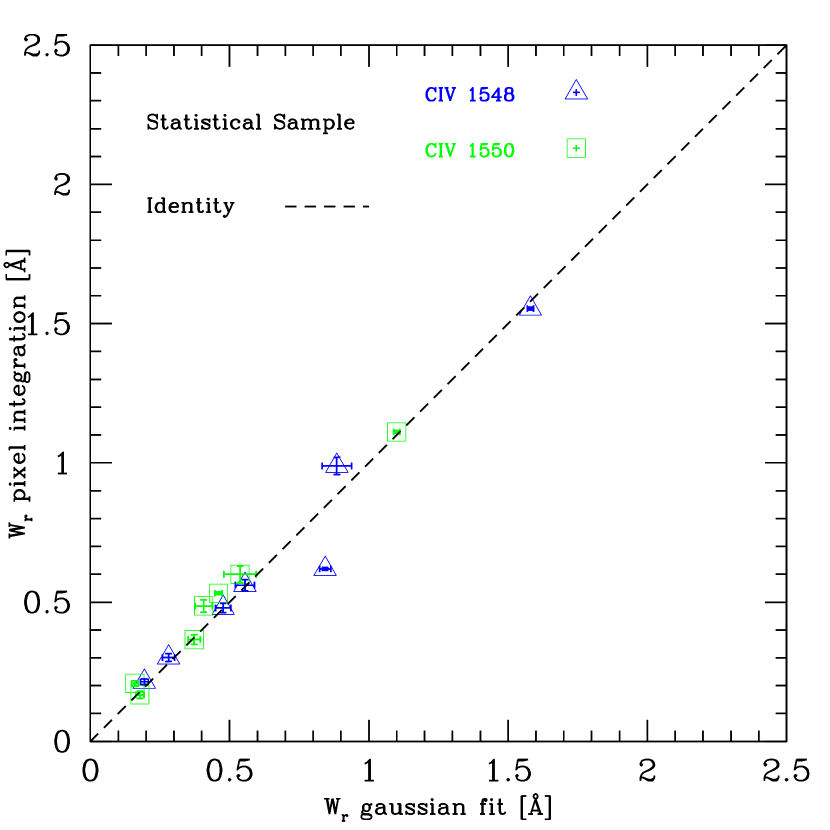
Equivalent widths were calculated using both direct pixel integration, , and a Gaussian fit, , applied directly to the high-resolution data (since previous surveys used spectra of lower resolution, we first confirmed that smoothing and re-binning our data does not alter the equivalent widths). We obtained over the smallest velocity window that contain the whole system. The rest frame equivalent width was calculated by taking . We arbitrarily defined the redshift of the absorption system such that it appears centered in velocity space.
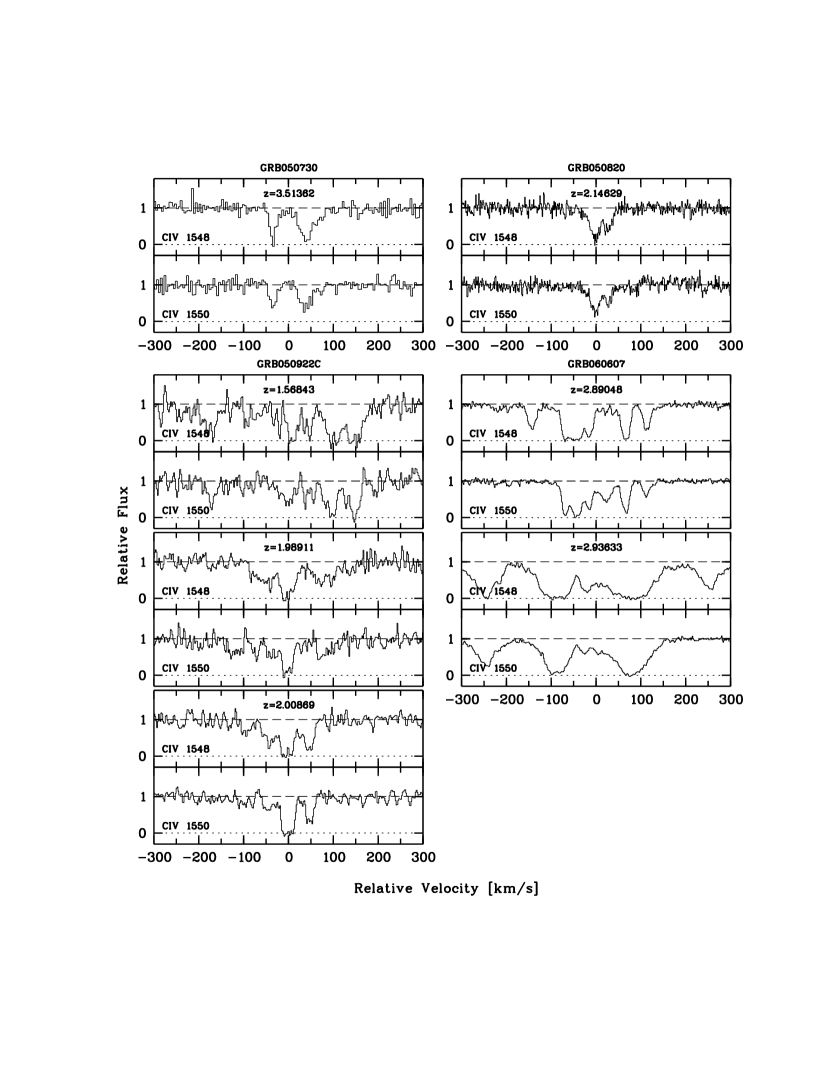
To obtain , we fitted a single or multiple Gaussian profile to the absorption lines, and summed each component of an individual system. In the case of multiples components, the error associated is, , where is the individual error of component . Figure 1 shows that equivalent widths from both methods are, in general, self-consistent. The outlier is due to the blended feature in the main component of the system at (see Figure 2). Hereafter, we will use only because of its robustness (continuum and blended systems are fitted, independently of velocity window).
3.2 Definition of the Samples
3.2.1 Full Sample
We first define a Full Sample of C IV absorption systems that satisfy the following criteria: (1) ; i.e., the Full Sample includes lines associated with the GRB host galaxy (we will later restrict the analysis to intervening C IV systems). (2) The equivalent width of the C IV doublet must be detected at the 5 level or higher. No conditions were imposed to the equivalent width ratio for both components although all members of the Statistical Sample (see below) exhibit an equivalent width ratio between 1 (saturated regime) and 2 (unsaturated regime). (3) A complex system is considered a single system if the velocity components group within km s-1. This last condition is useful to compare with previous surveys that were made at lower spectral resolution (for instance, Steidel, 1990, used a velocity window of km s-1 to group components of a single system but then defined a statistical sample counting as a single system all components within km s-1; Our Statistical Sample, defined below, does not have systems separated by less than km s-1, therefore these two samples are comparable).
Although performed redward of the Ly forest, the C IV survey has one significant contaminant: the O I 1302/Si II 1304 pair of transitions has nearly identical separation as the C IV doublet. It is trivial, however, to identify these contaminants by searching for other Si II transitions and the C II 1334 transition.
We found 29 candidate C IV absorption systems in our Full Sample. This number includes absorption systems with . Table 2 shows the information on redshift limits of each line-of-sight, and .
3.2.2 Statistical Sample
To compare the statistics of C IV absorption along GRB sightlines with that one for QSO sightlines, one must define a sample with identical equivalent width limits. Previous surveys have defined this limit to Å in the rest frame (Steidel, 1990; Misawa et al., 2002). We adopt the same value, i.e., Å in both members of the C IV doublet.
In addition, to avoid contributions from galaxies clustered with the hosts of GRB and wind features that might be associated with the GRB progenitor (Chen et al., 2007) and to compare with previous surveys, we define a Statistical Sample with the same as in the Full Sample but at from (as in Steidel, 1990, for ).
All the spectra included in our Statistical Sample permit detections of lines with Å with at least significance from to within . The Statistical Sample is composed of 7 absorption systems (see systems labeled with a dagger in Table 2 and see Figure 2 for velocity plots). We excluded 2 systems due to their dubious character (systems labeled with an ’X’ in Table 2): , although not saturated, it shows an equivalent width ratio ; falls very close to Å but Å.
3.3 Redshift Number Density
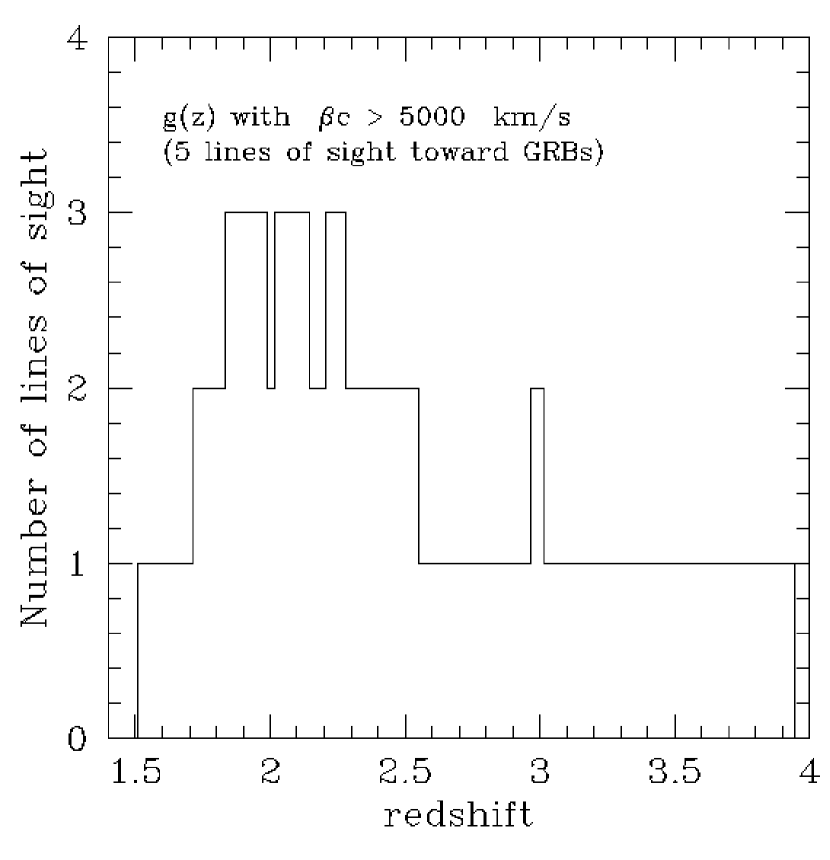
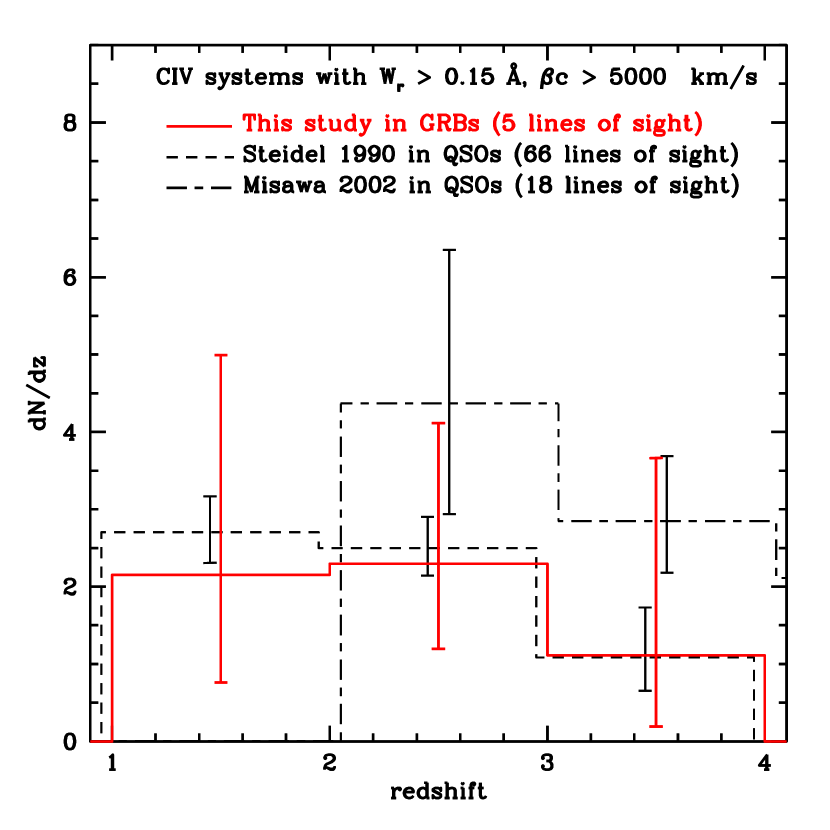
The redshift number density, , is the number of absorbers per unit redshift. By definition, where is the number of absorption systems in the redshift path . Defining the number of lines-of-sight between and as (a function that defines the redshift path density), the redshift path can be written as where is the grid resolution. Figure 3 shows for our sample. Figure 4 shows our result on toward GRBs (). The choice of redshift bins is arbitrary; we used 3 bins of 1 redshift unit between and .
To estimate the error in we assume a Poissonian distribution in the number of absorbers in a given redshift bin and then assign the upper and lower limit corresponding to confidence level of a Gaussian distribution, () and respectively obtained from Gehrels (1986). Therefore, . This is done for each redshift bin.
4 Result
For the Statistical Sample we find , and . Table 3 shows the specific results for each redshift bin.
How do these numbers compare with ? One of the largest published surveys of C IV along QSO sightlines was carried out by Steidel (1990). In that survey, 66 QSO spectra with low spectral resolution ( Å) were used (55 of them were obtained from Sargent et al. (1988)). We used their result as comparison. Steidel (1990) measured the incidence of C IV systems with Å and parameterized their results as . However, in what follows, we compute directly from the tables in Steidel (1990) and Sargent et al. (1988). We also compare with another published survey by Misawa et al. (2002) (18 QSO spectra with resolution of Å) although this survey has much lower redshift coverage and does not provide a better sensitivity ( Å).
We find that decreases with redshift in the range between and as in QSO surveys. In Figure 4 we compare with using our binning. It can be seen that, within errors, our result on C IV matches the Steidel (1990) and the Misawa et al. (2002) ones (according to Misawa et al., the fact that these two previous results do not match each other would be due to an statistical accident). On the other hand, if we use only one redshift bin between and we find that the incidence of C IV absorbers along GRB sightlines is less than twice that one along QSOs (Steidel 1990 sample) at the 95 confidence level, i.e., a large overabundance is improbable (even taking into account the 2 dubious systems excluded from the Statistical Sample). Therefore, there is no significant difference between the GRB and QSO statistics in our sample.
5 Discussion
The principal result of our analysis is that the incidence of C IV absorbers (Å) along GRB sightlines is consistent with that observed along QSO sightlines. Note that the same conclusion is reached by Sudilovsky et al. (2007) using similar data (although these authors use a smaller total redshift path and a lower equivalent width cutoff than ours).
Quantitatively, we set a 95 upper limit of over the redshift interval to 4. At the surface, this result lies in stark contrast to the incidence of strong Mg II absorbers at where Prochter et al. (2006b) find a lower limit at the 99.9 significance level.
Are these two results contradictory? Let us first stress that the two absorption-line samples may be nearly disjoint. Firstly, one important difference is that the Mg II absorbers were surveyed at while most of the pathlength surveyed here for C IV absorption has . While there is no indication that the enhancement is declining with increasing redshift, there are possible reasons to expect such an effect (e.g. gravitational lensing efficiency is maximal at ). In that case the Mg II enhancement would vanish at the redshifts probed here with C IV.
But even if this were not the case, let us consider a second argument in favor of the present results. The key issue is that C IV may track a distinct phase of gas from Mg II in the intergalactic medium owing to its substantially higher ionization potential. This is reflected in the statistics of QSO surveys. At , (Prochter et al., 2006a) and (Steidel, 1990), i.e., C IV systems are a factor of 6 more abundant than Mg II for the thresholds relevant to our study. In other words, there is plenty of C IV (weak) systems that do not show strong Mg II absorption.
On the other hand, we expect that nearly every strong Mg II absorber will also exhibit C IV absorption. Furthermore, many of these will have an equivalent width in excess of 0.15Å (e.g. Churchill et al., 1999). Therefore, if the enhancement in continues beyond , we do expect a certain bias to larger . However, since there is not a one-to-one correspondence between Å Mg II absorbers and Å C IV absorbers, such possible bias is diluted in the much more numerous statistics of C IV (indeed, none of the C IV absorbers in our sample that have coverage of the Mg II doublet shows significant absorption; e.g., from GRB 050922C). Even if we assume that and that each system also has Å the effect on is less than (at most ()/() = 9/6 given that ()/() = 4/1 and ()/() = 6/1).
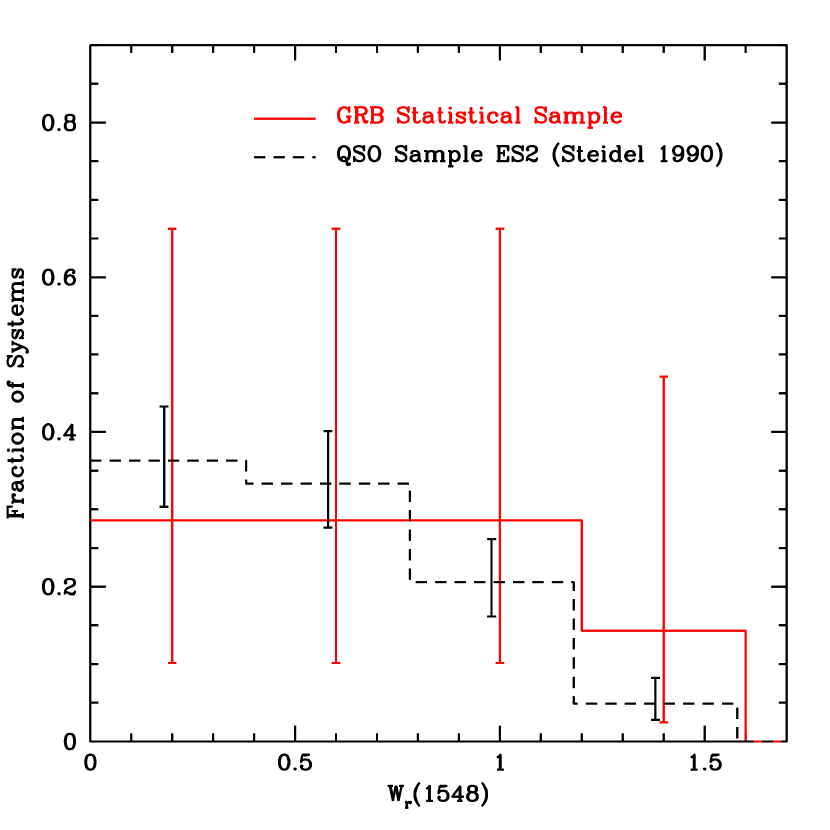
While the change to for Å may be modest, as argued above, it is possible that an enhancement in will imply an C IV equivalent width distribution that is very different from that toward QSOs, e.g., a much higher incidence of Å. Figure 5 presents a histogram of the equivalent widths for our analysis and that of Steidel (1990) with arbitrary binning. We performed a K-S test on the un-binned distributions of rest frame equivalent widths that rules out the null hypothesis (of similar distributions) at only the 1% c.l. Therefore, there is no indication of possible differences between equivalent width distributions of C IV absorbers toward GRBs and QSOs.
In summary, there is no fundamental conflict between observing an enhanced incidence of strong Mg II absorbers along GRB sightlines without a corresponding enhancement of C IV absorbers. Before concluding, let us speculate on the implications of these results under the assumption that future data confirm the currently measured incidences. If our results on and the current enhancement in are confirmed in larger surveys, one may use these contrasting results to infer characteristics of the C IV absorbers. For example, if the enhancement is to be explained by the geometric differences between the GRB and QSO beams (comparable with the characteristic size of Mg II ‘clouds’) (Frank et al., 2006), then one would conclude C IV absorbers are significantly larger than Mg II clouds and the QSO beam size. Indeed, such differences have been inferred from comparisons of metal-line absorption along gravitationally lensed QSOs (e.g., Lopez et al., 1999).
Similarly, the results could constrain the dust redenning or mass of the galaxies hosting C IV absorbers. Correlations between these quantities and Mg II equivalent width have been found by recent studies using Mg II statistics derived from Sloan Digital Sky Survey QSOs. For instance, Ménard et al. (2007) have parameterized the (significant) amount of QSO redenning due to Mg II absorbers, and Bouche et al. (2006) have found an anti-correlation between Mg II equivalent width and mass of the dark-matter halo hosting the absorbing galaxy. The different behavior of C IV and Mg II, as revealed by the statistics toward GRBs, then can put constraints on these absorber properties by studying Mg II samples selected by C IV.
References
- Bernstein et al. (2003) Bernstein, R., Shectman, S. A., Gunnels, S. M., Mochnacki, S. & Athey, A. E., 2003, in Instrument Design and Performance for Optical/Infrared Ground-based Telescopes. Edited by Iye, Masanori, Moorwood, Alan F. M. Proceedings of the SPIE, Volume 4841, pp. 1694-1704 (2003)., 1694.
- Bouche et al. (2006) Bouche, N., Murphy, M. T., Peroux, C., Csabai, I. & Wild, V., 2006, MNRAS, 371, 495
- Chen et al. (2005) Chen, H.-W., Prochaska, J. X., Bloom, J. S. & Thompson, I. B. 2005, ApJ, 634L, 25C
- Chen et al. (2007) Chen, H.-W., Prochaska, J. X., Ramirez-Ruiz, E., Bloom, J. S., Dessauges-Zavadsky, M. & Foley, R. J. 2007, ApJ, 663, 420C
- Churchill et al. (1999) Churchill, C., Mellon, R.R., Charlton, J.C., Januzzi, B.T., Kirhako, S., Steidel, C. & Schneider, D.P. 1999, ApJ, 519, L43.
- Churchill et al. (2004) Churchill, C. W., Steidel, C., & Kacprzak, G. 2004, in ASP Conf. Ser. 331, Extra-Planar Gas, ed. R. Braun (San Francisco: ASP), 387, astro-ph/0411269
- Dekker et al. (2000) Dekker, H., D’Odorico, S., Kaufer, A., Delabre, B. & Kotzlowski, H. 2000, in Proc. SPIE Vol. 4008, p. 534-545, Optical and IR Telescope Instrumentation and Detectors, Masanori Iye, Alan F. Moorwood, Eds., ed. M. Iye and A. F. Moorwood, 534.
- Fiore et al. (2005) Fiore, F., D’Elia, V., Lazzati, D., Perna, R., Sbordone, L., Stratta, G., Meurs, E. J. A., Ward, P., Antonelli, L. A., Chincarini, G., Covino, S., Di Paola, A., Fontana, A., Ghisellini, G., Israel, G., Frontera, F., Marconi, G., Stella, L., Vietri, M. & Zerbi, 2005, ApJ, 624, 853F
- Frank et al. (2006) Frank, S., Bentz, Misty C., Stanek, K. Z., Dietrich, M., Mathur, S., Peterson, B. M. & Atlee, D. W., 2006, astro-ph/0605676v2
- Gehrels (1986) Geherels, N. 1986, ApJ, 303, 336
- Hao et al. (2007) Hao, H., Stanek, K. Z., Dobrzycki, A., Matheson, T., Bentz, M. C., Kuraszkiewicz, J., Garnavich, P. M., Howk, J. C., Calkins, M. L., Worthey, G., Modjaz, M., Serven, J., 2007, ApJ, 659L, 99H
- Lanzetta et al. (1987) Lanzetta, K., Turnshek, D. & Wolf, A. 1987, ApJ, 322, 739
- Ledoux et al. (2006) Ledoux, C., Vreeswijk, P., Smette, A., Jaunsen, A. & Kaufer, A. 2006, GRB Coordinates Network, Circular Service, 5237, 1
- Lopez et al. (1999) Lopez, S., Reimers, D., Rauch, M., Sargent, W. L. W. & Smette, A. 1999, ApJ, 513, 598
- Ménard et al. (2007) Ménard, B., Nestor, D., Turnshek, D., Quider, A., Richards, G., Chelouche, D. & Rao, S. 2007, astro-ph/0706.0898
- Misawa et al. (2002) Misawa, T., Tytler, D., Iye, M., Storrie-Lombardi, L. J., Suzuki, N. & Wolfe, A. M., 2002, ApJ, 123, 1847
- Piranomonte et al. (2007) Piranomonte, S., D’Elia, V., Ward, P., Fiore, F. & Meurs, E. J. A., 2007, astro-ph/0701563
- Porciani et al. (2007) Porciani, C., Viel, M. & Lilly, S. J. 2007, ApJ, 659, 218P
- Prochaska et al. (2007) Prochaska, J. X., Chen, H.-W., Bloom, J. S., Dessauges-Zavadsky, M., O’Meara, J. M., Foley, R. J., Bernstein, R., Burles, S., Dupree, A. K., Falco, E. & Thompson, I. B., 2007, ApJS, 168, 231P
- Prochter et al. (2006a) Prochter, G. E., Prochaska, J. X. & Burles, S. M. 2006a, ApJ, 639, 766
- Prochter et al. (2006b) Prochter, G. E., Prochaska, J. X., Chen, H.-W., Bloom, J. S., Dessauges-Zavadsky, M., Foley, R. J., Lopez, S., Pettini, M., Dupree, A. K. & Guhathakurta, P., 2006b, ApJ, 648, L93
- Sargent et al. (1988) Sargent, W. L. W., Boksenberg, A. & Steidel, C. C. 1988, ApJS, 68, 539
- Steidel (1990) Steidel, C. 1990, ApJS, 72, 1
- Sudilovsky et al. (2007) Sudilovsky, V., Savaglio, S. Vreeswijk, P., Ledoux, C. Smette, A. & Greiner, J., 2007, astro-ph/0705.0706
- Tripp & Bowen (2005) Tripp, T. M., & Bowen, D. V. 2005, in IAU Colloq. 199, Probing Galaxies through Quasar Absorption Lines, ed. P. R. Williams, C.-G. Shu, & B. Ménard (Cambridge: Cambridge Univ. Press), 5, astro-ph/0510312
- Vogt et al. (1994) Vogt, S. S., Allen, S. L., Bigelow, B. C., Bresee, L., Brown, B., Cantrall, T., Conrad, A., Couture, M., Delaney, C., Epps, H. W., Hilyard, D., Hilyard, D. F., Horn, E., Jern, N., Kanto, D., Keane, M. J., Kibrick, R. I., Lewis, J. W., Osborne, J., Pardeilhan, G. H., Pfister, T., Ricketts, T., Robinson, L. B., Stover, R. J., Tucker, D., Ward, J. & Wei, M. Z., 1994, in Proc. SPIE Instrumentation in Astronomy VIII, David L. Crawford, Eric R. Craine, Eds., Volume 2198, p. 362, 362.
| GRB | Instrument | Reference | |
|---|---|---|---|
| 021004 | 2.335 | UVES | 1 |
| 050730 | 3.97 | MIKE | 2,3 |
| 050820 | 2.6147 | HIRES | 3 |
| 050922C | 2.199 | UVES | 4 |
| 060607 | 3.082 | UVES | 5 |
| GRB | ||||||||
|---|---|---|---|---|---|---|---|---|
| 021004 | 2.335 | 1.715a | 2.279a | 1.74738 | 0.035 0.006 | 0.039 0.007 | 0.031 0.006 | 0.051 0.014 |
| 1.81108 | 0.158 0.011 | 0.061 0.010 | 0.191 0.014 | 0.073 0.007 | ||||
| 1.83415 | 0.153 0.008 | 0.051 0.007 | 0.141 0.012 | 0.044 0.010 | ||||
| 2.29800 | 0.898 0.011 | 0.561 0.012 | 0.898 0.018 | 0.520 0.016 | ||||
| 2.32800 | 2.094 0.012 | 1.695 0.012 | 2.584 0.045 | 1.786 0.021 | ||||
| 050730 | 3.97 | 2.965 | 3.887 | 3.25400 | 0.233 0.014 | 0.266 0.013 | 0.249 0.023 | 0.300 0.023 |
| 3.51362 | 0.301 0.014 | 0.167 0.013 | 0.281 0.022 | 0.178 0.015 | ||||
| 3.63952 | 0.063 0.007 | 0.072 0.007 | 0.059 0.009 | 0.062 0.009 | ||||
| 3.96803 | 0.811 0.017 | 0.692 0.019 | 0.874 0.026 | 0.754 0.027 | ||||
| 050820 | 2.6147 | 1.833 | 2.554 | 1.94010 | 0.060 0.005 | 0.122 0.004 | 0.068 0.007 | 0.137 0.009 |
| 2.05973 | 0.041 0.003 | 0.058 0.003 | 0.039 0.004 | 0.057 0.006 | ||||
| 2.07491 | 0.160 0.008 | 0.047 0.008 | 0.113 0.009 | 0.047 0.008 | ||||
| 2.14629 | 0.214 0.010 | 0.208 0.010 | 0.194 0.014 | 0.160 0.012 | ||||
| 2.32375 | 0.168 0.006 | 0.142 0.006 | 0.150 0.009 | 0.119 0.010 | ||||
| 2.35890 | 0.331 0.013 | 0.152 0.013 | 0.292 0.019 | 0.143 0.012 | ||||
| 2.61444 | 1.504 0.010 | 1.091 0.012 | 1.544 0.040 | 1.116 0.106 | ||||
| 050922C | 2.199 | 1.511 | 2.146 | 1.56843 | 0.989 0.031 | 0.600 0.029 | 0.885 0.053 | 0.538 0.058 |
| 1.98911 | 0.561 0.020 | 0.486 0.022 | 0.555 0.034 | 0.407 0.031 | ||||
| 2.00869 | 0.479 0.017 | 0.366 0.017 | 0.477 0.027 | 0.373 0.022 | ||||
| 2.07766 | 0.173 0.009 | 0.142 0.010 | 0.185 0.011 | 0.138 0.015 | ||||
| 2.14204 | 0.040 0.003 | 0.037 0.003 | 0.044 0.004 | 0.035 0.004 | ||||
| 2.19973 | 0.729 0.009 | 0.541 0.009 | 0.735 0.022 | 0.565 0.016 | ||||
| 060607 | 3.082 | 2.207b | 3.014b | 2.21653 | 0.291 0.005 | 0.095 0.007 | 0.263 0.006 | 0.106 0.007 |
| 2.27853 | 0.164 0.004 | 0.093 0.004 | 0.171 0.008 | 0.100 0.008 | ||||
| 2.89048 | 0.619 0.005 | 0.532 0.005 | 0.843 0.020 | 0.460 0.013 | ||||
| 2.91659 | 0.036 0.003 | 0.035 0.003 | 0.031 0.003 | 0.037 0.004 | ||||
| 2.93633 | 1.554 0.005 | 1.111 0.005 | 1.580 0.011 | 1.100 0.011 | ||||
| 3.04979 | 0.271 0.005 | 0.245 0.005 | 0.233 0.008 | 0.224 0.035 | ||||
| 3.07488 | 0.386 0.004 | 0.295 0.004 | 0.399 0.009 | 0.291 0.007 |
| Redshift Bin | ||||
|---|---|---|---|---|