The remarkable X-ray spectrum of the Broad-Line Radio Galaxy 3C 445
Abstract
We present the results of the analysis of an archival 15 ks XMM-Newton observation of the nearby (=0.057) radio-loud source 3C 445, optically classified as a Broad-Line Radio Galaxy. While the RGS data are of insufficient quality to allow a meaningful analysis, the EPIC data show a remarkable X-ray spectrum. The 2–10 keV continuum is described by a heavily absorbed (N cm-2) power law with photon index , and strong () cold reflection. A narrow, unresolved Fe K emission line is detected, confirming previous findings, with EW 120 eV. A soft excess is present below 2 keV over the extrapolation of the hard X-ray power law, which we model with a power law with the same photon index as the hard power law, absorbed by a column density N cm-2 in excess to Galactic. A host of emission lines are present below 2 keV, confirming previous indications from ASCA, due to H- and He-like O, Mg, and Si. We attribute the origin of the lines to a photoionized gas, with properties very similar to radio-quiet obscured AGN. Two different ionized media, or a single stratified medium, are required to fit the soft X-ray data satisfactorily. The similarity of the X-ray spectrum of 3C 445 to Seyferts underscores that the central engines of radio-loud and radio-quiet AGN similarly host both cold and warm gas.
Subject Headings:Galaxies: active — galaxies: radio – galaxies: individual — X-rays: galaxies
1 Introduction
The X-ray emission from AGN is a powerful tool to investigate the structure and physical conditions of the matter in the proximity of the central supermassive black hole. In particular, sensitive X-ray spectroscopy has been very successful in disentangling the contributions from warm and cold matter in Seyferts. At soft X-rays, more than 50% of these sources exhibit complex intrinsic absorption/emission features suggesting the presence of photoionized gas (Crenshaw et al. 2003), containing a significant fraction of the accretion mass. In a handful of sources, blueshifted absorption features were observed, indicating an outflow from the nucleus with quasi-relativistic velocities, 0.1 (Chartas et al. 2002, Pounds et al. 2003, Reeves, O’Brien, & Ward 2003; see also Braito et al. 2007 and references therein). The same absorbing gas is thought to be responsible for the soft X-ray emission lines observed in type-2 sources (Guainazzi et al. 2005; Turner et al. 1997), via scattering or reflection (Netzer 1996). Reflection features at hard X-rays (Fe K line, Compton hump) indicate reprocessing by cold gas in an accretion disk (George & Fabian 1991, Nandra et al. 1997), and provide a way to explore the innermost regions around the black hole where gravitational effects are most important. A prominent, broad Fe K emission line at 6.4 keV, together with a hump peaking around 20–30 keV (the “Compton hump”) indicate reprocessing of the optical-UV emission in colder gas arranged in an accretion disk. A pc-scale molecular torus encases the accretion flow, spurring orientation-based unification models.
In contrast, the inner regions of radio-loud AGN are much more poorly studied, because of the relative rarity and distance of these sources. Broad-Line Radio Galaxies (BLRGs) are by now thought to exhibit weaker reflection features and flatter X-ray continua than Seyfert 1s (e.g., Sambruna, Eracleous, & Mushotzky 2002, and references therein). No evidence for warm absorbers was detected so far in bright BLRGs at energies 2 keV with ROSAT and ASCA (Sambruna et al. 1999, S99 in the following; Reynolds 1997), BeppoSAX (Grandi, Malaguti, & Fiocchi 2006), and with Chandra and XMM-Newton (Gliozzi et al. 2007; Lewis et al. 2005; Ogle et al. 2005; Ballantyne et al. 2004). A recent 120 ks Suzaku observation of 3C 120 shows a featureless continuum at soft X-rays, attributed to the radio jet (Kataoka et al. 2007). It may thus seem that, contrary to Seyferts, the central engines of BLRGs are devoid of warm gas.
However, there are reasons to expect the presence of a medium in BLRGs and other radio-loud AGN. For example, centrifugally-driven winds, lifting matter off the disk’s surface and channeling it down the magnetic field, are a proposed scenario for the origin of relativistic jets (Blandford & Payne 1982); at favorable orientations, these winds would lead to observable discrete absorption/emission features at soft X-rays (Königl & Kartje 1994). A dense environment can also be responsible for slowing down the inner jet via mass entrainment inferred in more beamed sources (Georganopoulos & Kazanas 2003). Unification models for radio-loud sources also postulate the presence of a warm, scattering gas to explain type-2 sources (Urry & Padovani 1995).
The study of the gas environs of BLRGs would benefit from X-ray observations of a source seen at optimal angles, such as to allow us to peek into the central engine while at the same time minimizing the jet contribution. This opportunity is offered by 3C 445, a nearby (z=0.057) and X-ray bright, F erg cm-2 s-1, radio-loud source optically classified as a BLRG but with a large inclination angle as inferred from the radio (§ 2). Previous ASCA observations suggest a heavily absorbed X-ray continuum (Sambruna et al. 1998), similar to obscured radio-quiet AGN.
Here we present and discuss an archival 15 ks XMM-Newton observation of 3C 445, which confirms its type-2 X-ray spectrum and shows the presence of a host of soft X-ray emission lines, for the first time in a radio-loud AGN. The paper is structured as follows. The sources properties and the observations are summarized in §§ 2 and 3. The results of the spectral fits are presented in § 4, while discussion and conclusions follow in §§ 5 and 6. Throughout this paper, a concordance cosmology with H km s-1 Mpc-1, =0.73, and =0.27 (Spergel et al. 2003) is adopted.
2 3C 445
The nearby (z=0.057) radio galaxy 3C 445 has an FRII radio morphology (Kronberg, Wielebinski, & Graham 1986), with a linear extension up to 10′. With a steep radio spectrum between 2.7 and 4.8 GHz (=0.7) and a core-to-lobe intensity ratio R=0.039 (Morganti, Killeen, & Tadhunter 1993), the source is clearly lobe-dominated. From the projected radio size of the source Eracleous & Halpern (1998) infer an inclination 60∘. Using the ratio of the radio fluxes of the approaching (South) and receding (North) jets ( 7.7; Leahy et al. 1997), we derive an upper limit to the inclination angle 71∘ (for p=3 in eq. A10 of Urry & Padovani 1995). In the following we will assume =60∘.
Broad emission lines were observed in the optical unpolarized flux (Eracleous & Halpern 1994; Corbett al. 1998), leading to its classification as a BLRG. The spectrum is very red, and steepens dramatically at UV energies (Crenshaw, Peteron, & Wagner 1988). It has been suggested that the large IR emission is the result of the reprocessing of the optical and UV emission by circumnuclear dust (Elvis et al. 1984). The optical continuum is polarized (Brindle et al. 1990). The amount of reddening derived from the large Balmer decrement (H/H 8; Crenshaw et al. 1988, Osterbrock, Koski, & Phillips 1976) and by the large Pa/H ratio (5.6; Rudy & Tokunaga 1982) is E(B-V)=1 mag. For a standard dust-to-gas conversion ratio a column density N cm-2 is derived. This is one order of magnitude larger than the Galactic column density in the direction to the source, N cm-2, derived from 21 cm measurements (Murphy et al. 1996). Based on these properties, and on the limits to the viewing angle, we suggest we are seeing 3C 445 almost edge-on. Thus, the beamed jet is not expected to contribute significantly to the emission from the source. In fact, for =60∘ and a bulk Lorentz factor , the Doppler factor of the jet is . Thus, the jet emission is actually de-boosted (, where is the radio energy index; Urry & Padovani 1995).
At odds with its classification as a type-1 source, 3C 445 exhibits an X-ray spectrum very similar to Seyfert 2s. Previous ROSAT and ASCA observations (Sambruna et al. 1998, S98 in the following), while of insufficient quality to allow a full spectral decomposition, indicated a heavily absorbed (N cm-2) continuum above 3 keV, plus a narrow Fe K line with EW 250 eV, and a soft excess modeled with an unabsorbed power law. From a later reanalysis of the data, S99 noted weak emission lines below 2 keV in the non-simultaneous ROSAT and ASCA data, attributed to ionized elements from O to Si. The limited quality of the data, however, prevented a detailed analysis of the lines and their origin.
Moreover, 3C 445 was detected with the Burst Alert Telescope onboard Swift in the energy range 15–150 keV (Tueller 2007, priv. comm.) and with the PDS onboard BeppoSAX (Grandi, Malaguti, & Fiocchi 2006; Dadina 2007). However, 3C 445 lies close (30′) to the cluster of galaxies A2440 (z=0.094), and contamination of the hard X-ray flux by the cluster can not be ruled out in the BeppoSAX data. Nevertheless, the broad-band BeppoSAX spectrum was fitted with a partial-covering, dual-absorber model, yielding and N cm-2. These data also gave the first measure of the reflection continuum (after subtraction of the expected cluster contribution); the latter is weakly constrained, with reflection fraction and large uncertainties. Here, is the fraction of the reflector’s solid angle seen by the illuminating continuum (George & Fabian 1991).
Thus, previous X-ray observations of 3C 445 provided tantalizing clues that the 0.5–10 keV emission from this BLRG is complex. Moreover, analysis of the XMM-Newton field of view of 3C 445 reveals the presence of a nearby (1.3′) soft X-ray AGN (Grandi et al. 2004), which was not resolved at the ASCA and BeppoSAX poor angular resolutions. Thus, the XMM-Newton observation presented here yields the very first high-quality X-ray spectrum of this source.
3 Observations
XMM-Newton observed 3C 445 on December 6, 2001 for a total exposure of 23.8 ks. After screening the data the net exposure, which includes correction for deadtimes, was 15.3 ks with the EPIC pn, 21.3 ks with MOS1, and 21.2 ks with MOS2. The count rate of the source in 0.4–10 keV is 0.59 0.006 c/s with the pn and 0.18 0.003 c/s with both MOS CCDs. With the RGS we collected a total of 280 counts with both instruments in the energy range 0.4–2 keV.
The pn, MOS1, and MOS2 cameras were operating in Small Window mode,
with the Thin filter applied. The XMM-Newton data have been processed and
cleaned using the latest Science Analysis Software (SAS ver 7.0) and
analyzed using standard software packages (FTOOLS ver. 6.1, XSPEC
ver. 11.3). In order to define the threshold to filter for
high-background time intervals we extracted the 10–12 keV light curve
and filtered out the data when the light curve is 2 above its
mean. The inspection of this light curve shows that there was no
flaring activity during this observation. For our analysis only
events corresponding to pattern 0–12 for the EPIC MOS and pattern
0–4 for the pn were used. EPIC pn source spectra were extracted using
a circular region of 30′′, while background data were extracted
from a circular region with radius 1′ centered at
2.5′ from the source. This is sufficient to include most of the
PSF, while excluding the 1.3′ X-ray source 1WGA J2223.7-0206
(Grandi et al. 2004). The EPIC MOS1 and MOS2 data were extracted using
a source extraction region of 30′′ radius and two background
regions with identical size (30′′), selected on the nearby CCDs.
Response matrices and ancillary response files at the source position
have been created using the sas tasks
arfgen and rmfgen.
The EPIC MOS1 and MOS2 data were summed for the spectral fits and the
background-subtracted spectrum binned to have at least 20 counts in
each energy bin; the background-subtracted EPIC pn data were binned to
have at least 30 counts per bin, to validate the use of the
statistics. The spectra were fitted within XSPEC v. 11.3.2ad.
Finally, we checked that there were no discrepancies between spectra
extracted with this selection and spectra extracted with pattern 0.
4 Spectral Fitting Results
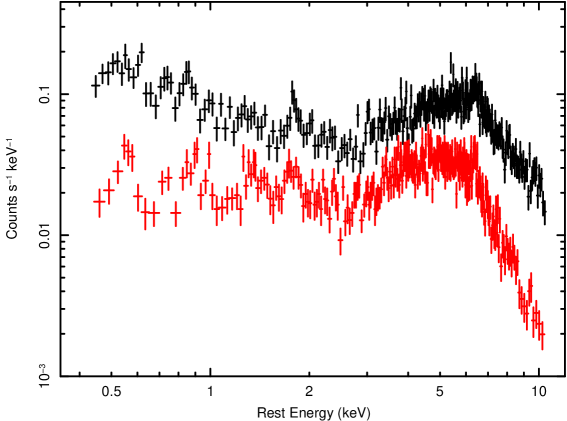
We first fitted the EPIC pn and MOS spectra with a simple power law plus Galactic absorption. As expected this was not a good fit (), yielding a photon index . Figure 1 shows the data in the source’s rest-frame, with the model removed for clarity. At energies above 3 keV, a curved continuum is visible indicating heavy absorption. The Fe K line at 6.4 keV is also apparent. At soft X-rays, several emission features can be seen in the energy range 0.4–2 keV, attributed to lighter elements from O to Si. In the remainder of this section, all energies are in the source’s rest-frame unless otherwise specified.
4.1 The Continuum
We first concentrated on modeling the continuum. At the harder energies, 3 keV, the bumpy shape of the continuum (Fig. 1) suggests heavy absorption, as in the previous ASCA observations (S98). Fitting the EPIC data in 3–10 keV with a single power law plus free column density indeed yields significant absorption, N cm-2, with and =1.2/386. The residuals of this model clearly show an emission line feature at 6 keV (Fig. 1), identified with the Fe K line detected with ASCA (S98). Ignoring the energy range 5–7 keV, where possible contributions from a broad relativistic Fe K line are often seen in Seyferts, yields an acceptable fit () but still an unusually hard continuum, , and excess column density N cm-2. Thus, the flat continuum slope above 3 keV is not an artifact of a complex profile of the Fe K line.
For the remaining of the spectral fits, we now consider the full 0.4–10 keV band with the 5–7 keV bins added back. Addition of the lower energy bins shows that the 0.4–3 keV flux lies 2–3 orders of magnitude above the extrapolation of the absorbed power law, indicating the presence of a soft continuum component. This confirms the previous findings from ASCA and ROSAT joint fits, which required the presence of a steeper power law at the softer energies possibly related to scattering of the nuclear radiation by ambient gas/dust (S98). We thus added a second power law component to the fit, absorbed by a column density N and with photon index tied to the index of the hard power law, . This fit yields , still poor primarily because of unaccounted emission lines111If narrow Gaussians are added to model the X-ray lines (Table 2), the .. The photon index is now , with an absorption column density N cm-2 above the Galactic value acting mainly on the soft power law. Leaving the soft and hard indices free to vary yields 0.11 and 0.13, both still quite flat, and .
The presence of the Fe K emission line (see below) and the BeppoSAX PDS
detection suggest that addition of a reflection continuum might be
necessary. We thus added cold reflection modeled with pexrav
(Magdziarz & Zdziarski 1995), where the abundances were fixed to
solar values and the inclination angle to 60∘. The free
parameters of the fit were the reflection fraction, , and the
normalization. The fit is greatly improved, =117, and
yields very strong reflection, . While not physical, taken
at face value this would indicate a strong reflection component
dominating the emission at energies 8 keV.
However, if we add a third layer of absorption to the model, specifically, a third power law with photon index tied to and column density N, the strength of the reflection component decreases, , and N cm-2. Due to the limited EPIC bandpass and the complexity of the spectrum there is no simple way based on the data to decide whether the 2–10 keV continuum is dominated by the reflection component, or if instead multiple layers of absorption are present. Here we adopt the latter model, specifically, three distinct cold absorbers and reflection (Table 1); as we discuss later, there is no evidence for this source to be Compton-thick and thus dominated by reflection in the 2–10 keV energy band. Our approved Suzaku observations will allow us to discriminate among the various possibilities, which clearly have different physical implications, and measure the intrinsic AGN flux.
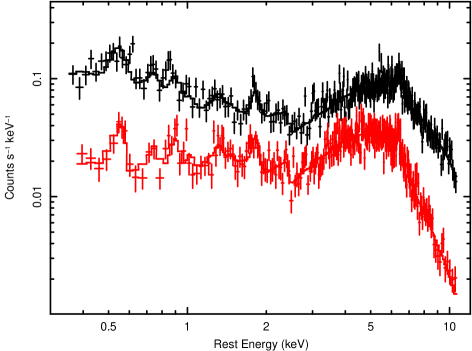
The best spectral decomposition of the 0.4–10 keV continuum is obtained with a model including: three powerlaws, all with the same photon index , and two layers of cold absorption, N cm-2; and strong () cold reflection. Figure 2 shows the data fitted with the above model (and with the inclusion of the emission lines, see below), and the best-fit model itself. The best-fit parameters and their 90% uncertainty are reported in Table 1, where the observed fluxes and intrinsic (absorption-corrected) luminosities are also given. The covering fractions of the three cold absorbers are 84% (N), 4% (N), and 12% (N).
To exclude that the line-like residuals at soft X-rays are due to
inappropriate continuum modeling, we attempted fitting the EPIC
spectrum with the baseline continuum model but using an ionized
reflector (reflion) instead of the cold one. This model is
known for producing relatively strong soft X-ray emission lines for
intermediate ionization states (Ross, Fabian, & Young 1999). The fit
with this model is worse by =30. Basically, the model
fails to account simultaneously for the various ionization properties
at soft and hard X-rays. Specifically, accounting for the Mg and Si
lines would require a strong high-ionization Fe line at 6.7–6.9 keV,
which is not observed.
Note that the measured continuum photon index is rather hard, , flatter than usually observed in Seyferts or other BLRGs. From a Suzaku observation of 3C 120, Kataoka et al. (2007) derive , similar to what was obtained from ASCA observations of BLRGs (S99). The limited EPIC bandpass, together with the presence of complex absorption, most likely conjures to produce an apparently hard continuum. Fixing to 1.7, in fact, yields an equivalent fit, with an increase of the column densities of 20%. This reflects the well-known spectral degeneracy between slope and absorption column over a limited bandpass ( 10 keV).
The total observed fluxes, F and F erg cm-2 s-1, are clearly lower limits to the true AGN fluxes in these energy bands, and fully consistent with the fluxes measured with ASCA and ROSAT (S98). A 2–10 keV observed flux lower by a factor 2 was measured in earlier BeppoSAX observations222Note, however, that the BeppoSAX and ASCA datasets contained a (presumably small) contribution from the 1.3′ source; thus, the factor 2 variations between the BeppoSAX and XMM-Newton epochs is clearly a lower limit. (Grandi et al. 2006). Thus, there is evidence that the medium-hard X-ray flux varied significantly over the timescale of almost 2 years between the BeppoSAX and XMM-Newton observing epochs.
Extrapolating the best-fit model at harder X-ray energies, we find a 15–100 keV observed flux of F erg cm-2 s-1. This is a factor 2 larger than the BAT flux threshold, and consistent with the claimed detection.
4.2 The Fe line region
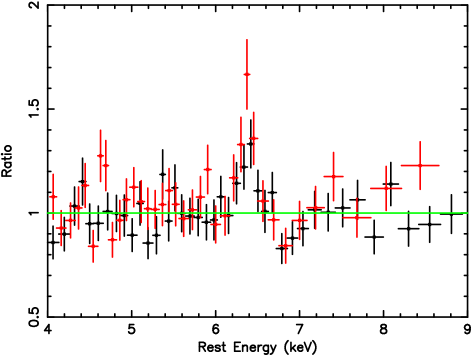
In Figure 3a we plot the residuals of the baseline best-fit continuum model discussed above (a power law with three absorbers plus cold reflection), zooming in the Fe K emission line region. These residuals were obtained by fitting the full-band EPIC data minus the 5–7 keV region, and then adding back the 5–7 keV for the plot.
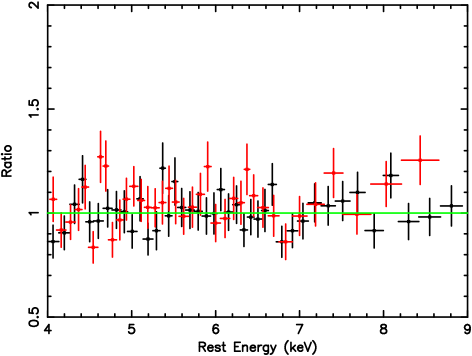
The prominent emission line at 6.4 keV is the Fe K emission line, present both the pn and MOS data (Fig. 1). Adding a Gaussian improves the fit significantly, =57 for 3 additional parameters. The line is narrow, eV, and unresolved at 95% confidence; its observed Equivalent Width against the total continuum is EW 120 eV (Table 2), while the EW with respect to the reflection continuum only is eV. Adding a broad Gaussian to the narrow line does not improve the fit and its width is completely unconstrained. Figure 3b shows the residuals after fitting a narrow Gaussian.
The measured EW with respect to the total observed continuum is by itself suggestive of a strong reflection component (George & Fabian 1991). Indeed, the intensity of the Fe K line depends at first order on the amount of reflection, the iron abundance, and the inclination angle. Taking into account the limited bandpass of XMM-Newton, the well known degeneracy between R and , and the complex absorption in this source, the amount of reflection cannot be directly derived from the continuum itself. However, assuming an inclination angle of 60∘, solar abundances, and an intrinsic of 1.4 the ratio between the Fe K emission line and the reflected component is expected to be . From our best fit we derive a ratio of about , close to the expected value. On the other hand, if the normalization of the Fe line and the reflection continuum are linked together the residuals in 5–7 keV are flat and no additional broad or narrow components to the Fe K emission line are required.
In both Figure 3a-b, an absorption feature is present around 6.8 keV. The dip was modeled with an inverted Gaussian, leading to a modest (=10) improvement of the fit, significant at 97% confidence from the F-test. The fitted energy and EW are E=6.87 0.09 keV and EW=40 eV. If the absorption feature is real, the closest candidate for its identification would be the 12 transition of FeXXV at 6.701 keV, blueshifted by a modest amount, . The EW would imply a column density Ncm-2. However, the feature significance is hindered by the choice of the underlying continuum model; a stronger reflection component would reduce the significance of the dip. This is because of the correlation between and : a stronger reflection component would allow the slope to become slightly steeper, decreasing the contrast between the continuum and the absorption features.
4.3 Soft X-ray Emission Lines
At softer energies, several emission lines are present in 0.4–1 keV and further around 2 keV (Figure 1). We interpret these features as emission lines due to the lighter elements from O to Si. Table 2 lists the observed line energies, fluxes, EWs, and their identifications.
The lack of a strong FeL complex at 0.9–1 keV provides evidence
against an origin of the X-ray lines in collisionally ionized gas,
such as the galaxy ISM. Adding a thermal model (apec) to the
best-fit model yields =1.09/544, and leaves line-like
residuals at 0.7 and 0.8 keV, and at 1.3 and 1.8 keV. The fitted
temperature is keV, with abundances
solar. Previous ROSAT PSPC data showed the source is consistent with
being point-like (S98), although higher-resolution Chandra data are
needed to confirm this result.
A strong possibility is an ionized medium, most likely photoionized by the intense nuclear light, as commonly observed in Seyfert galaxies. Indeed, we detect two emission features at 0.74 and 0.87 keV which could be interpreted as the Radiative Recombination Continuum (RRC) of OVII and OVIII, respectively (Table 2). The RRC features link unequivocally the origin of the emission lines to a plasma photoionized by the AGN, generally at a temperature of a few eV (Liedahl & Paerels 1996). At the EPIC resolution the RRC features are unresolved. In the case of OVII RRC, a contribution to the flux from the nearby ( Å) FeXVII 3s-2p line can not be excluded; usually, however, the OVII RRC is much brighter (factor 2 or more) than FeXVII (Kinkhabwala et al. 2002).
We thus added a photoionization model component to describe the soft
X-rays, using the code XSTAR (Bautista & Kallman 2001). The
latter describes the emission lines expected from a medium whose
physical conditions are summarized in the ionization parameter
ergs cm/s, where is the luminosity of the
photoionizing continuum, the gas density, and its distance from
the nucleus. Other parameters are the element abundances relative to
solar, the column density of the gas, N, and the
normalization. Since the model is clearly underconstrained by the
data, we fixed the elemental abundances to their best-fit values
(consistent with solar within the uncertainties), and the column
density to N cm-2, similar to the columns observed in
Seyfert 1s (Reynolds 1997). Leaving N free to vary does not
improve or change the fit, and furthermore, the value is
unconstrained. Only the ionization parameter and the normalization
were left free to vary.
We find that the EPIC data require two separate media, one with
ionization parameter 1.9, accounting for most of the
O and Ne lines, and a second one with –0.09,
responsible for the Mg and Si lines. The addition of a second ionized
medium is significant at 99.9% confidence ( for 2
additional parameters). As discussed elsewhere (NGC 4507; Matt et
al. 2004) the need for two ionization parameters does not imply that
the media are physically separate; in fact, they could represent two
different zones of the same cloud. The parameters of the best-fit
model with XSTAR are reported in Table 1, and the model is
shown in Figure 2. The individual lines fluxes and EWs are
listed in Table 2.
Albeit the low quality of the RGS data (§ 3), we inspected the RGS1, 2 spectra to search for the brightest emission lines. The data are very noisy and affected by large (50% or more) errorbars; only a slight hint (1) for a possible line at 0.57 keV is present, with a total of 10 counts in the feature. Thus, we will not discuss the RGS data any further.
In conclusion, an archival 15 ks EPIC observation of 3C 445 provides evidence for a very complex X-ray spectrum. In particular, several X-ray emission lines are present in 0.4–2 keV, most likely due to a photoionized gas. To our knowledge, this is the first time that soft X-ray emission lines are detected in a radio-loud AGN. The presence of X-ray lines from 3C 445 was previously claimed based on non-simultaneous ROSAT and ASCA spectra (S99), which also indicated a heavily absorbed continuum. In addition to confirming these features, the EPIC data also provide evidence for a strong reflection continuum and/or several layers of cold absorption of the power law continuum.
5 Discussion
Overall, the X-ray spectrum of 3C 445 is remarkably similar to a Seyfert 2, at odds with its classification as type-1 AGN. The EPIC spectrum indicates a strong, albeit uncertain without hard X-ray observations, reflection component which is expected to dominate the continuum above 10 keV, and indeed 3C 445 was detected with the BAT and PDS experiments. Given the large inclination angle of the radio source (§ 2), it is quite possible that the Compton hump is due to reflection off a medium along the line of sight (the torus wall?). The Fe K line is narrow, with no evidence for a broad component linked to the disk. Its EW 120 eV is consistent with being produced by both transmission and reflection through a cold medium with column NH cm-2 (Turner et al. 1997).
Alternatively, the requirement in the EPIC data of an unusually strong reflection component is alleviated by adding multiple cold absorbers to the continuum model (§ 4.1). This scenario would imply the presence of different layers of absorption, which could possibly totally obscure the primary nuclear X-ray continuum in the EPIC bandpass. To this regard, we tested the possibility that 3C 445 is Compton-thick, i.e., there is yet another, unaccounted absorber, NH cm-2, using the diagnostic diagram of Bassani et al. (1999). This is a plot of the Fe K EW versus the thickness parameter T, defined as the ratio of the total 2–10 keV flux of the source and the intrinsic [OIII] flux (Bassani et al. 1999). In this plot, Compton-thick sources tend to occupy the region of large EW and small T values.
The observed [OIII] flux of 3C 445 is F erg cm-2 s-1 (Tadhunter et al. 1998). Correcting for the reddening using the observed Balmer decrement (§ 2), the intrinsic flux is F erg cm-2 s-1. From the 2–10 keV flux in Table 1, the T parameter is T=2.2. This value and the Fe K EW 120 eV (Table 1) place 3C 445 in the region of AGN with absorption column densities N cm-2 in Figure 1 of Bassani et al. (1999), near the Seyfert 1s locus. For comparison, the two radio-loud sources in the sample of Bassani et al., Cyg A and NGC 6251, have EW=380 eV and T=22, and EW=390 eV and T=2, respectively; they are located among (NGC 6251) or close (Cyg A) to the Seyferts. Thus, there is no evidence based on the presently available data that 3C 445 is Compton-thick.
Perhaps the most striking result of the EPIC data analysis is the detection of X-ray emission lines below 2 keV. Again, this is similar to what generally found in obscured radio-quiet AGN (Turner et al. 1997, Guainazzi et al. 2005), where photoionization is generally dominant but with a non-negligible contribution from resonant scattering (Kinkhabwala et al. 2002). Indeed, the EPIC spectrum of 3C 445 is very similar to the Compton-thin Seyfert 2 NGC 4507, where emission lines from ionized O, Ne, Mg, and Si (as well as a strongly absorbed continuum) were detected with XMM-Newton with similar EWs (Matt et al. 2004). As in the case of NGC 4507, two ionized emitters or a single emitter with a range of ionization parameters are required for 3C 445. The ionization parameters we measure for 3C 445 (Table 1) are within the range () or slightly lower () than typically found for type-2 Seyferts (e.g., Kinkhabwala et al. 2002).
We conclude that the central engine of 3C 445 hosts a warm gas with properties similar to radio-quiet obscured AGN, which is responsible for the observed soft X-ray lines, most likely through scattering. The location of this “warm mirror” remains unknown with the present data. Using Chandra and HST [OIII] images, Bianchi, Guainazzi, & Chiaberge (2006) showed that the soft X-ray emission of obscured radio-quiet AGN is extended and spatially coincident with the NLR. Unfortunately, no Chandra images are yet available to test this hypothesis in the case of 3C 445. Based on the fact that we can see the soft X-ray lines, we can at least locate the warm mirror further out from the cold gas affecting the continuum emission (Matt et al. 2004). Another possibility is an outflow extending vertically above the plane of the torus, particularly intriguing given the radio-loud nature of 3C 445 and the presence of a radio jet (see below).
From the EPIC best-fit model, we calculated an upper limit to the distance of the warm gas from the black hole, using the gas parameters from Table 1. Under the assumption that the gas forms a thin shell, , for a nuclear ionizing (corrected for absorption) luminosity L erg s-1. Assuming that the medium has a density similar to the BLRs ( cm-3), pc. At these distances the gas velocity should be 5,000–16,000 km/s for a black hole mass M⊙. If instead cm-3, consistent with the NLRs, then pc and km/s. These scenarios can be tested with high-resolution X-ray spectroscopy which will resolve the individual lines yielding the density and location of the photoionized gas, and will measure intrinsic velocity dispersions/energy shifts.
The covering fraction of the soft X-ray emitting gas can also be calculated from the normalization (luminosity) of the photoionized emission modeled by XSTAR. The photoionized matter may exist in a shell of gas around the photoionizing AGN source, covering a fraction () of sr-1 solid angle. From the XSTAR code, the normalization () of a component of photoionized gas is related to the covering fraction by , where is the distance to 3C 445 in kpc and is the ionizing luminosity in units of erg s-1. From above, erg s-1, while kpc2. From the XSTAR fits, the luminosity of the photoionized emission corresponds to erg s-1, with approximately equal contribution from the high and low ionization zones, while the XSTAR normalization corresponds to ph cm-2 s-1 (with an uncertainty of %) for an assumed column density N cm-2. Thus this translates into a covering fraction 40% for N cm-2. If the assumed column density is higher, N cm-2, then the required covering fraction is correspondingly lower, e.g., %. Given that by definition , the lower limit on the column density of the soft X-ray emitting gas is cm-2 at a maximum distance of kpc.
In any event, a more accurate estimate of the covering fraction of the photoionized gas cannot be made without a measurement of the ionized column of gas in absorption against the direct continuum emission. This may be achievable in the forthcoming long Suzaku observation of 3C 445, through refinement of the measurement of the possible Fe XXV absorption line near 6.8 keV, or from the possible detection of softer absorption lines from He/H-like Si and S near 2 keV.
The detection of soft X-ray lines in 3C 445 has implications for other BLRGs in the context of unification models. In radio-quiet Seyferts, the “warm mirror”, is commonly unified with the ionized outflows producing the absorption features observed in the soft X-ray spectra of type-1 objects, the “warm absorber” (Netzer 1996). Assuming that the general unification scenario of Seyferts holds for radio-loud AGN as well (Urry & Padovani 1995), and that 3C 445 is fairly representative of other radio-loud AGN, one can infer that a warm absorbing gas should be present in the more aligned counterparts of 3C 445, producing absorption features at soft X-rays. If this is indeed the case, one may wonder why these features were not detected in BLRGs.
The answer is twofold. On one hand, there are only four bright BLRGs traditionally known: 3C 120, 3C 382, 3C 390.3, and 3C 111, all of them observed extensively at X-rays. Both superluminal sources 3C 120 and 3C 111 lie at low Galactic latitudes, preventing a detailed study of the emission below 2 keV. In addition, 3C 120 displays a variable soft excess attributed to the jet (Kataoka et al. 2007); unless the absorber subtends a large solid angle to the jet (e.g., entrained matter), any absorption feature will be weak and difficult to detect against the beamed non-thermal continuum. In 3C 382 the soft excess is also variable (Barr & Giommi 1992), and contributions to the soft X-rays from the diffuse circumnuclear thermal emission (Gliozzi et al. 2007) could mask weak absorption features.
On the other hand, deep X-ray observations of BLRGs with a signal-to-noise ratio comparable to Seyfert 1s were never performed in the past. High-resolution grating observations of BLRGs so far exist only for 3C 382 (HETGS, 120 ks) and 3C 390.3 (RGS, 90 ks). In the former, two emission lines at 0.89 and 1.04 keV were marginally detected (Gliozzi et al. 2007) but their origin is not clear due to the limited quality of the MEG data.
The best candidate BLRG for the detection of absorption features is arguably 3C 390.3. In fact, this galaxy has a low (N cm-2) Galactic column, a relatively large X-ray flux (F erg cm-2 s-1), and a powerlaw continuum (S99). Previous X-ray observations of 3C 390.3, however, provide controversial evidence for the presence of absorption. A variable column density of cold gas was observed in multiepoch X-ray spectra of this BLRG (Grandi et al. 1999), while a 40 ks ASCA spectrum provided evidence for an absorption edge at 0.74 eV with optical depth , identified eith the OVII edge at 0.739 eV (S99). However, no apparent absorption but instead weak emission lines were detected at soft X-rays in a 90 ks XMM-Newton EPIC and RGS exposure (Lewis et al. 2007, in prep.), confirmed in our recently acquired Suzaku data (Sambruna et al. 2007, in prep.).
We now comment on the apparent discrepancy of the X-ray spectrum with the optical type-1 classification of 3C 445. This difficulty may be circumvented in the “clumpy hydromagnetic wind” torus model of Elitzur & Shloshman (2007; see also Königl & Kartje 1994, Everett 2005). In this model, the torus is not a continuous, donut-like structure but is composed of clouds distributed around the equatorial plane of the AGN (see Fig. 3 in Elitzur 2006); the torus extends in the inner regions beyond the dust sublimation radius, where the clouds become atomic and ionized yielding broad optical lines and warm X-ray absorption. For a given number of clouds and their distribution on the equatorial plane, classification of an AGN as type 1 or 2 depends on whether the line of sight intercepts enough obscuring clouds.
The multiwavelength properties of 3C 445 can be reconciled within this scenario. The inclination angle of 3C 445 from the radio is larger (§ 2) than the current estimates of the average opening cone of the “torus”, ∘ (Schmitt et al. 2001), implying we might be looking at the nucleus of 3C 445 through significant number of clouds. Our line of sight could be such to be obscured by matter in the outer, colder (N cm-2) molecular clouds of the toroidal distribution, while at the same time intercepting the broad emission lines from innermost ionized BLR clouds if the latter are lifted at some height above the plane (Elitzur & Shlosman 2007). The BLR clouds could also be responsible for the lower column density, N cm-2, and, via scattering, the soft X-ray continuum (Table 1). The external dustier clouds would be responsible for the observed continuum and H polarization, as well as for the strong IR continuum emission.
The clumpy wind scenario provides a viable scenario also for the X-ray emission lines from 3C 445. Königl & Kartje (1994) suggested that the X-ray warm absorber/emitter observed in Seyferts coincides with clouds uplifted from the surface of the accretion disk by the magnetic field in a hydromagnetically driven sub-relativistic outflow (Blandford & Payne 1982). Indeed, X-ray observations at moderate-to-high spectral resolution of Seyferts 1/2 detected signatures of winds. A large proportion of these sources exhibit soft X-ray absorption lines blueshifted relative to systemic, indicative of low-velocity, 1,000 km/s, outflows; at larger luminosities, fast outflows ( 0.1c) were observed in a small number of systems on the basis of FeK absorption features (see Braito et al. 2007 and references therein).
In the clumpy wind model the conditions for developing such an outflow become particularly favorable toward the inner parts of the disk (Elitzur & Shlosman 2007). From this perspective, it is tantalizing to speculate that the X-ray emission lines observed from 3C 445 originate from an inner outflow component, perhaps related to the formation of the radio jet itself (Blandford & Payne 1982; Königl & Kartje 1994; Proga et al. 2000). The EPIC data, however, do not provide conclusive evidence for the presence of an outflow in 3C 445. A weak absorption feature is observed at 6.8 keV, but its significance is hindered by the choice of the underlying continuum model (§ 4.2).
6 Conclusions
Using an archival 15 ks XMM-Newton spectrum we have shown that the X-ray emission from the nearby BLRG 3C 445 is quite complex. In particular, its properties are remarkably similar to those of type-2 radio-quiet AGN, with a heavily absorbed continuum and a strong reflection component, a narrow Fe K emission line, and several soft X-ray lines consistent with reflection/scattering off a warm “mirror”.
The soft X-ray lines are of particular interest, as this is the first time that such features are detected in a BLRG and indeed in a radio-loud AGN. Again, their properties are similar to radio-quiet Seyfert 2s. The most likely origin of the lines is from a photoionized gas close to the nucleus. Follow-up X-ray spectroscopy of 3C 445 with higher resolution is strongly encouraged to determine the location and density of the warm medium.
If unification models hold, and if 3C 445 is representative of radio-loud AGN, one would expect to observe absorption features from the same “warm mirror” in BLRGs more favorably oriented close to the line of sight. So far, such features have eluded detection. Future high-quality X-ray observations of radio-loud AGN of both type 1 and 2 are needed to investigate the gas content of these systems.
References
- (1)
- (2) Ballantyne, D.R., Fabian, A. C., & Iwasawa, K. 2004, MNRAS, 354, 839
- (3)
- (4) Barr, P. & Giommi, P. 1992, MNRAS, 255, 495
- (5)
- (6) Bassani, L. et al. 1999, ApJS, 121, 473
- (7)
- (8) Bautista, M.A. & Kallman, T.R. 2001, ApJS, 134, 139
- (9)
- (10) Bianchi, S., Guainazzi, M., & Chiaberge, M. 2006, A&A, 448, 499
- (11)
- (12) Blandford, R.D. & Payne, D.G. 1982, MNRAS, 199, 883
- (13)
- (14) Braito, V. et al. 2007, ApJ, submitted
- (15)
- (16) Brindle, C., Hough, J. H., Bailey, J. A., Axon, D. J., Ward, M. J., Sparks, W. B., & McLean, I. S. 1990, MNRAS, 244, 577
- (17)
- (18) Chartas, G., Brandt, W. N., Gallagher, S. C., & Garmire, G. P. 2002, ApJ, 579, 169
- (19)
- (20) Corbett, E.A., Robinson, A., Axon, D.J., Young, S., & Hughes, J.H. 1998, MNRAS, 296, 721
- (21)
- (22) Crenshaw, M. et al. 2003, ARA&A, 41, 117
- (23)
- (24) Crenshaw, M., Peterson, B. M., & Wagner, R. M. 1988, AJ, 96, 1208
- (25)
- (26) Dadina, M. 2007, A&A, 461, 1209
- (27)
- (28) Elitzur, M. & Shlosman, I. 2007, ApJ, in press (astroph/0605686)
- (29)
- (30) Elitzur, M. 2006, in The Central Engine of AGN, ASP Conference Series, eds. L.C.Ho and J.-M. Wang (astroph/0612458)
- (31)
- (32) Elvis, M., Willner, S. P., Fabbiano, G., Carleton, N. P., awrence, A., & Ward, M. J. 1984, ApJ, 280, 574
- (33)
- (34) Eracleous, M. & Halpern, J.P. 1998, ApJ, 505, 577
- (35)
- (36) Eracleous, M. & Halpern, J. P. 1994, ApJS, 90, 1
- (37)
- (38) Everett, J. 2005, ApJ, 631, 689
- (39)
- (40) Georganopoulos, M. & Kazanas, D. 2003, ApJ, 594, L27
- (41)
- (42) George, I. M. & Fabian, A.C. 1991, MNRAS, 249, 352
- (43)
- (44) Gliozzi, M., Sambruna, R.M., Eracleous, M., & Yaqoob, T. 2007, ApJ, submitted
- (45)
- (46) Grandi, P., Malaguti, G., & Fiocchi, M. 2006, ApJ, 642, 113
- (47)
- (48) Grandi, P., Foschini, L., Masetti, N., & Palazzi, E. 2004, A&A 418, 907
- (49)
- (50) Grandi, P. et al. 1999, A&A, 343, 33
- (51)
- (52) Guainazzi, M., Fabian, A.C., Iwasawa, K., Matt, G., & Fiore, F. 2005, MNRAS, 356, 295
- (53)
- (54) Kataoka, J. et al. 2007, PASJ, in press (astroph/0612754)
- (55)
- (56) Kinkhabwala, A. et al. 2002, ApJ, 575, 732
- (57)
- (58) Königl, A. & Kartje, J.F. 1994, ApJ, 343, 446
- (59)
- (60) Kronberg, P. P., Wielebinski, R., & Graham, D. A. 1986, A&A, 169, 63
- (61)
- (62) Leahy, J. P., Black, A. R. S., Dennett-Thorpe, J., Hardcastle, M. J., Komissarov, S., Perley, R. A., Riley, J. M., & Scheuer, P. A. G. 1997, MNRAS, 291, 20
- (63)
- (64) Lewis, K.T., Sambruna, R.M., Eracleous, M., & Ballantyne, D. 2007, in prep.
- (65)
- (66) Lewis, K.T., Eracleous, M., Gliozzi, M., Sambruna, R.M., & Mushotzky, R.F. 2005, ApJ, 622, 816
- (67)
- (68) Liedahl, D.A. & Paerels, F. 1996, ApJ, 468, L33
- (69)
- (70) Magdziarz, P. & Zdziarski, A. 1995, MNRAS, 273, 837
- (71)
- (72) Matt, G., Bianchi, S., D’Ammando, F., & Martocchia, A. 2004, A&A, 421, 473
- (73)
- (74) Morganti, R., Killeen, N. E. B., & Tadhunter, C. N. 1993, MNRAS, 263, 1023
- (75)
- (76) Murphy, E. M., Lockman, F. J., Laor, A., & Elvis, M. 1996, ApJS, 105, 369
- (77)
- (78) Nandra, K., George, I.M., Mushotzky, R.F., Turner, T.J., & Yaqoob, T. 1997, ApJ, 477, 602
- (79)
- (80) Netzer, H. 1996, ApJ, 473, 781
- (81)
- (82) Ogle, P.M. et al. 2005, ApJ, 618, 139
- (83)
- (84) Osterbrock, D. E., Koski, A. T., & Phillips, M. M. 1976, ApJ, 206, 898
- (85)
- (86) Pounds, K. A., Reeves, J. N., King, A. R., Page, K. L., O’Brien, P. T., & Turner, M. J. L. 2003, MNRAS, 345, 705
- (87)
- (88) Proga, D., Stone, J.M., & Kallman, T.R. 2000, ApJ, 543, 686
- (89)
- (90) Reeves, J. N., O’Brien, P. T., & Ward, M. J. 2003, ApJ, 593, L65
- (91)
- (92) Reynolds, C. 1997, MNRAS, 286, 513
- (93)
- (94) Ross, R.R., Fabian, A.C., & Young, A.J. 1999, MNRAS, 306, 461
- (95)
- (96) Rudy, R. J. & Tokunaga, A. T. 1982, ApJ, 256, L1
- (97)
- (98) Sambruna, R.M. et al. 2007, in prep.
- (99)
- (100) Sambruna, R.M., Eracleous, M., & Mushotzky, R.F. 2002, NewAR, 46, 215
- (101)
- (102) Sambruna, R.M., Eracleous, M., & Mushotzky, R. 1999, ApJ, 526, 60 (S99)
- (103)
- (104) Sambruna, R.M., George, I.M., Mushotzky, R.F., Nandra, K., & Turner, T.J., 1998, ApJ, 495, 749 (S98)
- (105)
- (106) Schmitt, H.R. et al. 2001, ApJ, 555, L163
- (107)
- (108) Spergel, D. N., et al. 2003, ApJS, 148, 175
- (109)
- (110) Tadhunter, C.N., Morganti, R., Robinson, A., Dickson, R., Villar-Martin, M., & Fosbury, R.A.E. 1998, MNRAS, 298, 1035
- (111)
- (112) Turner, T. J., George, I.M., Nandra, K., & Mushotzky, R.F. 1997, ApJ, 488, 164
- (113)
- (114) Urry, C.M. & Padovani, P. 1995, PASP, 107, 803
- (115)
| Table 1: EPIC Best-fit Parameters† | ||
|---|---|---|
| Parameter | ||
| N | 22.5 cm-2 | |
| N | 5.8 cm-2 | |
| N | 4.2 cm-2 | |
| 1.39 | ||
| Rrefl | 1.9 | |
| Efold | 100 keV | |
| cos | 0.5 fix | |
| EL | 6.38 0.03 keV | |
| 70 eV | ||
| EW⋆ | eV | |
| 1.86 erg cm/s | ||
| –0.09 erg cm/s | ||
| N | cm-2 fix | |
| 1.02/541 | ||
| F | erg cm-2 s-1 | |
| F | erg cm-2 s-1 | |
| L | erg s-1 | |
| L | erg s-1 | |
Notes: =The best-fit model consists of: three
power laws with tied photon index absorbed by N, N, and
N, plus cold reflection, plus two warm emitters modeled with the
code XSTAR. All components are absorbed by Galactic N cm-2; ⋆=The EW is calculated with respect to the total
observed continuum. The fluxes are observed, and the luminosities
intrinsic (absorption-corrected).
| Table 2: X-ray emission lines | |||
|---|---|---|---|
| Energy (keV) | Flux ( ph cm-2 s-1) | EW (eV) | Identification |
| 0.57 0.01 | 31.0 0.59 | 170 | OVII K |
| 0.73 0.01 | 6.3 2.6 | 49 | OVII RRC |
| 0.87 0.01 | 6.8 2.0 | 67 20 | OVIII RRC |
| 1.34 0.03 | 2.3 1.2 | 42 20 | Mg XI |
| 1.78 0.03 | 2.9 1.2 | 73 | Si XIII K |
| 6.38 0.03 | 14.5 0.4 | Fe K | |
Notes: =The EWs are measured against the total observed continuum at their respective energies.