Testing the gamma-ray burst variability/peak luminosity correlation on a Swift homogeneous sample
Abstract
We test the gamma-ray burst correlation between temporal variability and peak luminosity of the -ray profile on a homogeneous sample of 36 Swift/BAT GRBs with firm redshift determination. This is the first time that this correlation can be tested on a homogeneous data sample. The correlation is confirmed, as long as the 6 GRBs with low luminosity ( erg s-1 in the rest-frame 100-1000 keV energy band) are ignored. We confirm that the considerable scatter of the correlation already known is not due to the combination of data from different instruments with different energy bands, but it is intrinsic to the correlation itself. Thanks to the unprecedented sensitivity of Swift/BAT, the variability/peak luminosity correlation is tested on low-luminosity GRBs. Our results show that these GRBs are definite outliers.
keywords:
gamma-rays: bursts – methods: data analysis1 Introduction
A number of correlations between intrinsic properties of Gamma-Ray Bursts (GRBs) has been discovered since it has become possible to measure their distances. In particular, correlations between properties of the -ray prompt emission as well as of the afterglow at different wavelengths have provided an increasing number of clues to identify the mechanisms and, ultimately, the nature of the GRB progenitors. In addition, some of these correlations have been tentatively used as luminosity estimators, with several implications on their possible usage to constrain the cosmology of the Universe (Ghirlanda et al., 2004; Liang & Zhang, 2005; Firmani et al., 2005).
The increasing number of GRBs with spectroscopic redshift allows to test and better calibrate them. Recently, a crucial contribution has been supplied by the Swift satellite (Gehrels et al., 2004), whose average rate of 100 GRBs per year since launch (November 2004) made it possible to measure the distances of almost 1/3 of its sample, thus duplicating the overall number of GRBs with known redshift since 1997.
The sample of GRBs detected with the Swift Burst Alert Telescope (BAT; Barthelmy et al. 2005) is particularly suitable to test the correlations between intrinsic properties, with the unprecedented benefit of a homogeneous data set, apart from those requiring the peak energy measurement, made difficult by the limited energy band (15–350 keV).
Hereafter we focus on a long-standing correlation between the variability and peak luminosity of the -ray prompt emission (Fenimore & Ramirez-Ruiz, 2000; Reichart et al., 2001). In particular, Reichart et al. (2001; hereafter R01) provided a definition of variability (hereafter denoted as ) that turned out to correlate with the isotropic-equivalent rest-frame 100–1000 keV peak luminosity (hereafter ) for a sample of 11 GRBs with known redshift available at the time, using data from the CGRO/BATSE experiment (Paciesas, et al., 1999).
R01 modelled the variability/peak luminosity correlation (hereafter correlation) with a power law () with ) affected by extrinsic or sample scatter, described by . Recently, Guidorzi et al. (2005; hereafter GFM05) and Guidorzi (2005; hereafter G05) tested the correlation on an extended sample of 32 GRBs with known redshift (GFM05) and on 551 BATSE GRBs, respectively. For the latters, a pseudo-redshift was derived assuming the lag-luminosity correlation (Norris et al., 2000; Band et al., 2004).
Both works confirmed the correlation, but with a lower slope than that derived by R01: (GFM05) and (G05). However, in either case it was pointed out that the scatter around these power laws made the description of a simple power law unsatisfactory. Reichart & Nysewander (2005) applied the same method as R01 to the very results obtained by GFM05, obtaining and , perfectly in agreement with the original values of R01. They ascribed the disagreement to the fact that GFM05 did not deal with the sample variance properly.
More recently, Guidorzi et al. (2006) applied the D’Agostini (2005) method, accounting for the sample variance, to the data sets of both GFM05 and G05. They obtained shallower slopes than those by R01 and Reichart & Nysewander (2005) and larger scatters: in particular, for the sample of 32 GRBs with firm redshift drawn from GFM05 they obtained , , while for the sample of 551 GRBs with pseudo-redshifts of G05 it resulted , .
For more details on the debate concerning the methods to be used, we refer the reader to the original papers by Reichart & Nysewander (2005) and Guidorzi et al. (2006).
Li & Paczyński (2006; hereafter LP06) have recently provided a slightly modified definition of variability, hereafter denoted as , which they found to correlate more tightly with than , without any extrinsic scatter in addition to the uncertainties affecting the single values of the single GRBs. differs from mainly in the choice of the smoothing filter determining the reference light curve with respect to which the variance is evaluated. LP06 chose the Savitzy-Golay filter instead of a simple boxcar used by R01. As a result, selects only the high frequencies, whereas only in the calculation the lower frequency variance can give a contribution.
The variability of the -ray prompt emission light curves is supposed to be produced above the photospheric radius of the fireball, above which radiation becomes optically thin. The interpretations proposed of the correlation mainly invoke the presence of a jet, whose angle , i.e. either the opening angle or the viewing angle (e.g., see Ioka & Nakamura 2001) for some jet patterns, is strongly connected with the observed peak luminosity as well as with the Lorentz factor of the expanding shell(s). The result would be a strong dependence of both and on . For instance, Kobayashi et al. (2002) reproduced the observed correlation through numerical simulations, assuming and a log-uniform distribution in the time delay between next shells, from 1 ms to 1 s. A value of seems to account well for the results by Guidorzi et al. (2006) as well as the anti-correlation between break time and peak luminosity (Salmonson & Galama, 2002). Similar results have been found by Mészáros et al. (2002) and Ramirez-Ruiz & Lloyd-Ronning (2002) under slightly different assumptions.
The new piece of information from this analysis is given by the presence of low-luminosity high-variability GRBs.
In this paper, we test the correlation on a homogeneous sample of 41 GRBs detected with Swift/BAT using fully homogeneous data. We considered two different definitions of variability: that by R01 and that by LP06. In Section 2 we describe the data sample and the selections we made. Sections 3 and 4 report how peak luminosity and variability have been calculated. Results are reported in Sec. 5 and discussed in Sec. 6.
2 The GRB sample
The sample includes 51 long (s) GRBs with spectroscopic redshift detected by Swift/BAT (Gehrels et al., 2004) between the launch (2004, November 20) and October 2006. Out of this sample we selected only those bursts whose -ray profile is entirely covered by BAT during the burst mode (Barthelmy et al., 2005). No further selection was made on the sample, in order to avoid any arbitrary bias in the results. This requirement resulted in the rejection of 10 GRBs. In fact, in these cases the observation of Swift/BAT switched from burst mode to the survey mode before of the end of the prompt emission. The light curve results with a truncated profile. This is the case of GRB 050318, whose light curve stops about 32 s after the trigger, as well as of GRB 050820A, GRB 050904 and GRB 060218. For GRB 060124 only the precursor was recorded in event mode, while the main event was observed in survey mode. For GRB 060906 the light curve is incomplete at the beginning, because the trigger probably missed the true onset of the burst. No burst mode event file is available for GRB 060505, as BAT observed it only in survey mode. We chose not to make use of the background subtracted light curves acquired during the survey mode to keep the sample as homogeneous as possible. GRB 050408 was detected by XRT and UVOT, but not by BAT, although the light curve of its prompt emission is available from other instruments (HETE-2/FREGATE; Atteia et al. 2003). Nevertheless, we did not consider it in this work because we focused on BAT data for the reasons reported above. In the case of GRB 050802 and GRB 051227A the problem is in the redshift determination. For the former only a tentative redshift exists (Cummings et al., 2005), which is at odds with the interpretation of the Swift/UVOT results (McGowan et al., 2005). For GRB 051227A there is a redshift determination of the putative host galaxy (Foley et al., 2005a), but it is still unclear if this is the real host galaxy.
After this selection the sample has shrunk to 41 long GRBs, entirely covered by BAT and processed through the same procedure. Therefore, this work investigates the relation based on a completely homogeneous sample.
The BAT event files were retrieved from the Swift public archive 111http://swift.gsfc.nasa.gov/docs/swift/archive/ and analysed through the standard BAT analysis software distributed within FTOOLS v6.1. For each GRB we extracted mask-tagged light curves for a number of different binning times in the total nominal energy band (– keV) 222The effective band is – keV, because photons with energy above keV become transparent to the coded mask and are treated as background by the mask-weighting technique (e.g., Sakamoto et al. 2006)., through the tool batmaskwtevt adopting the ground-refined coordinates provided by the BAT team for each burst. These curves are therefore already background subtracted according to the coded mask technique (Barthelmy et al. 2005 and references therein). For each burst the BAT detector quality map was obtained by processing the next earlier enable/disable map of the detectors, telling which detectors were disabled in flight because too noisy. We also applied the energy calibration to the event file making use of the closest-in-time gain/offset file through the tool bateconvert, as suggested by the BAT team333http://swift.gsfc.nasa.gov/docs/swift/analysis/threads.. Finally these light curves are expressed as count rates with uncertainties: the rates are background-subtracted counts per second per fully illuminated detector for an equivalent on-axis source, as the default corrections are applied: ndets, pcode, maskwt, flatfield.
We also studied the behaviour of the background fluctuations in burstless regions of the light curves and we found that the mask-tagged rates, , fluctuate compatibly with a white noise with sigma ( and are the rate and its uncertainty of the -th bin, respectively; see Appendix). We concluded that an upper limit of 2–4% (4–6%) at 90% (99%) confidence level can be derived on the presence of a possible extra variance (of instrumental origin, for instance) in addition to that due to the Poisson counting statistics, implicitly assumed during the light curve extraction with the tool batbinevt.
We found that it is not correct to perform the same analysis on BAT light curves with raw counts, i.e. not masked. In fact, we found that the GRB profile itself can be dramatically contaminated by other sources and by background variations, with time, due to the slewing of the spacecraft during the prompt emission, for most GRBs. Furthermore, we found that BAT light curves with raw counts are severely affected by extra variance, which is comparable with the Poisson variance due to the counting statistics, in agreement with previous results (LP06). Therefore, we conclude that the BAT light curves of most GRBs with raw counts, not masked, are not suitable for temporal variability studies.
3 Peak luminosity
For each GRB we extracted the mask-tagged light curve with a binning time of ms in the 15–350 keV energy band. We determined the 1-s time interval with the highest total counts and assumed this as the time interval corresponding to the 1-s peak count rate.
We extracted the mask weighted spectrum in this time interval using the tool batbinevt. We applied all the corrections required: we updated it through batupdatephakw and generated the detector response matrix using batdrmgen. Then we used batphasyserr in order to account for the BAT systematics as a function of energy. Finally we grouped the energy channels of the spectrum by imposing a 5- (or 3- when the S/N was too low) threshold on each grouped channel. We fitted the resulting photon spectrum, (ph cm-2s-1keV-1), with a power law with pegged normalisation (pegpwrlw model under XSPEC v.12), except for GRB 050525A and GRB 060927 where a cutoff power law was used, in the rest-frame energy band keV. The choice of the energy band is connected with the original definition by R01 (see their eq. 9) also used by GFM05 (their eq. 7).
Therefore the GRBs rest-frame -keV isotropic-equivalent peak luminosities were computed using:
| (1) |
where is the luminosity distance at redshift , is energy expressed in keV. Finally we derived the uncertainty on the peak luminosity by propagating that of the measured flux.
Concerning the six BAT GRBs shared with the sample of GFM05, we compared the two sets of peak luminosities: these GRBs are 050315, 050319, 050401, 050505, 050525A and 050603. They are consistent with those of GFM05, apart from two cases. For 050401 our measure, where , is , while GFM05 reported . For 050603, we obtained to be compared with GFM05’s . The reason in either case resides in a slightly different choice of the 1-s time interval around the peak. GFM05 determined this from the 40–350 keV light curve to match the 40–700 keV of the BeppoSAX/GRBM, while we used the 15–350 keV. The choices of the 1-s time interval turned out to differ by 1–2 s in either case. This, combined with the fact that both of these GRBs exhibit a sharp peak, turned into the discrepancies provided above. We note that in both cases they still lie in the - region with high and high , consistently with the correlation.
4 Variability
4.1 R01 definition
The main difference between our data set and those used by R01 and GFM05 is that our light curves are expressed in background-subtracted rates and not in counts. This fact is due to the way BAT, which is a coded mask, has been conceived. Hereafter we assumed a Poissonian variance for the statistical fluctuations of the light curves, as we proved in Appendix A. The formula we used to compute the variability, according to the R01 definition, is basically the same as those of R01 and GFM05, with no extra-Poissonian noise term, given that our rates are already background-subtracted.
| (2) |
where and are the same coefficients as those introduced by R01 in their eqs. 6-7. The differences between our formula, eq. 7 of R01 and eq. 4 of GFM05, are the replacement of the counts with the rates in the first terms of both numerator and denominator, where the original represented the GRB signal, and the replacement of the counts with the statistical noise variances affecting the rates in the terms to be subtracted, where the original counts represented the noise. The sum, , runs over the bins encompassing the GRB time profile. The background term in the original formulae of R01 has been set to zero, as it has already been removed during the extraction of the light curves.
For each GRB we estimated the smoothing time scale (), defined by R01 as the shortest cumulative time interval during which a fraction of the total counts above background has been collected. For each GRB we calculated and the corresponding variability as a function of the binning time. We chose the values obtained with the binning time that fulfilled the requirements reported by GFM05 concerning the ratio . On one side, when this ratio is too small, the light curve is dominated by statistical fluctuations, while, on the other side, when the binning is too coarse the variability is underestimated. A detailed description of these criteria is provided by GFM05.
4.2 LP06 definition
Concerning the definition of variability given by LP06, hereafter denoted by , we point out a number of different choices with respect to the their analysis. First we estimated from the background-subtracted mask-tagged light curves, while LP06 used the raw counts light curves of the 7 Swift/BAT GRBs of their sample (Li, private comm.). We assumed no extra-Poissonian variance to be subtracted, unlike LP06. We adapted eqs. 1–3 of LP06 accordingly and obtained the following:
| (3) |
where is the value for the -th bin of the reference light curve obtained with the Savitzky-Golay filter with a smoothing window of Tf (). is the same weight as that used by LP06 and accounts for the fact that the set of is not completely statistically independent from . As for the determination of the peak count rate, , we searched the light curve of the same GRB a number of times, each time increasing the binning time, until we found the peak 5- higher than the contiguous bins. This turned out to be very accurate, particularly for weak GRBs. In order to comply with the procedure of LP06, corresponds to the total number of bins encompassing the time interval which defines the , i.e. from 5% to 95% of the total fluence. The values of have been calculated using the ftool battblocks. Values of have been derived from the 64-ms light curves.
5 Results
Table 1 reports the results of , , and obtained for the sample of 41 GRBs.
| GRB | Peak Lum. | References for | ||||
|---|---|---|---|---|---|---|
| (s) | erg s-1 | |||||
| 050126 | 1.29 | Berger et al. (2005b) | ||||
| 050223 | Berger & Shin (2006d) | |||||
| 050315 | Kelson & Berger (2005) | |||||
| 050319 | Fynbo et al. (2005c) | |||||
| 050401 | Fynbo et al. (2005a) | |||||
| 050416A | Cenko et al. (2005) | |||||
| 050505 | Berger et al. (2005c) | |||||
| 050525A | Foley et al. (2005b) | |||||
| 050603 | Berger & Becker (2005a) | |||||
| 050730 | Chen et al. (2005) | |||||
| 050803 | Bloom et al. (2005) | |||||
| 050814 | – | Jakobsson et al. (2006a) | ||||
| 050824 | – | Fynbo et al. (2005b) | ||||
| 050908 | Fugazza et al. (2005) | |||||
| 050922C | Jakobsson et al. (2005) | |||||
| 051016B | Soderberg et al. (2005) | |||||
| 051109A | Quimby et al. (2005) | |||||
| 051111 | Hill et al. (2005) | |||||
| 060115 | Piranomonte et al. (2006) | |||||
| 060206 | Fynbo et al. (2006b) | |||||
| 060210 | Cucchiara et al. (2006a) | |||||
| 060223A | Berger et al. (2006b) | |||||
| 060418 | Dupree et al. (2006) | |||||
| 060502A | Cucchiara et al. (2006b) | |||||
| 060510B | Price (2006) | |||||
| 060512 | Bloom et al. (2006) | |||||
| 060522 | Cenko et al. (2006) | |||||
| 060526 | Berger & Gladders (2006a) | |||||
| 060604 | Castro-Tirado et al. (2006) | |||||
| 060605 | Still et al. (2006) | |||||
| 060607 | Ledoux et al. (2006) | |||||
| 060614 | Fugazza et al. (2006b) | |||||
| 060707 | Jakobsson et al. (2006d) | |||||
| 060714 | Jakobsson et al. (2006e) | |||||
| 060729 | Thoene et al. (2006) | |||||
| 060904B | Fugazza et al. (2006a) | |||||
| 060908 | Rol et al. (2006) | |||||
| 060912A | Jakobsson et al. (2006c) | |||||
| 060926 | D’Elia et al. (2006) | |||||
| 060927 | Fynbo et al. (2006a) | |||||
| 061007 | s | Jakobsson et al. (2006b) |
-
a
Isotropic-equivalent peak luminosity in erg s-1 in the rest-frame 100–1000 keV band, for peak fluxes measured on a 1-s time-scale, km s-1 Mpc-1, , and .
5.1 R01 definition
Significant values of have been obtained for 36 GRBs shown in Fig. 1 (circles). In the remaining 5 cases this was not possible for different reasons. For GRB 050814 and GRB 050824 we could not find any binning matching the requirements mentioned above. While for GRB 050126, GRB 050908 and GRB 060512 turned out to be consistent with zero within uncertainties.
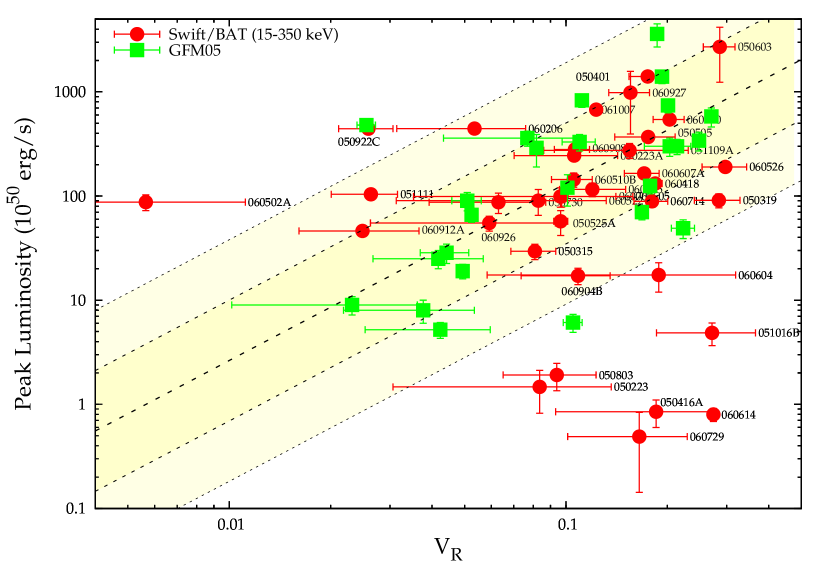
Figure 1 also shows the sample of 26 GRBs of GFM05 (squares): the underluminous GRB 980425, which belongs to the GFM05 sample, is not shown because of scale compression reasons; moreover, its uncertainty on is relatively large.
We do not show the values GFM05 estimated for six Swift/BAT bursts in common with our sample. Except for the case of GRB 050319, our values of for the other 5 GRBs are broadly consistent with those of GFM05, some differences being due to a different energy band choice (see above). In general, we note that our are systematically somewhat higher than those of GFM05: this is so because we included low-energy bands, in which GRBs are known to last longer. In addition, we know that in some cases has a strong dependence on the energy band (GFM05), although the definition of by R01 was originally thought to account for the narrowing of pulses at higher energies (Fenimore, et al., 1995; Norris et al., 1996). In the case of GRB 050319 we measured , while GFM05 obtained . The inconsistency is due to the fact that the original event file, available at the time and used by GFM05 to extract the light curve, was missing the first sequence of impulses well before the trigger time. Therefore, we consider the value reported in this paper as the correct one.
We tested the existence of the correlation over a number of different GRB data sets. Our sample of 36 BAT GRBs shows no significant correlation according to Pearson’s, Spearman’s and Kendall’s coefficients, whose corresponding no-correlation probabilities are 72%, 51% and 37%, respectively. However, from Fig. 1 we note that in the region of high and low , rather unexplored by previous data sets (R01; GFM05), there are six GRBs: 050223, 050416A, 050803, 051016B, 060614, 060729. If one selects the BAT GRBs from our sample with , the resulting sample of 30 GRBs shows a significant improvement of the correlation: the probability of no correlation becomes 16%, 5.1% and 3.1%, respectively. Likewise, if we merge the two samples (GFM05’s and ours) we obtain similar results: when the 7 bursts with are taken out from the total sample of 62 GRBs, the correlation becomes significant with a no-correlation probability of according to the non-parametric tests.
Finally, we calculated in the 25–350 keV energy band, i.e. ignoring the lowest energy channel 15–25 keV, of the six low-luminosity outliers. The aim was to establish the importance of the low-energy channel contribution to the resulting , especially when compared with the results of GFM05, whose low-energy threshold was 40 keV. We found that in all cases resulted systematically higher, although still compatible within uncertainties. The only case in which in the 25–350 keV was significantly higher than for the whole band was 060614 due to its small statistical uncertainty. This corroborates the nature of outliers of the six GRBs considered: we can rule out that their high values of are due to the presence of the low-energy photons not considered by previous data sets.
5.2 LP06 definition
Significant values of have been obtained only for 10 GRBs shown in Fig. 2. In the remaining 31 cases the variability resulted consistent with zero within uncertainties (see Table 1).
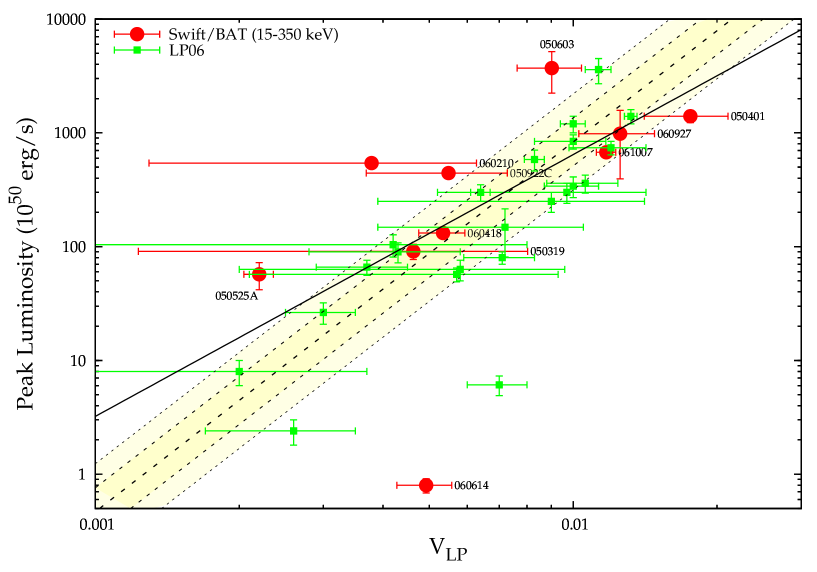
Despite the small number of GRBs with significant , the correlation appears to be significant within 1–2% according to the non-parametric tests: 1.1% (Spearman) and 1.6% (Kendall). See Table 2 for further details. Figure 2 shows these 10 BAT GRBs as well as the sample of 22 GRBs of LP06. Shaded areas show the 1- and 2- regions around the best-fitting power law obtained by LP06 using the fitexy routine, with a slope of and a (20 dof). If we ignore GRB 060614, which clearly lies far away from any power-law correlation between and , and use the same routine as LP06, we obtain a best-fitting value of the slope of and (7 dof). The is clearly too high and therefore, although the correlation appears to be real, the description in terms of a power-law with no sample scatter, as the usage of the routine fitexy assumes, is not acceptable. We note that this conclusion also holds for the very same result of LP06, whose has a null hypothesis probability of 0.75%.
| Set of GRB(a) | Coefficient (Probability) | ||
|---|---|---|---|
| Pearson’s | Spearman’s | Kendall’s | |
| 36 GRBs ( vs. ) | () | () | () |
| 30 GRBs ( vs. ) | () | () | () |
| 62 GRBs(b) ( vs. ) | () | () | () |
| 55 GRBs(b) ( vs. ) | () | () | () |
| 10 GRBs ( vs. ) | () | () | () |
- a .
- b This sample resulted from the merging of our sample with that of Guidorzi et al. (2005).
6 Discussion
Interestingly, if one ignores the 6 GRBs from our sample of Swift/BAT with low , specifically , the remaining homogeneous sample of 30 BAT GRBs, for which we could derive a reliable estimate of in the 15–350 keV energy band, is fully consistent in the - plot with those from previous detectors, thus confirming the existence of the correlation. This is remarkable, given that BAT is a different kind of -ray detector and has a different energy band from that of the BeppoSAX/GRBM, 40–700 keV, whose data mainly comprise the sample of 32 GRBs of GFM05. Another important confirmation provided by this BAT sample is that the scatter of the correlation originally found by R01 and GFM05, despite their alternative descriptions of it, is not due to the combination of data from different instruments with different effective areas, response functions, statistical noises, and energy bands, but it is intrinsic to the correlation. In fact, for the first time our data set represents a homogeneous sample of 36 GRBs with measured redshift acquired with the very same detector and with the very same kind of data for each GRB.
What is new with this BAT sample is the presence of 6 (out of 36) low-luminosity GRBs (). If one ignores GRB 980425, a peculiar underluminous and very nearby burst, from the sample of GFM05 and R01 it turns out that none of the previous GRBs has . This is not surprising, given the unprecedented sensitivity of BAT. Therefore these 6 BAT GRBs allow us to test, for the first time, whether the correlation holds for low-luminosity GRBs. Figure 1 clearly shows that none of them lies where one might have expected from the correlation. Instead, they exhibit relatively high values of . This is proven by the correlation coefficients, in particular the non-parametric Spearman’s and Kendall’s , according to which the correlation is significant (5.1% and 3.1% respectively) or not, depending whether these 6 low-luminosity GRBs are excluded or not. This is confirmed by merging our sample of BAT with that of GFM05: the correlation is significant, provided that low-luminosity bursts are excluded (see Table 2).
Guidorzi et al. (2007) have investigated the nature of the 6 BAT GRBs outliers of the correlation and found strong evidence that they are also outliers of the anti-correlation, discovered by Norris et al. (2000), between the rest-frame temporal lag and the peak luminosity. In particular, they found that these GRBs are characterised by a small or negligible time lags and a relatively low luminosity. We refer the reader to the paper by Guidorzi et al. (2007) for more details.
Concerning the definition of variability, , given by LP06, we found that this still correlates with , although our results differ from those by LP06 (see Fig. 2 and Table 2). In particular, we find the description of the correlation in terms of a power law with no extrinsic scatter inadequate, given the high values of yielded by both samples, ours and LP06’s. Regarding our sample of 41 BAT GRBs, we find that, unlike the definition of by R01, the smoothing filter adopted by LP06 in their definition of cuts off the low-frequency variability of GRBs. This results in a selection of a smaller sample of GRBs with significant (high-frequency) variability: 10 vs. the 36 obtained for the R01 definition. We note that GRB 060614 confirms its nature of outlier of the correlation, no matter which choice of the definition of variability we adopt (Fig. 2).
In general, from Table 2 we note that the Pearson linear correlation coefficient is systematically less significant than the other two. This supports the finding that the correlation shows a clear scatter around the best-fitting power law. Therefore this scatter must be taken into account properly (e.g. with the D’Agostini method), when fitting the data (see D’Agostini 2005 and Guidorzi et al. 2006).
6.1 Low-luminosity GRBs and the Amati correlation
We tested if the 6 low-luminosity GRBs are also outliers of the - (Amati et al., 2002) ( is the isotropic energy released in the keV rest-frame band) as well as of the - (Yonetoku et al., 2004; Ghirlanda et al., 2005) correlations. is the intrinsic peak energy of the total spectrum of a burst, where is the peak of the spectrum in the observer frame. A correlation between temporal variability and was originally found by Lloyd-Ronning & Ramirez-Ruiz (2002) for a number of bursts with pseudo-redshift derived assuming the variability/peak luminosity correlation. Taking into account that also correlates with and with (isotropic peak luminosity), we test whether the breaking of the correlation in the case of these 6 bursts is explained by anomalous values of .
For two bursts, XRF 050416A (Sakamoto et al., 2006) and GRB 060614 (Amati et al., 2007) has already been reported elsewhere. Both GRBs are consistent with the Amati relation. In particular, XRF 050416A remarkably confirms it down to the XRFs region (Sakamoto et al., 2006). For the remaining four GRBs, the BAT photon spectrum can be fit with a single power law , where is the photon index. In order to constrain , we fitted the total spectrum of each burst with a cutoff power law by fixing the power law index to the typical value of and letting the break energy free to vary. We took the lower/upper limit for from the 90% confidence level interval on one parameter: if the interval included or lay close to the lower (higher) boundary of the BAT passband, we assumed the upper (lower) limit on . Our results are broadly in agreement with the empirical correlation found by Zhang et al. (2007) between and .

Results are reported in Table 3. All of the 6 bursts (or their limits) turned out to lie in the 2 sigma region of the Amati relation (see Amati 2006).

We also found that the two bursts with firm as well as two with upper limits are consistent with the - correlation, while the remaining two lower limits on for GRB 050803 and GRB 060729 are not, as shown in Fig. 3. The better consistency with the - than with the - correlation can be explained with the fact that better correlates with the time integrated released energy, as proven also by the scatter of the correlation between and (Ghirlanda et al., 2005).
We also tested whether the duration of these events correlates with their peak luminosity. To this aim, in Fig. 4 the rest-frame is plotted against for the entire sample of 41 Swift/BAT GRBs considered. is the time interval collecting from 5% to 95% of the total fluence in the observer frame. For each burst we used the value published by the BAT team in the refined GCN circulars. Empty circles correspond to the 6 low-luminosity GRBs with a significant measure of variability. Apparently there is no hint for correlation and also no evidence for a different behaviour of the 6 low-luminosity GRBs with respect to the others. The result does not change in essence when we replace with .
We conclude that the fact that the variability of these 6 low-luminosity high-variability GRBs does not correlate with the peak luminosity is not connected with their , which correlates with as almost all of the long GRBs with known redshift (Amati, 2006).
7 Conclusions
We tested the variability/peak luminosity () correlation with a homogeneous sample of 36 GRBs detected with Swift/BAT in the 15–350 keV energy band with firm redshift. We adopted two different definitions of variability: that by Reichart et al. (2001; ) and that by Li & Paczyński (2006; ), which differs from the former for a different smoothing filter. The most interesting results have been derived with . If we consider only the GRBs with peak luminosity comparable with those of previous samples, i.e. erg s-1 in the rest-frame 100–1000 keV energy band, we confirm the correlation and its intrinsic dispersion around the best-fitting power law obtained by Guidorzi et al. (2006): () and .
Interestingly, all of the 6 low-luminosity GRBs detected by Swift/BAT turn out to be outliers to the correlation, showing higher values of than expected. This does not contradict the results from previous samples of GRBs with known redshift. Instead, we are led to conclude that the correlation does not hold any more for low-luminosity GRBs. We also find that these bursts are consistent with the – correlation (Amati et al., 2002) and four of them also with the – correlation (Yonetoku et al., 2004; Ghirlanda et al., 2005).
Unlike the results obtained by Li & Paczyński (2006), we do not find evidence for a tighter correlation using instead of . Rather, fewer GRBs appear to have a significant measure of ; we ascribe this to the fact that the smoothing filter adopted by Li & Paczyński (2006) to construct the reference light curve with respect to which the variability is computed, only selects high-frequency variability.
Acknowledgments
This work is supported by ASI grant I/R/039/04 and by the Ministry of University and Research of Italy (PRIN 2005025417). We thank L. Amati for independent checks in some parts and the anonymous referee for useful comments. We gratefully acknowledge the contributions of dozens of members of the BAT team who built and maintain this instrument.
Appendix A Statistical noise of BAT mask-tagged light curves
We report the analysis performed on the BAT mask-tagged light curves of the GRBs considered in this work, aimed at studying the statistical noise. As the GRB itself is characterised by intrinsic temporal variance which is unknown a priori, we limited to the pre- and post-burst regions of the light curves, where the background is supposed to be the dominant source of statistical fluctuations. In order to make sure that we excluded the entire light curve of the GRB, we binned it spanning very different integration times (from 64 ms to 32 s) and checked that no trend in the residuals was visible.
Let and be the count rate and its uncertainty, respectively, of the -th bin of a 64-ms mask-tagged BAT light curve. This light curve is the result of the BAT standard pipeline already summarised in Sec. 2 (see also Barthelmy et al. 2005). Uncertainties (, where is the total number of bins of the selected portion of light curve) are calculated by propagation of errors, starting from the raw counts assumed to be affected by purely Poissonian noise through the ftool batbinevt.
We tested the following null hypothesis: each is a single realisation of a normal random variable with null expected value and sigma equal to : . Little can be inferred on a random variable from a single realisation. However, as long as this hypothesis is true, the various () can be seen as different realisations of the same random variable, , hereafter called “normalized rate”, which has a standard normal density: .
So we studied the observed distribution of for each single light curve removed of the GRB profile. We fitted the observed distribution with a Gaussian .
In particular, we are interested in constraining the possible presence of any additional source of statistical noise (e.g. instrumental) to the Poissonian one.
More generally, should the various fluctuate more than , so that the true variance is , where is the fraction of additional non-Poissonian variance, the resulting should be greater than unity. More precisely, we should find .
Therefore we fitted the observed distribution of with , first by imposing . In every case we found acceptable values, confirming that no evidence for additional noise has been found.
In particular, we were interested in setting a limit to with a given confidence level. Following Papoulis & Pillai (2002; p. 313–314), in the case of unknown we used the sample variance defined as:
| (4) |
where is the single realisation of and is the mean value. The random variable follows a distribution, so that we can constrain , i.e. , through the following:
| (5) |
at confidence level; is the percentile of the distribution. In most cases was big enough () to ensure the following approximation:
| (6) |
where is the percentile of the standard normal density.
We show the example of GRB 050401. The distribution of , , can be fit with a Gaussian , , as shown in Fig. 5.

The sample variance resulted . The consequent upper limit on turns out to be 2.7% (4.3%) at 90% (99%) confidence level.
References
- Amati et al. (2002) Amati L. et al., 2002, A&A, 390, 81
- Amati (2006) Amati L., 2006, MNRAS, 372, 233
- Amati et al. (2007) Amati L. et al., 2007, A&A, 463, 913
- Atteia et al. (2003) Atteia J.-L. et al., 2003, AIP Conf. Ser. Vol. 662, A Workshop Celebrating the First Year of the HETE Mission, p. 17
- Band et al. (2004) Band D. L., Norris J. P., Bonnell J. T., 2004, ApJ, 613, 484
- Barthelmy et al. (2005) Barthelmy S. D., et al., 2005, Space Science Review, 120, 143
- Berger & Becker (2005a) Berger E., Becker G., 2005a, GCN Circ., 3520
- Berger et al. (2005b) Berger E., Cenko S. B., Kulkarni S. R., 2005b, GCN Circ., 3088
- Berger et al. (2005c) Berger E., Cenko S. B., Steidel C., Reddy N., Fox D. B., 2005c, GCN Circ., 3368
- Berger & Gladders (2006a) Berger E., Gladders M., 2006a, GCN Circ., 5170
- Berger et al. (2006b) Berger E., Kulkarni S. R., Rau A., Fox D. B., 2006b, GCN Circ., 4815
- Berger & Shin (2006d) Berger E., Shin M.-S., 2006d, GCN Circ., 5283
- Bloom et al. (2006) Bloom J. S., Foley R. J., Koceveki D., Perley D., 2006, GCN Circ., 5217
- Bloom et al. (2005) Bloom J. S., Perley D., Foley R., Prochaska J. X., Chen H. W., Starr D., 2005, GCN Circ., 3758
- Castro-Tirado et al. (2006) Castro-Tirado A. J., Amado P., Negueruela I., Gorosabel J., Jelinek M., de Ugarte Postigo A., 2006, GCN Circ., 5218
- Cenko et al. (2006) Cenko S. B., Berger E., Djorgovski S. G., Mahabal A. A., Fox D. B., 2006, GCN Circ., 5155
- Cenko et al. (2005) Cenko S. B., Kulkarni S. R., Gal-Yam A., Berger E., 2005, GCN Circ., 3542
- Chen et al. (2005) Chen H.-W., Thompson I., Prochaska J. X., Bloom J., 2005, GCN Circ., 3709
- Cucchiara et al. (2006a) Cucchiara A., Fox D. B., Berger E., 2006a, GCN Circ., 4729
- Cucchiara et al. (2006b) Cucchiara A., Price P. A., Fox D. B., Cenko S. B., Schmidt B. P., 2006b, GCN Circ., 5052
- Cummings et al. (2005) Cummings J., et al., 2005, GCN Circ., 3479
- D’Agostini (2005) D’Agostini G., 2005, physics/0511182
- D’Elia et al. (2006) D’Elia V., et al., 2006, GCN Circ., 5637
- Dupree et al. (2006) Dupree A. K., Falco E., Prochaska J. X., Chen H.-W., Bloom J. S., 2006, GCN Circ., 4969
- Fenimore, et al. (1995) Fenimore E. E., et al., 1995, ApJL, 448, L101
- Fenimore & Ramirez-Ruiz (2000) Fenimore E. E., Ramirez-Ruiz E., 2000, astro-ph/0004176
- Firmani et al. (2005) Firmani C., Ghisellini G., Ghirlanda G., Avila-Reese V., 2005, MNRAS, 360, L1
- Foley et al. (2005a) Foley R. J., Bloom J. S., Prochaska J. X., Illingworth G. D., Holden B. P., Magee D., Challis P., Garg A., 2005a, GCN Circ., 4409
- Foley et al. (2005b) Foley R. J., Chen H.-W., Bloom J., Prochaska J. X., 2005b, GCN Circ., 3483
- Fugazza et al. (2005) Fugazza D., et al., 2005, GCN Circ., 3948
- Fugazza et al. (2006a) Fugazza D., et al., 2006a, GCN Circ., 5513
- Fugazza et al. (2006b) Fugazza D., Malesani D., Romano P., Tagliaferri G., Covino S., Chincarini G., Valle M. D., Fiore F., Stella L., 2006b, GCN Circ., 5276
- Fynbo et al. (2005a) Fynbo J. P. U., et al., 2005a, GCN Circ., 3176
- Fynbo et al. (2005b) Fynbo J. P. U., et al., 2005b, GCN Circ., 3874
- Fynbo et al. (2005c) Fynbo J. P. U., Hjorth J., Jensen B. L., Jakobsson P., Moller P., Naranen J., 2005c, GCN Circ., 3136
- Fynbo et al. (2006a) Fynbo J. P. U., et al., 2006a, GCN Circ., 5651
- Fynbo et al. (2006b) Fynbo J. P. U., et al.., 2006b, A&A, 451, L47
- Gehrels et al. (2004) Gehrels N., et al., 2004, ApJ, 611, 1005
- Ghirlanda et al. (2004) Ghirlanda G., Ghisellini G., Lazzati D., Firmani C., 2004, ApJL, 613, L13
- Ghirlanda et al. (2005) Ghirlanda G., Ghisellini G., Celotti A., Firmani C., Bosnjak Z., 2005, MNRAS, 360, L45
- Guidorzi (2005) Guidorzi C., 2005, MNRAS, 364, 163
- Guidorzi et al. (2005) Guidorzi C., Frontera F., Montanari E., Rossi F., Amati L., Gomboc A., Hurley K., Mundell C. G., 2005, MNRAS, 363, 315 (GFM05)
- Guidorzi et al. (2006) Guidorzi C., Frontera F., Montanari E., Rossi F., Amati L., Gomboc A., Mundell C. G., 2006, MNRAS, 371, 843
- Guidorzi et al. (2007) Guidorzi C., Rizzuto D., Romano P., Covino S., et al. 2007, MNRAS, submitted
- Hill et al. (2005) Hill G., Prochaska J. X., Fox D., Schaefer B., Reed M., 2005, GCN Circ., 4255
- Ioka & Nakamura (2001) Ioka K., Nakamura T., 2001, ApJL, 554, L163
- Jakobsson et al. (2005) Jakobsson P., Fynbo J. P. U., Paraficz D., Telting J., Jensen B. L., Hjorth J., Castro Ceron J. M., 2005, GCN Circ., 4029
- Jakobsson et al. (2006a) Jakobsson P., et al., 2006a, A&A, 447, 897
- Jakobsson et al. (2006b) Jakobsson P., Fynbo J. P. U., Tanvir N., Rol E., 2006b, GCN Circ., 5716
- Jakobsson et al. (2006c) Jakobsson P., Levan A., Chapman R., Rol E., Tanvir N., Vreeswijk P., Watson D., 2006c, GCN Circ., 5617
- Jakobsson et al. (2006d) Jakobsson P., Tanvir N., Jensen B. L., Fynbo J. P. U., Postigo A. d. U., Gorosabel J., Klose S., Vreeswijk P., 2006d, GCN Circ., 5298
- Jakobsson et al. (2006e) Jakobsson P., Vreeswijk P., Fynbo J. P. U., Hjorth J., Starling R., Kann D. A., Hartmann D., 2006e, GCN Circ., 5320
- Kelson & Berger (2005) Kelson D., Berger E., 2005, GCN Circ., 3101
- Kobayashi et al. (2002) Kobayashi S., Ryde F., MacFadyen A., 2002, ApJ, 577, 302
- Ledoux et al. (2006) Ledoux C., Vreeswijk P., Smette A., Jaunsen A., Kaufer A., 2006, GCN Circ., 5237
- Li & Paczyński (2006) Li L.-X., Paczyński B., 2006, MNRAS, 366, 219 (LP06)
- Liang & Zhang (2005) Liang E., Zhang B., 2005, ApJ, 633, 611
- Lloyd-Ronning & Ramirez-Ruiz (2002) Lloyd-Ronning N.M. & Ramirez-Ruiz E., 2002, ApJ, 576, 101
- McGowan et al. (2005) McGowan K., Morgan A., Mason K., Kennedy T., 2005, GCN Circ., 3745
- Mészáros et al. (2002) Mészáros P., Ramirez-Ruiz E., Rees M. J., Zhang B., 2002, ApJ, 578, 812
- Norris et al. (2000) Norris J. P., Marani G. F., Bonnell J. T., 2000, ApJ, 534, 248
- Norris et al. (1996) Norris J. P., Nemiroff R. J., Bonnell J. T., Scargle J. D., Kouveliotou C., Paciesas W. S., Meegan C. A., Fishman G. J., 1996, ApJ, 459, 393
- Paciesas, et al. (1999) Paciesas W. S., et al., 1999, ApJS, 122, 465
- Page et al. (2005) Page K.L. et al., 2005, MNRAS, 363, L76
- Papoulis & Pillai (2002) Papoulis A., Pillai S. U., 2002, Probability, Random Variables and Stochastic Processes, 4th ed.. McGraw-Hill, Inc., New York, NY, USA
- Piranomonte et al. (2006) Piranomonte S., et al., 2006, GCN Circ., 4520
- Price (2006) Price P. A., 2006, GCN Circ., 5104
- Quimby et al. (2005) Quimby R., Fox D., Hoeflich P., Roman B., Wheeler J. C., 2005, GCN Circ., 4221
- Ramirez-Ruiz & Lloyd-Ronning (2002) Ramirez-Ruiz E., Lloyd-Ronning N. M., 2002, New Astronomy, 7, 197
- Reichart et al. (2001) Reichart D. E., Lamb D. Q., Fenimore E. E., Ramirez-Ruiz E., Cline T. L., Hurley K., 2001, ApJ, 552, 57 (R01)
- Reichart & Nysewander (2005) Reichart D. E., Nysewander M. C., 2005, ApJ, submitted (astro-ph/0508111)
- Rol et al. (2006) Rol E., Jakobsson P., Tanvir N., Levan A., 2006, GCN Circ., 5555
- Sakamoto et al. (2006) Sakamoto T. et al., 2006, ApJ, 636, L73
- Salmonson & Galama (2002) Salmonson J. D., Galama T. J., 2002, ApJ, 569, 682
- Soderberg et al. (2005) Soderberg A. M., Berger E., Ofek E., 2005, GCN Circ., 4186
- Still et al. (2006) Still A., et al., 2006, GCN Circ., 5226
- Thoene et al. (2006) Thoene C. C., Levan A., Jakobsson P., Rol E., Gorosabel J., Jensen B. L., Hjorth J., Vreeswijk P., 2006, GCN Circ., 5373
- Yonetoku et al. (2004) Yonetoku D. et al., 2004, ApJ, 609, 935
- Zhang et al. (2007) Zhang B. et al., 2007, ApJ, 655, L25